

Key Points
Deletion of genes encoding PU.1 and Spi-B in mice results in precursor B-ALL at 100% incidence.
Genomic analysis reveals mutations in Janus kinase genes that confer growth advantages to B cells in cooperation with Spi1/Spib deletion.

Abstract
Precursor B-cell acute lymphoblastic leukemia (B-ALL) is associated with recurrent mutations that occur in cancer-initiating cells. There is a need to understand how driver mutations influence clonal evolution of leukemia. The E26-transformation-specific (ETS) transcription factors PU.1 and Spi-B (encoded by Spi1 and Spib) execute a critical role in B-cell development and serve as complementary tumor suppressors. Here, we used a mouse model to conditionally delete Spi1 and Spib genes in developing B cells. These mice developed B-ALL with a median time to euthanasia of 18 weeks. We performed RNA and whole-exome sequencing (WES) on leukemias isolated from Mb1-CreΔPB mice and identified single nucleotide variants (SNVs) in Jak1, Jak3, and Ikzf3 genes, resulting in amino acid sequence changes. Jak3 mutations resulted in amino acid substitutions located in the pseudo-kinase (R653H, V670A) and in the kinase (T844M) domains. Introduction of Jak3 T844M into Spi1/Spib-deficient precursor B cells was sufficient to promote proliferation in response to low IL-7 concentrations in culture, and to promote proliferation and leukemia-like disease in transplanted mice. We conclude that mutations in Janus kinases represent secondary drivers of leukemogenesis that cooperate with Spi1/Spib deletion. This mouse model represents a useful tool to study clonal evolution in B-ALL.
Introduction
Acute lymphoblastic leukemia is the most common type of childhood cancer, with approximately 6000 new cases diagnosed in the United States each year.1 Most leukemias originate within the B-cell, rather than the T-cell, lineage.2,3 Precursor B-cell acute lymphoblastic leukemia (pre-B-ALL) is a disease that is revealed by the presence of transformed precursor B cells in the blood, bone marrow, and tissues, and is most common in 1- to 5-year-old patients.4 Most pre-B-ALL cases are associated with genetic abnormalities that include chromosomal translocations or point mutations. In pre-B-ALL, up to two thirds of genes with point mutations encode transcriptional regulators such as Pax-5, Ikaros, or EBF1.3 Pre-B-ALL cells are frequently arrested at an early stage of development, express interleukin-7 receptor (IL-7R), and have high levels of Janus kinase (JAK)-STAT signaling to sustain survival and proliferation.5 JAK and IL7R mutations are frequent in several subtypes of pre-B-ALL, including the recently described disease Ph-like leukemia.6,7 In summary, mutations that both activate cytokine signaling and impair differentiation function as driver mutations in pre-B-ALL.
PU.1 (encoded by SPI1) and Spi-B (encoded SPIB in mice) are transcription factors of the E26-transformation-specific (ETS) family.8 PU.1 and Spi-B interact with an overlapping set of DNA binding sites in the genome to complement one another’s function and activate multiple genes involved in B-cell receptor signaling.9-12 Lack of these factors in developing B cells results in a block to B development at the small pre-B-cell stage associated with impaired Ig light chain rearrangement.11,13 Conditional deletion of Spi-B and PU.1 in developing B cells leads to high incidence of B-ALL in mice, but the mechanisms of leukemogenesis in the absence of these transcription factors are still undetermined.14
B-cell neoplasms, similar to all cancers, are thought to be diseases in which there is clonal evolution from a common precursor, in which acquired gene mutations drive an evolutionary natural selection process.15,16 The mechanisms by which cancer-initiating cells respond to selection pressures during clonal evolution have been classified into a number of common hallmarks.17 In response to selection pressure, the genetic makeup of cancer-initiating cells changes during the course of disease because of acquired mutations that can be classified as drivers or passengers.15,18 Driver mutations provide a growth advantage to a cancer clone, whereas passenger mutations do not provide a growth advantage. Pediatric B-ALL is less curable on relapse because of clonal evolution of the leukemia, resulting in driver mutations inducing a more aggressive disease.19 High levels of intratumoral heterogeneity of mutations is a poor prognostic marker for leukemia.20 Whole-exome sequencing (WES) or whole-genome sequencing of pre-B-ALL cases is expected to lead to a deeper understanding of the genetic causes of this disease, ultimately permitting molecular targeted therapy for individual patients.2
In this study, we investigated the molecular features of leukemogenesis in a model of B-ALL induced by deletion of genes encoding PU.1 and Spi-B. Mb1+/CreSpi1lox/loxSpib−/− mice, called here Mb1-CreΔPB mice, developed pre-B-ALL with a median time to euthanasia of 18 weeks. Using WES and RNA-seq, we identified single nucleotide variants (SNVs), most of which were predicted to have a role in the control of cell proliferation, communication, and metabolism. Strikingly, we identified recurrent SNVs in genes encoding Jak1, Jak3, and Aiolos in mouse leukemias. Further analysis revealed that SNVs located in Jak3 resulted in 3 different types of amino acid substitutions within the pseudokinase domain (R653H, V670A) and kinase domain (T844M). Introduction of Jak3 T844M into Spi1/Spib-deficient precursor B cells was sufficient to promote proliferation in response to low IL-7 concentrations in culture, as well as to promote proliferation and leukemia-like disease in transplanted mice. In summary, this study shows that Jak3 mutations are secondary drivers of leukemogenesis that cooperate with Spi1/Spib deletion. This mouse model may be useful to determine the effects of molecular targeted therapies on clonal evolution in B-ALL.
Materials and methods
Mice and breeding
Mb1-Cre mice were crossed with Spi1lox/loxSpib−/− to generate Mb1+/CreSpi1lox/loxSpib−/− mice (also referred to as Mb1-CreΔPB mice13 ). Mb1+/CreSpi1lox/loxSpib+/+ (referred to as Mb1-CreΔP) and Mb1+/CreSpi1+/+Spib−/− or Mb1+/+Spi1+/+Spib−/− (referred to as Mb1-CreΔB) mice were used as controls. C57BL/6 mice were purchased from Charles River Laboratories (Saint-Constant, QC, Canada). For transplantation experiments, nonobese diabetic/severe combined immunodeficiency/γc (NSG) mice were irradiated with 275 cGy 2 hours before receiving 5 × 10⁵ cells by tail vein injection. Transplanted mice were monitored daily for signs of illness. All experiments were performed on protocols approved by the Western University Council on Animal Care.
Cell culture
Pro-B-cell cultures were established from fetal liver of C57Bl/6 mice, as previously described.21 Pro-B cells were maintained in complete Iscove’s Modified Dulbecco’s Medium (Wisent Inc. St-Bruno, QC, Canada) supplemented with IL-7-conditioned medium produced from J558-IL-7 cells.22 Pro-B cells were maintained on a monolayer of ST2 stromal cells treated with 20 μg/mL mitomycin C (BioBasic Inc., Markham, ON, Canada). Spi1/Spib-deleted 660BM cells11 or freshly isolated bone marrow cells were cultured in complete Iscove’s Modified Dulbecco’s Medium containing 5% IL-7-conditioned medium.
Histology and microscopic analysis
Mb1-CreΔPB mice showing signs of disease were killed by CO2, and spleen and thymus were removed for histological analysis. Spleen and thymus removed from Mb1-CreΔB mice were used as control. Organs were fixed in 10% buffered formalin. Tissues were paraffin embedded, sectioned, and stained with hematoxylin and eosin. High-resolution micrographs were captured using a Q-Color3 digital camera (Olympus, Markham, ON, Canada).
Flow cytometry
Single-cell suspensions were prepared from enlarged spleen and thymus from Mb1-CreΔPB mice. Red blood cells were removed using hypotonic lysis. Flow cytometric analysis was performed using a FACSCanto or LSRII instrument (BD Immunocytometry Systems, San Jose, CA). Antibodies were purchased from eBioscience (San Diego, CA), BioLegend (San Diego, CA), or BD Biosciences (Mississauga, ON, Canada), and included PE-anti-CD19 (1D3), FITC-anti-BP-1 (6C3), APC-anti-immunoglobulin M (IgM; II/ 41), PE-anti-Igκ (187.1), FITC-anti-IL-7Rα (A7R34), BV421-anti-B220 (RA3-6B2), and PE-anti-BP-1 (6C3). Data were analyzed using FlowJo 9.1 software (Tree Star, Ashland, OR).
DNA and RNA sequencing
Genomic DNA was prepared from matched tumor and tail samples, using the Wizard Genomic DNA Purification Kit (Promega Corporation, Madison, WI). RNA was prepared from tumor cells, using the RNeasy Kit (Qiagen, Toronto, ON, Canada). WES and RNA sequencing were performed by McGill University and Génome Québec Innovation Centre (Montreal, QC, Canada). Sanger sequencing was performed on cDNA prepared from tumor cell RNA, using the iScript kit (Bio-Rad, Hercules, CA). Polymerase chain reaction products were purified using the QIAquick Gel Extraction Kit (Qiagen) and sequenced at the London Regional Genomics Centre, Western University (London, ON, Canada). Detailed methods and primer sequences are described in supplemental Materials and methods.
DNA constructs and site-directed mutagenesis
The mouse murine stem cell virus, internal ribosomal entry site, green fluorescent protein, Janus kinase 3 (MSCV-IRES-GFP-JAK3) plasmid was kindly provided by Kevin D. Bunting. T844M, R653H, and V670A mutations were generated by site-directed mutagenesis, using Q5 Site-Directed Mutagenesis Kit (New England BioLabs, Ipswich, MA). Site-directed mutagenesis primers for each 1 of the specific mutations were designed using NEBaseChanger tool. Mutations were confirmed by Sanger Sequencing before retroviral production and spin-infection.
Retroviral production and infection
Retroviral supernatants for wild-type Jak3 and T844M, R653H, and V670A mutants were generated with Platinum-E retroviral packaging cells,23 using PEIPro transfection reagent (PolyPlus, New York, NY). Virus-containing supernatant was collected 48 hours after a medium change. Wild-type pro-B cells were infected by spinoculation at 3000g for 2 hours at 30°C, with 1 mL viral supernatant containing polybrene at the concentration of 10 μg/mL. Wild-type and Jak3 mutant-infected pro-B cell lines used in this study were cultured in Iscove’s Modified Dulbecco’s Medium (Wisent, QC, Canada) containing 10% fetal bovine serum (Wisent), 1× penicillin/streptomycin/l-glutamine (Lonza, Shawinigan, QC, Canada), and 5 × 10⁻⁵ M β-mercaptoethanol (Sigma-Aldrich, St. Louis, MO). Media also contained 5% or 0.5% conditioned medium from the IL-7-producing cell line J558-IL-7.24 Cell lines were maintained in 5% CO2 atmosphere at 37°C. Infection frequency was determined using flow cytometric analysis for GFP.
Availability of data
WES data are available from the Sequence Read Archive, accession numbers SRX3850714 to SRX3850719. RNA-seq data are available from the Gene Expression Omnibus, accession number GSE112506.
Statistical analysis
All data reported in this study were graphed as mean ± SEM. Statistical analysis was performed using Prism 5.0 (GraphPad Software, La Jolla, CA), using statistical tests indicated in the figure legends.
Results
Deletion of genes encoding PU.1 and Spi-B leads to B-ALL
We recently reported that deletion of the genes encoding both PU.1 and Spi-B in B cells under control of the Cd79a (Mb1) promoter (Mb1+/CreSpi1lox/loxSpib−/− mice, abbreviated to Mb1-CreΔPB) resulted in a severe impairment to B-cell development at the large pre-B-cell to small pre-B-cell transition in the bone marrow of 6- to 10-week-old mice.13 Mb1-CreΔB mice that express Cre recombinase and are deleted for Spi-B but are wild type for Spi1 were fertile and healthy. In contrast, Mb1-CreΔPB mice had a median survival of 18 weeks, at which point they required euthanasia because of signs of illness, including lethargy and labored breathing (Figure 1A-B). Dissection of killed mice revealed enlargement of the spleen and thymus (Figure 1A,C-D). Histological analysis revealed that normal spleen and thymus organization was completely effaced in moribund Mb1-CreΔPB mice compared with the controls (Figure 1E).
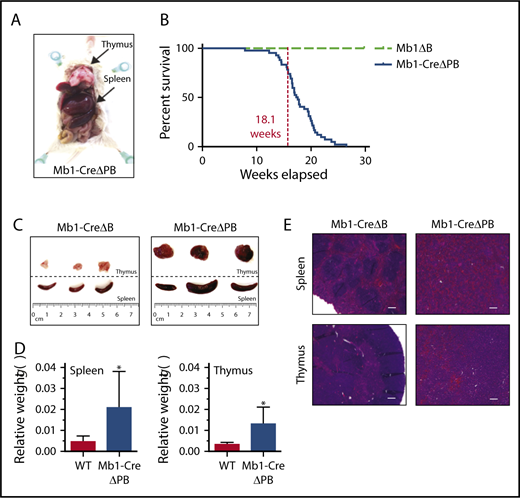
Mb1-CreΔPB mice develop B-ALL. (A) Mb1-CreΔPB mice (ΔPB) mice developed B-ALL characterized by splenic and thymic enlargement (indicated by arrows). (B) Percentage survival of mice of the indicated genotypes: Mb1+/CreSpi1lox/loxSpib−/− (Mb1-CreΔPB; n = 43); Mb1+/CreSpi1+/+Spib−/− mice (Mb1-CreΔB; n = 36) and Mb1+/+Spi1lox/loxSpib−/− (Mb1-CreΔB; n = 14). (C) Comparisons of enlarged spleens and thymuses extracted from Mb1-CreΔPB mice compared with control ΔB mice (Mb1+/+Spi1lox/loxSpib−/−). (D) Spleen (left) and thymus (right) weight in grams relative to the body weight in WT and Mb1-CreΔPB mice. WT, n = 10 (spleen), 5 (thymus); Mb1-CreΔPB, n = 11 (spleen), 8 (thymus). Significance was determined using unpaired Student t test. *P ≤ .05. (E). Histologic sections (hematoxylin and eosin staining) of spleen and thymus illustrating the lymphocytic infiltration and loss of organs normal structure in Mb1-CreΔPB compared with controls Mb1ΔB (magnification ×4; scale bar represents 200 μm).
Mb1-CreΔPB mice develop B-ALL. (A) Mb1-CreΔPB mice (ΔPB) mice developed B-ALL characterized by splenic and thymic enlargement (indicated by arrows). (B) Percentage survival of mice of the indicated genotypes: Mb1+/CreSpi1lox/loxSpib−/− (Mb1-CreΔPB; n = 43); Mb1+/CreSpi1+/+Spib−/− mice (Mb1-CreΔB; n = 36) and Mb1+/+Spi1lox/loxSpib−/− (Mb1-CreΔB; n = 14). (C) Comparisons of enlarged spleens and thymuses extracted from Mb1-CreΔPB mice compared with control ΔB mice (Mb1+/+Spi1lox/loxSpib−/−). (D) Spleen (left) and thymus (right) weight in grams relative to the body weight in WT and Mb1-CreΔPB mice. WT, n = 10 (spleen), 5 (thymus); Mb1-CreΔPB, n = 11 (spleen), 8 (thymus). Significance was determined using unpaired Student t test. *P ≤ .05. (E). Histologic sections (hematoxylin and eosin staining) of spleen and thymus illustrating the lymphocytic infiltration and loss of organs normal structure in Mb1-CreΔPB compared with controls Mb1ΔB (magnification ×4; scale bar represents 200 μm).
Using flow cytometry, we determined the frequencies of B220+CD19+ cells in the spleen (Figure 2A) and thymus (Figure 2B) of preleukemic and leukemic mice. Starting at age 11 weeks, Mb1-CreΔPB mice, but not C57BL/6 or Mb1-CreΔB mice, had B220low CD19+ cells infiltrating the thymus. At the time of euthanasia of leukemic Mb1-CreΔPB mice aged >15 weeks, there were high frequencies of B220low CD19+ cells in both organs (Figure 2A-B). Further analysis seeking to determine the phenotype of cells infiltrating the spleen and thymus showed that B220low CD19+ cells in these organs expressed c-Kit, CD43, BP-1, and IL-7Rα (Figure 2D; data not shown). This analysis suggested that these leukemias were pre-B-ALL, similar to that previously reported in CD19-CreΔPB mice14 or mice deleted for genes encoding PU.1 and IRF4/8.25 Next, leukemic cells obtained from the spleen or thymus of moribund Mb1-CreΔPB mice were characterized to determine expression of cell surface IgM and Igκ. Gating strategy for IgM/Igκ expression status is shown in supplemental Figure 1A. Analysis of leukemias from Mb1-CreΔPB mice revealed that 74% of individual mouse leukemias did not express IgM or Igκ at the cell surface (Figure 2E, bottom; Figure 2F, left). Twenty-six percent of leukemias from Mb1-CreΔPB mouse spleen or thymus had cell surface expression of both IgM and Igκ (Figure 2E, top; Figure 2F, left). In contrast, analysis performed on CD19-CreΔPB mice showed that 78% of leukemias had IgM and Igκ on the cell surface (Figure 2F, right). Most leukemias isolated from Mb1-CreΔPB mice had IgH rearrangements, although fewer leukemias expressed IgM at the cell surface (Figure 2C). In summary, these results showed that leukemia cells began to appear in thymus and spleen of Mb1-CreΔPB mice at or after 11 weeks of age. All leukemias in Mb1-CreΔPB mice at 11 to 26 weeks of age expressed IL-7R, but most did not express Ig on their cell surface, suggesting that these cells resembled pro-B or large pre-B cells.
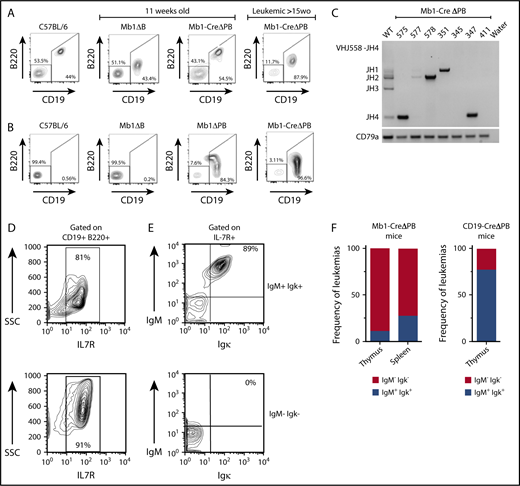
Most leukemias from Mb1-CreΔPB mice resemble pro-B cells and do not express either IgM or Igκ at the cell surface. (A) Representative flow cytometric analysis for the presence of CD19+ B220+ B cells in the spleen of C57BL/6 mice; 11-week-old Mb1-CreΔB mice and Mb1-CreΔPB mice (left panels); and >15-week-old Mb1-CreΔPB mice (right panel). (B) Representative flow cytometric analysis for the presence of CD19+ B220+ B cells in the thymus of C57BL/6 mice; 11-week-old Mb1-CreΔB mice, and Mb1-CreΔPB mice (left panels); and >15-week-old Mb1-CreΔPB mice (right panel). (C) Polymerase chain reaction for detection of heavy chain rearrangements (J558-JH4) in leukemia B cells prepared from the thymus of Mb1-CreΔPB mice. B cells prepared from WT mouse (C57BL/6) were used as control. The Cd79 gene was used as control for DNA quality. (D) Representative flow cytometric analysis of leukemic cells from Mb1-CreΔPB mice gated on CD19+ B220+ cells showed that leukemias expressed IL-7R on the cell surface (top and bottom). (E) Representative IL-7R+ leukemias expressing IgM and Igκ, (top, Ig+) and those not expressing IgM and Igκ (bottom, Ig−). (F) Percentage of leukemias expressing IgM and Igκ (Ig+) or not expressing IgM and Igκ (Ig−). (Left) Mb1-CreΔPB mice, n = 14 (spleen) and n = 8 (thymus). (Right) CD19-CreΔPB mice, n = 9 (thymus).
Most leukemias from Mb1-CreΔPB mice resemble pro-B cells and do not express either IgM or Igκ at the cell surface. (A) Representative flow cytometric analysis for the presence of CD19+ B220+ B cells in the spleen of C57BL/6 mice; 11-week-old Mb1-CreΔB mice and Mb1-CreΔPB mice (left panels); and >15-week-old Mb1-CreΔPB mice (right panel). (B) Representative flow cytometric analysis for the presence of CD19+ B220+ B cells in the thymus of C57BL/6 mice; 11-week-old Mb1-CreΔB mice, and Mb1-CreΔPB mice (left panels); and >15-week-old Mb1-CreΔPB mice (right panel). (C) Polymerase chain reaction for detection of heavy chain rearrangements (J558-JH4) in leukemia B cells prepared from the thymus of Mb1-CreΔPB mice. B cells prepared from WT mouse (C57BL/6) were used as control. The Cd79 gene was used as control for DNA quality. (D) Representative flow cytometric analysis of leukemic cells from Mb1-CreΔPB mice gated on CD19+ B220+ cells showed that leukemias expressed IL-7R on the cell surface (top and bottom). (E) Representative IL-7R+ leukemias expressing IgM and Igκ, (top, Ig+) and those not expressing IgM and Igκ (bottom, Ig−). (F) Percentage of leukemias expressing IgM and Igκ (Ig+) or not expressing IgM and Igκ (Ig−). (Left) Mb1-CreΔPB mice, n = 14 (spleen) and n = 8 (thymus). (Right) CD19-CreΔPB mice, n = 9 (thymus).
WES identifies somatic nucleotide variants in leukemias generated in the lack of Spi-B and PU.1
Mb1-CreΔPB mice had a variable time to requirement for euthanasia, as well as heterogeneity in Ig expression status of leukemias (Figures 1 and 2). This variability suggested that secondary driver mutations are required to induce leukemia, in addition to the initiating lesion of Spi1/Spib deletion. To discover potential driver mutations in Mb1-CreΔPB mice leukemias, we performed WES analysis of 3 mouse tumors, 853, 854, and 857, as well as of matched genomic tail DNA as a control (supplemental Figure 1B-D). SNVs for each 1 of the samples were identified by comparing leukemia and control tail DNA exome sequences, using the Strelka somatic variant caller.26 Sample 854 showed the highest number of SNVs (n = 3887; Figure 3A-C). Although the tumors had a variable number of SNVs, the distribution of the SNVs was similar across the genome, with SNV numbers correlating with chromosome length (supplemental Figure 2A-C). The majority of the nucleotide alterations in the 3 tumors analyzed were C•G → A•T transversions (supplemental Figure 2D). To gain insight into the nature of the mutational processes in Mb1-CreΔPB mice, we determined the mutational signature of leukemias, using DeconstructSigs.27 This package compares the similarity of each tumor sample to signatures generated by the analysis of 40 distinct types of human cancer.28 This analysis showed that the signatures in leukemias 853, 854, and 857 were most similar to COSMIC signatures 18, 24, 4, and 9 (supplemental Figure 3A-C). Signature 18, which showed the highest inferred weight for the 3 leukemia samples analyzed, has been commonly observed in human childhood cancers, including B-ALL and neuroblastoma, and is thought to be a consequence of 8-oxoguanine DNA damage.29,30 We also observed an enrichment of C→A transversions flanked at the 5′ base by adenine (A), cytosine (C), guanine (G), or thymine (T) nucleotides. These transversions were consistently flanked at the 3′ base by an adenine nucleotide (supplemental Figure 3D).
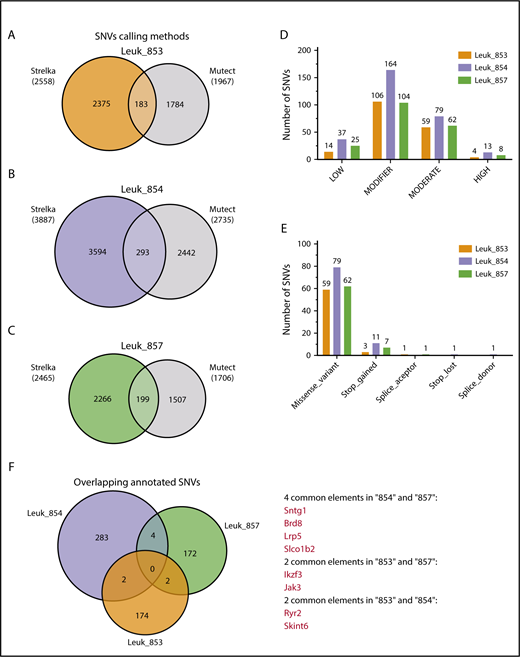
Identification of high-confidence SNVs in Mb1-CreΔPB mouse leukemias. (A-C) SNVs identified by 2 different variant caller methods, Strelka and Mutect, were combined, and overlapping SNVs were classified as high-confidence SNVs. (D) Classification of high-confidence SNVs for effect. Graph shows the number of SNVs classified according to effect. (E) Predicted biological effect of the high-confidence SNVs classified as having moderate and high effect. (F). Venn diagram showing the overlap among high-confidence SNVs identified in the 3 individual mouse leukemias.
Identification of high-confidence SNVs in Mb1-CreΔPB mouse leukemias. (A-C) SNVs identified by 2 different variant caller methods, Strelka and Mutect, were combined, and overlapping SNVs were classified as high-confidence SNVs. (D) Classification of high-confidence SNVs for effect. Graph shows the number of SNVs classified according to effect. (E) Predicted biological effect of the high-confidence SNVs classified as having moderate and high effect. (F). Venn diagram showing the overlap among high-confidence SNVs identified in the 3 individual mouse leukemias.
To increase the confidence in the SNVs identified by Strelka, and to reduce the number of SNVs without a potential biological function, somatic variants were called with a second variant discovery method, Mutect.31 Mutect detected fewer SNVs than Strelka (Figure 3A-C). The overlap of SNVs identified by both methods was used to determine high-confidence SNVs. We found that by using this strategy, the number of SNVs was reduced, resulting in 183 SNVs for sample 853, 293 SNVs for sample 854, and 199 SNVs for sample 857. High-confidence SNVs were annotated using the mouse genome (mm10), using the SnpEff tool, which also enables the prediction of the biological effect of the variants.32 We found that the majority of the high-confidence SNVs were classified as having a “modifier” or “moderate” deleterious effect, whereas a few SNVs were classified as “high” (Figure 3D). Most SNVs classified as “moderate” resulted in missense variants; the few SNVs predicted as having “high” effect caused the gain or loss of stop codons, or alterations in splice acceptor or donor sites, defined by the 2 bases before exon start or ends, respectively (Figure 3E). We next investigated whether there were common SNVs among the 3 mouse tumors sequenced. Samples 854 and 857 showed common SNVs in the genes Sntg1, Brd8, Lrp5, and Slco1b2 (Figure 3F). Samples 853 and 854 showed common SNVs in the genes Ryr2 and Skint6. Finally, samples 853 and 857 showed common SNVs in the genes Ikzf3 and Jak3 (Figure 3F). Interestingly, mutations of Ikzf3 and Jak3 have been shown to be drivers in human pre-B-ALL.33 The identification of common Ikzf3 and Jak3 SNVs suggests that this approach is effective at identifying potential driver mutations.
Recurrent mutations in Janus kinase 1 and 3 (Jak1/Jak3) and Aiolos (Ikzf3) genes are potential secondary drivers of leukemogenesis in Mb1-CreΔPB mice
As cancer driver genes would be expected to contain mutations and be expressed,18 we also performed RNA-seq analysis on leukemias 853, 854, and 857. Fragments per kilobase of transcript per million mapped reads (FPKM) was determined from RNA-seq data, using Cufflinks. FPKM was plotted against variant allele frequency (VAF), determined using Strelka for leukemias 853, 854, and 857. In each of the 3 samples, there were highly expressed genes that also had high VAF (Figure 4A-C). Importantly, sample 853 had high FPKM and VAF for variants in Jak3 and Ikzf3 (Figure 4A). Sample 854 had high FPKM and VAF for a variant in Jak1 (Figure 4B). Finally, sample 857 had high FPKM and VAF for variants in Jak3 and Ikzf3 (Figure 4C). The elevated expression levels added to the high VAF of Jak1, Jak3, and Ikzf3 genes in Mb1-CreΔPB mice leukemias supports the hypothesis that these variants represent secondary driver mutations.

Integration of WES and RNA-seq. (A-C) Scatter plot correlating the levels of gene expression in FPKM log10 and the VAF for genes in which FPKM was greater than zero. Leukemias 853, 854, and 857 are shown, respectively. (D-F). Biological pathway analysis in genes with VAF equal or greater than 20% was performed using Panther–Gene List Analysis. Diagram shows the number of genes enriched according the biological process. Enrichment for genes related to Cellular Process and Metabolic Process is shown for the 3 samples analyzed.
Integration of WES and RNA-seq. (A-C) Scatter plot correlating the levels of gene expression in FPKM log10 and the VAF for genes in which FPKM was greater than zero. Leukemias 853, 854, and 857 are shown, respectively. (D-F). Biological pathway analysis in genes with VAF equal or greater than 20% was performed using Panther–Gene List Analysis. Diagram shows the number of genes enriched according the biological process. Enrichment for genes related to Cellular Process and Metabolic Process is shown for the 3 samples analyzed.
Next, we sought to define the biological processes in which mutated genes could be involved by performing gene ontology analysis in genes with VAF greater than 20%, using PANTHER Gene List Analysis.34 We observed a pattern for all 3 samples, in which most of the genes were categorized in Cellular Process and Metabolic Process. Specifically, genes within Cellular Process were subcategorized in subprocesses such as cell communication, cell proliferation, and cell cycle (Figure 4D-F). Genes such as Cit, Cdk9, and Stag1 are related to the control of cell cycle by regulating cytokinesis, transcription, and cohesion of sister chromatids after DNA replication, respectively. Smarcb1 encodes a core subunit protein of the ATP-dependent SWI/SNF chromatin remodeling complex, and was previously identified as a tumor suppressor.35 Nap1l4 encodes a member of the nucleosome assembly protein and has a role as a histone chaperone. Genes involved in cell communication and adhesion as Cntnap5b, Fras1, Sdk1, and Magi were also enriched in our pathway analysis. In summary, Jak3 and Ikzf3 mutations were identified as potential drivers of leukemogenesis in Mb1-CreΔPB mice, based on the observation that these genes are mutated in 2 of 3 leukemias, have high VAF, and have high levels of expression.
Analysis of the effect of variants on protein expression showed that SNVs in leukemias 853 and 857 resulted in coding changes in Jak3 (R653H, V670A, and/or T844M), whereas the SNV in Jak1 in sample 854 resulted in a V657F substitution (Figure 5A-B). Comparison of Jak3 and Jak1 protein sequences among 6 different vertebrates showed that amino acids that underwent substitution in consequence of a SNV were highly conserved between these species (Figure 5A-B). Sanger sequencing of samples 853, 854, and 857 confirmed the presence of SNVs identified by WES in the Jak3, Jak1, and Ikzf3 genes (supplemental Figure 3). To determine whether these variants represent recurrent leukemia driver mutations, we performed Sanger sequencing for selected mutations on a total of 19 Mb1-CreΔPB leukemias. This examination revealed that Jak3 R653H mutation was detectable in 5/19 leukemias analyzed. Jak1 mutations V657F or V655L showed even higher recurrence than Jak3 mutation, being detectable in 10/19 leukemias (Figure 5D). Ikzf3 mutations were detected only in samples 853 and 857, confirming the exome sequencing (Figure 5C-D). In summary, these data show that leukemia in Mb1-CreΔPB mice is accompanied by recurrent secondary driver mutations in Jak1 and Jak3.
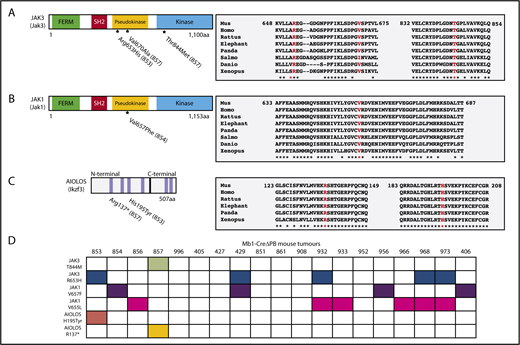
Identified mutations in conserved regions of Jak3, Jak1, and Ikzf3 genes. (A-C, left) Schematic shows the protein domains of Jak3, Jak1, and Aiolos (Ikzf3). Amino acids substitutions caused by single nucleotide variants identified in the WES in samples 853, 854, and 857 are also indicated. FERM indicates a Four-point-one, Ezrin, Radixin, Moesin homology domain. Blue bars represent zinc fingers of Aiolos protein. (A-C; right) Protein sequence alignments comparing Jak1, Jak3, and Aiolos in mouse (Mus musculus), human (Homo sapiens), rat (Rattus norvegicus), African elephant (Loxodonta africana), giant panda (Ailuropoda melanoleuca), Atlantic salmon (Salmo salar), zebrafish (Danio rerio), and tropical frog (Xenopus tropicalis) shows that amino acids that undergo substitution in consequence of a single nucleotide variation are highly conserved between the 2 species. Identical amino acids are marked with an asterisk. (D) Summary of Sanger sequencing screening for the presence of amino acids substitutions in Jak1 (V657F and V655L), Jak3 (T844M and R653H), and Aiolos (R137* and H195T) in a panel of 19 leukemias prepared from Mb1-CreΔPB mice. Filled boxes indicate samples in which mutations were identified by Sanger sequencing.
Identified mutations in conserved regions of Jak3, Jak1, and Ikzf3 genes. (A-C, left) Schematic shows the protein domains of Jak3, Jak1, and Aiolos (Ikzf3). Amino acids substitutions caused by single nucleotide variants identified in the WES in samples 853, 854, and 857 are also indicated. FERM indicates a Four-point-one, Ezrin, Radixin, Moesin homology domain. Blue bars represent zinc fingers of Aiolos protein. (A-C; right) Protein sequence alignments comparing Jak1, Jak3, and Aiolos in mouse (Mus musculus), human (Homo sapiens), rat (Rattus norvegicus), African elephant (Loxodonta africana), giant panda (Ailuropoda melanoleuca), Atlantic salmon (Salmo salar), zebrafish (Danio rerio), and tropical frog (Xenopus tropicalis) shows that amino acids that undergo substitution in consequence of a single nucleotide variation are highly conserved between the 2 species. Identical amino acids are marked with an asterisk. (D) Summary of Sanger sequencing screening for the presence of amino acids substitutions in Jak1 (V657F and V655L), Jak3 (T844M and R653H), and Aiolos (R137* and H195T) in a panel of 19 leukemias prepared from Mb1-CreΔPB mice. Filled boxes indicate samples in which mutations were identified by Sanger sequencing.
Jak3 mutations confer survival and proliferation advantages in culture and upon transplantation
Jak1 and Jak3 are critically required for signaling through cytokine receptors IL7R and CRLF2.36 We therefore tested whether R653H, V670A, and T844M amino acid substitutions in Jak3 were able to confer a proliferation advantage to pro-B cells cultured in IL-7. Site-directed mutagenesis was used to introduce these mutations to the wild-type mouse Jak3 coding region in an MSCV-IRES-GFP vector (a kind gift from Kevin D. Bunting). Pseudovirus was generated to spin-infect fetal liver-derived wild-type pro-B cells that grow in cultures containing IL-7 and ST2 stromal cells. Pro-B cells were also infected with MSCV Jak3 and a MSCV empty vectors as controls. After infection, the cell lines were cultured at a concentration of IL-7 sufficient to promote survival, but not proliferation (0.5% conditioned medium). Flow cytometry was performed every 2 days for 14 days to determine the frequency of GFP+ cells. Pro-B cells infected with Jak3 mutations R653H, V670A, or T844M out-competed uninfected or control infected pro-B cells at low IL-7 concentration (Figure 6A). Next, the number of GFP+ cells was determined after cells were kept in culture for 4 days. WT pro-B cells infected with Jak3 R653H, V670A, and T844M mutations showed increased proliferation compared with control cells after 4 days in culture (Figure 6B). Therefore, we conclude that R653H, V670A, and T844M amino acids substitutions were able to increase the proliferation of pro-B cells in conditions of low IL-7.
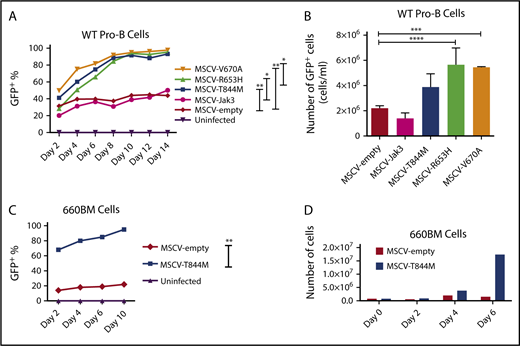
Jak3 mutations confer proliferation advantage to cultured pro-B cells. (A) Percentage of GFP+ cells over the course of 14 days after infection of WT fetal liver-derived pro-B cells with MSCV empty, MSCV JAK3, MSCV T844M, MSCV R653H, MSCV V670A, or MSCV V670A/T844M cultured at low IL-7 concentration (0.5% conditioned medium). Statistics were performed using repeated measures analysis of variance (ANOVA), *P ≤ .05; **P ≤ .01. (B) Absolute number of viable GFP+ cells after 4 days of culture at low IL-7 concentration. WT pro-B cells were infected as described earlier, counted, and analyzed for GFP frequency between day 8 and day 12 of culture. Data are presented as number of GFP+ cells/mL; n = 3. Statistics were performed using ANOVA with Tukey's posttest: ***P ≤ .001; ****P ≤ .0001. (C) Percentage of GFP+ cells over the course of 14 days after infection of the Spi1/Spib-deficient 660BM cell line with MSCV empty or MSCV T844M at low IL-7 concentration. Statistics were performed using repeated measures ANOVA: **P ≤ .01. (D) Absolute number of viable GFP+ cells over 6 days of culture shown in panel C. Spi1/Spib-deficient 660BM pro-B cells were infected with either MSCV empty or MSCV T844M vectors.
Jak3 mutations confer proliferation advantage to cultured pro-B cells. (A) Percentage of GFP+ cells over the course of 14 days after infection of WT fetal liver-derived pro-B cells with MSCV empty, MSCV JAK3, MSCV T844M, MSCV R653H, MSCV V670A, or MSCV V670A/T844M cultured at low IL-7 concentration (0.5% conditioned medium). Statistics were performed using repeated measures analysis of variance (ANOVA), *P ≤ .05; **P ≤ .01. (B) Absolute number of viable GFP+ cells after 4 days of culture at low IL-7 concentration. WT pro-B cells were infected as described earlier, counted, and analyzed for GFP frequency between day 8 and day 12 of culture. Data are presented as number of GFP+ cells/mL; n = 3. Statistics were performed using ANOVA with Tukey's posttest: ***P ≤ .001; ****P ≤ .0001. (C) Percentage of GFP+ cells over the course of 14 days after infection of the Spi1/Spib-deficient 660BM cell line with MSCV empty or MSCV T844M at low IL-7 concentration. Statistics were performed using repeated measures ANOVA: **P ≤ .01. (D) Absolute number of viable GFP+ cells over 6 days of culture shown in panel C. Spi1/Spib-deficient 660BM pro-B cells were infected with either MSCV empty or MSCV T844M vectors.
Jak3 T844 mutation has been previously noted in mouse models of leukemia, but has not been extensively studied compared with R63H and V670A.37,38 Therefore, we tested whether Jak3 T844M could provide a further proliferation advantage to Spi1/Spib mutant pro-B cells. First, we infected a pro-B cell line, 660BM, in which Spi1 and Spib genes are fully deleted.11 We found that infection with Jak3 T844M provided a proliferation advantage to infected 660BM cells compared with infection with control retroviral vector (Figure 6C-D). Next, we set out to determine whether Jak3 T844M could cooperate with deficiency in PU.1 and Spi-B to cooperatively promote survival and/or proliferation. Bone marrow cells were placed in culture with high IL-7 concentration (5% conditioned medium), conditions that promote survival and proliferation of precursor B cells,22 and then passaged with cell counting. Bone marrow cells from Mb1-CreΔPB mice were able to proliferate indefinitely in the presence of IL-7, whereas bone marrow cells from either WT or Mb1-CreΔB mice did not proliferate further than the third cell passage (Figure 7A). This result suggests that PU.1/Spi-B-deficient pro-B or pre-B cells have an enhanced ability to proliferate in response to IL-7 compared with WT or Spi-B-deficient cells. To determine whether the T844M mutation in the Jak3 gene could provide an additional growth advantage to PU.1/Spi-B-deficient cells, bone marrow cells from Mb1-CreΔPB mice cultured for 6 days in 5% IL-7-conditioned medium were infected with either MIGR1 (MSCV empty) or MIG T844M retroviral vectors (Figure 7B). After spin-infection, flow cytometric analysis was performed at 48 hours to determine the frequency of GFP+ cells in each condition (Figure 7C, left panel). The initial percentage of GFP+ cells was 36.7% for cells infected with MSCV empty virus and 79.6% for cells infected with MSCV T844M (Figure 7C, middle and right panels). Infected bone marrow cells were kept in culture for an additional 3 days in IL-7-conditioned media before being transplanted into NSG mice (Figure 7B). A group of 6 irradiated NSG mice were transplanted intravenously with cells infected with MSCV empty virus, whereas 6 mice received cells infected with MSCV T844M virus. After transplantation, the health status of the transplanted mice was monitored daily for signals of illness. Four of 6 mice transplanted with MSCV T844M showed signs of illness at days 41, 42, and 46 after transplantation, and were killed for analysis (Figure 7D). Mice that received bone marrow cells infected with MSCV empty virus did not show signs of illness at any time.

Jak3 mutations cooperate with Spi1/Spib-deficiency to confer proliferation advantage to B cells in vivo. (A) Mb1-CreΔPB bone marrow cells grow indefinitely in the presence of IL-7. Bone marrow cells were extracted from 6- to 10-week-old WT, ΔB, and ΔPB mice and cultured in IL-7 conditioned media. The number of viable cells/mL (y-axis) was determined every 4 days for 5 passages. Statistics were performed using 2-way ANOVA with Tukey's posttest: **P ≤ .01; ***P ≤ .001; ****P ≤ .0001. (B) Transplantation experiment timeline. (C) Initial infection frequencies for MSCV-empty or MSCV T844M vectors. Histograms show the frequency of GFP+ cells 48 hours after spin-infection. (D) Survival curve showing days elapsed after transplantation and the percentage of survival of NSG mice transplanted with MSCV empty or MSCV T844M-infected BM cells. Mice transplanted with MSCV empty BM cells did not show signs of illness at any point. The experiment was terminated at day 47. Significance was P ≤ .03, using the Gehan-Breslow-Wilcoxon test. (E) Number of cells isolated from bone marrow of NSG mice transplanted with bone marrow cells infected with the indicated vectors. (F) Number of cells isolated from spleen of NSG mice transplanted with bone marrow cells infected with the indicated vectors. (G-H) Increased frequencies of CD19+ cells in BM and spleen of NSG mice transplanted with MSCV T844M-infected BM cells. Bar graphs show the percentage of CD19+ cells in the bone marrow and spleen of NSG mice transplanted with MSCV empty or MSCV T844M BM cells. Representative pseudo-color plots (right) show the gating strategy and the representative proportions of CD19+ cells in the different group of mice. (I-J) High GFP+ cell frequency in BM and spleen of NSG mice transplanted with MSCV T844M-infected bone marrow cells. Bar graphs indicate the percentage of GFP+ cells (gated on CD19+ cells) within the bone marrow or spleen of NSG mice transplanted with MSCV empty or MSCV T844M. Representative histograms show the percentage of GFP+ cells in the spleen and bone marrow of NSG mice transplanted with MSCV T884M (upper) or MSCV empty (lower). For E-J, significance was determined using unpaired Student t test: *P ≤ .05; ***P ≤ .001. NS, not significant.
Jak3 mutations cooperate with Spi1/Spib-deficiency to confer proliferation advantage to B cells in vivo. (A) Mb1-CreΔPB bone marrow cells grow indefinitely in the presence of IL-7. Bone marrow cells were extracted from 6- to 10-week-old WT, ΔB, and ΔPB mice and cultured in IL-7 conditioned media. The number of viable cells/mL (y-axis) was determined every 4 days for 5 passages. Statistics were performed using 2-way ANOVA with Tukey's posttest: **P ≤ .01; ***P ≤ .001; ****P ≤ .0001. (B) Transplantation experiment timeline. (C) Initial infection frequencies for MSCV-empty or MSCV T844M vectors. Histograms show the frequency of GFP+ cells 48 hours after spin-infection. (D) Survival curve showing days elapsed after transplantation and the percentage of survival of NSG mice transplanted with MSCV empty or MSCV T844M-infected BM cells. Mice transplanted with MSCV empty BM cells did not show signs of illness at any point. The experiment was terminated at day 47. Significance was P ≤ .03, using the Gehan-Breslow-Wilcoxon test. (E) Number of cells isolated from bone marrow of NSG mice transplanted with bone marrow cells infected with the indicated vectors. (F) Number of cells isolated from spleen of NSG mice transplanted with bone marrow cells infected with the indicated vectors. (G-H) Increased frequencies of CD19+ cells in BM and spleen of NSG mice transplanted with MSCV T844M-infected BM cells. Bar graphs show the percentage of CD19+ cells in the bone marrow and spleen of NSG mice transplanted with MSCV empty or MSCV T844M BM cells. Representative pseudo-color plots (right) show the gating strategy and the representative proportions of CD19+ cells in the different group of mice. (I-J) High GFP+ cell frequency in BM and spleen of NSG mice transplanted with MSCV T844M-infected bone marrow cells. Bar graphs indicate the percentage of GFP+ cells (gated on CD19+ cells) within the bone marrow or spleen of NSG mice transplanted with MSCV empty or MSCV T844M. Representative histograms show the percentage of GFP+ cells in the spleen and bone marrow of NSG mice transplanted with MSCV T884M (upper) or MSCV empty (lower). For E-J, significance was determined using unpaired Student t test: *P ≤ .05; ***P ≤ .001. NS, not significant.
Finally, engraftment of donor cells was determined using cell counting and flow cytometric analysis. Mice transplanted with bone marrow cells containing the Jak3 T844M mutation showed 3 times higher cellularity than control mice in the bone marrow (Figure 7E). The spleen cellularity was slightly increased in mice transplanted with MSCV T844M cells (Figure 7F). The frequency of CD19+ cells within the spleen and bone marrow of mice transplanted with MSCV T844M cells was, on average, 90%, whereas mice that received MSCV empty cells showed less than 40% CD19+ cells in these locations (Figures 7G-H). Ninety-nine percent of CD19+ cells in the spleen and bone marrow of mice transplanted with MSCV T844M were also GFP+ (Figures 7I-J). Taking into account that the initial percentage of GFP+ cells 3 days before transplantation was 79.8% (Figure 7C), our data indicate that MSCV T844M-infected cells were able to proliferate more than uninfected cells in vivo. In contrast, only ∼20% of GFP+ cells were present in the spleen and bone marrow of mice transplanted with MSCV empty cells (Figure 7C), demonstrating that MSCV empty did not provide a proliferation advantage. Taken together, these results demonstrate that Spi1/Spib deletion cooperates with Jak3 T844M mutation to drive proliferation and leukemia-like disease in vivo.
Discussion
In this study, we showed that Mb1-CreΔPB mice develop precursor B-ALL that is detectable in mice by 11 weeks of age and results in a requirement for euthanasia in 100% of mice by median 18 weeks. The latency of 11 to 18 weeks, and the variable frequency of leukemias expressing Ig, show that there is clonal variability, suggesting that secondary driver mutations are required for disease progression. By characterizing the mutation landscape of Mb1-CreΔPB leukemias using WES coupled with RNA-seq, we discovered that mutations in Jak1 and Jak3 represent recurrent secondary driver mutations. Introduction of mutant Jak3 into Spi1/Spib-deficient precursor B cells was sufficient to promote proliferation in response to low IL-7 concentration in culture, and to promote proliferation and leukemia-like disease in transplanted mice. Taken together, these results show that deletion of genes encoding PU.1 and Spi-B result in leukemia associated with additional driver mutations in genes encoding Janus kinases.
Dysregulation of PU.1 and/or Spi-B expression are known to be involved in human leukemia, and these proteins have been established as tumor suppressors in mouse models.14,25 Minimal reductions in PU.1 expression are sufficient to induce a preleukemic condition in hematopoietic stem cells.39 WES and whole-genome sequencing studies have revealed that inactivating mutations in genes encoding PU.1 and Spi-B are detectable (although infrequent) in human leukemia.40,41 In contrast, PU.1 levels are frequently repressed by protein products of FLT3 internal tandem duplication42 or RUNX1-ETO fusion.43 Spi-B levels are frequently repressed by ETV6-RUNX1.25 It is not known how reduced PU.1 and/or Spi-B might lead to acquisition of secondary driver mutations. However, PU.1 and Spi-B are involved in attenuating IL-7R signaling in developing pro- and pre-B cells, as shown in Figure 7A. Target genes of PU.1 and Spi-B involved in regulating IL-7-induced proliferation include Btk encoding the tumor suppressor Bruton tyrosine kinase,11 and Blnk encoding B cell linker protein.44 Btk and Blnk work together to attenuate IL-7R signaling in developing B cells.45 On the basis of the mutational signature analysis, we speculate that mutagenesis in Mb1-Cre-ΔPB is associated with genomic instability as a result of 8-oxoguanine DNA damage. Interestingly, a similar disease is induced by combined deletion of PU.1 and IRF4, suggesting a common axis of gene regulation by PU.1/Spi-B and PU.1/IRF4.25
We identified a number of SNVs in our analysis, which suggest that several rounds of mutational events contributed to leukemogenesis. We focused our attention on genes that were highly expressed and had high VAFs, reasoning that such genes are likely to have originated early during leukemia progression. This analysis identified Aiolos (Ikzf3), Jak1 (Jak1), and Jak3 (Jak3) as potential secondary driver mutations. These genes are involved in signaling downstream of cytokine receptors during B-cell development. Cytokine receptor genes are commonly mutated in human B-ALLs,30 and mutations in Jak3 and Ikzf3 have recently emerged as novel mutated genes in high-risk B-ALL.46
Jak1 missense mutations V655L or V657F were detectable in 10 of 19 leukemias in our analysis. Jak1 V657F corresponds to a human JAK1 mutation that is a frequent driver in human B-ALL (V658F).47 Interestingly, JAK1 V658F mutation has been previously observed in T-cell acute lymphoblastic and acute myeloid leukemias.48 V658F is also thought to be paralogous to the JAK2 V617F mutation that functions as a driver in more than 95% of cases of polycythemia vera.49 In summary, the mutations identified in this study in Jak1 are relevant to human leukemia.
Our analysis identified R653H, V670A, and T844M mutations in Jak3. Human equivalents of Jak3 R653H and V670A have been described in human ALL (R657Q, V674F), and furthermore have been shown to function by activation of proliferation in response to interleukin-7.50 Human JAK3 V674F is sufficient to induce T-cell acute lymphoblastic leukemia when retrovirally delivered to hematopoietic precursors.50 Jak3 T844 mutations were previously observed in mouse models of B-ALL.37,38 However, mutations in JAK3 T848, the human equivalent to murine JAK3 T844, have not been reported. For this reason, we chose to investigate the function of Jak3 T844M further and found that it was a potent driver of proliferation and leukemia-like disease on infection and transplantation of Spi1/Spib mutant bone marrow cells. It will be of interest to determine the precise mechanism of how T844M confers gain of function to Jak3.
Taken together, this study confirms that leukemia in Mb1-CreΔPB mice is accompanied by recurrent secondary driver mutations in the Janus kinase signaling pathway. Mutations in the JAK signaling pathway are recurrent in human leukemia including the recently discovered Ph-like classification that represents a high priority for discovering new therapies.6,7 To study the genetic clonal evolution that underlies diseases such as Ph-like leukemia, there is still a need for mouse models. To advance understanding, mouse models should develop leukemias with high penetrance and reproducibility, replicate the genetic and molecular heterogeneity of tumors, involve de novo mutations, occur in immune competent mice, and mimic the clinical behavior of human disease.51,52 The Mb1-CreΔPB mouse model develops B-ALL with 100% penetrance by 18 weeks of age that is driven by heterogeneous de novo driver mutations. This mouse model may be useful to determine the effects of molecular targeted therapies on clonal evolution in B-ALL.
The full-text version of this article contains a data supplement.
Acknowledgments
The authors thank Michelle Ho for assistance with genotyping of mice. The authors thank Michael Reth (Freiburg, Germany) for providing Mb1-Cre mice. The authors thank Kevin D. Bunting (Winship Cancer Institute, Atlanta, GA) for providing the MSCV-IRES-GFP-JAK3 vector. The authors also thank scientists and staff of McGill University and Genome Quebec Innovation Centre for performing library construction and next-generation sequencing. The authors also thank Kristin Chadwick and the London Regional Flow Cytometry Core Facility for assistance with flow cytometric analysis.
This work was supported by the Canadian Institutes of Health Research Grants MOP-10651 and MOP-137414 (R.P.D.), a grant from the Leukemia and Lymphoma Society of Canada (R.P.D.), and an Ontario Trillium Scholarship (C.R.B.)
Authorship
Contribution: C.R.B. performed experiments and wrote the manuscript; M.L., A.-S.L., F.A.-S., L.S.X., R.H., G.I.B., and D.A.H. performed experiments; and R.P.D. supervised the research and wrote the manuscript.
Conflict-of-interest disclosure: The authors declare no competing financial interests.
Correspondence: Rodney P. DeKoter, Department of Microbiology & Immunology, Schulich School of Medicine & Dentistry, Western University, London, ON N6A 5C1, Canada; e-mail: rdekoter@uwo.ca.

