

Key Points
HSC expansion is a result of reprograming of UCB-CD34+ cells accompanied by an altered transcriptome that is reminiscent of primary HSCs.
Mitochondrial network remodeling acts in concert with p53 activation to suppress ROS levels leading to effective human HSC expansion.

Abstract
The limited number of hematopoietic stem cells (HSCs) in umbilical cord blood (UCB) units restricts their use for stem cell transplantation. Ex vivo treatment of UCB-CD34+ cells with valproic acid (VPA) increases the number of transplantable HSCs. In this study, we demonstrate that HSC expansion is not merely a result of proliferation of the existing stem cells but, rather, a result of a rapid reprogramming of CD34+CD90− cells into CD34+CD90+ cells, which is accompanied by limited numbers of cell divisions. Beyond this phenotypic switch, the treated cells acquire and retain a transcriptomic and mitochondrial profile, reminiscent of primary HSCs. Single and bulk RNA-seq revealed a signature highly enriched for transcripts characteristic of primary HSCs. The acquisition of this HSC signature is linked to mitochondrial remodeling accompanied by a reduced activity and enhanced glycolytic potential. These events act in concert with a modest upregulation of p53 activity to limit the levels of reactive oxygen species (ROS). Inhibition of either glycolysis or p53 activity impairs HSC expansion. This study indicates that a complex interplay of events is required for effective ex vivo expansion of UCB-HSCs.
Introduction
Umbilical cord blood (UCB) units are used as an alternative source of hematopoietic stem cells (HSCs) for patients who require stem cell transplantation. The use of UCBs is restricted because of the limited number of HSCs within a single unit. Our group has developed a novel strategy to expand HSCs from UCB-CD34+ cells, using a combination of cytokines with the histone deacetylase inhibitor valproic acid (VPA). The expanded HSCs established multilineage hematopoiesis in primary and secondary immune-deficient recipient mice.1,2
Primary functional HSCs contain a unique transcriptome and metabolic profile. HSCs with long-term repopulating potential are mostly quiescent and rely on glycolysis for energy production.3-8 Upon differentiation, HSCs switch rapidly to mitochondrial oxidative phosphorylation (OXPHOS) associated with increased reactive oxygen species (ROS) levels.9-11 In fact, ROS levels can be used as a parameter with which to enrich for primitive HSCs.12,13 Although moderately elevated ROS levels prime HSCs to differentiate, higher ROS levels can lead to their senescence or cell death.12,14-18 The maintenance of low ROS levels through reduced mitochondrial activity and mass is a critical determinant of the HSC fate in both in vivo and in vitro settings.19-22 Indeed, exposure of HSCs to ex vivo cultures containing cytokines imposes an immediate stress accompanied by increased ROS and mitochondrial mass, which compromises the properties and functional identity of the primary HSCs.23,24
Our understanding of the role of mitochondria during cellular reprograming is based on studies of fibroblast reprograming into induced pluripotent stem cells (iPSCs). This reprograming is associated with the transition from a pattern of tubular and cristae-rich mitochondria to a pattern of spherical and immature, cristae-poor mitochondria indicative of bioenergetic remodeling.25-27 Metabolic rewiring during iPSC reprograming is linked to a concomitant decrease in mitochondrial mass and ATP generation.25,28 In contrast, the efficiency of iPSC reprograming is impaired by increased mitochondrial mass associated with high levels of p53.29,30 In HSCs, high p53 levels promote senescence and cell death in response to genotoxic stress.31,32 However, in response to mild oxidative stress, a moderate increase in p53 levels is required for HSCs to reduce ROS levels and retain their self-renewal capacity.33-39
In this study, we show that the ex vivo expansion of HSCs with VPA is a result of cellular reprograming of UCB-CD34+ cells and a limited number of cell divisions. Our evidence links the acquisition of an HSC phenotype and transcriptome to an altered primitive mitochondrial network with reduced oxidative phosphorylation and enhanced glycolytic potential, all of which characterize primary HSCs. Moreover, VPA activates the p53-MnSOD axis that acts in concert with the remodeled mitochondrial network to suppress ROS levels, favoring both the degree of HSC expansion and their engraftment potential.
Methods
Ex vivo culture
Isolated UCB-CD34+ cells were cultured with cytokines for 16 hours, and exposed to 1 mM VPA. Detailed protocols are provided in the supplemental Data.
Reverse transcription polymerase chain reaction
RNA was extracted using the QIAGEN RNeasy mini kit (QIAGEN). Gene expression levels were quantified by using the Power SYBR Green PCR Master Mix.
Single-cell and bulk RNA-seq
Mitochondrial DNA quantification
Genomic DNA was harvested and amplified from CD34+ cells. NovaQuant Human mitochondrial to nuclear DNA ratio kit was used to define the relative mtDNA:nDNA ratio.
Statistical analysis
Multilevel analysis for β models was used to analyze HSC percentage. Negative-binomial models were fitted for HSC numbers. Student t test and ANOVA using GraphPad Prism 7.0 software was used for the other analysis. P < .05 was considered significant.
Results
VPA treatment triggers a rapid acquisition of HSC phenotypic markers and a limited number of cell divisions
We have reported that the numbers of human UCB-HSCs were increased after priming UCB-CD34+ cells with cytokines for 16 hours, followed by the addition of VPA and incubation for an additional 7 days (supplemental Figure 1A).1 To gain insights into the cellular mechanisms leading to the ex vivo expansion of CD34+ cells with VPA, we monitored cell numbers and the expression of HSC phenotypic markers.8 Throughout the culture period, the number of total nucleated cells (TNCs) generated in cultures exposed to the combination of cytokines and VPA treatment (referred to hereafter as VPA) was less than that observed after exposure to cytokines alone (Figure 1A). The TNC numbers were especially low in VPA cultures during the first 4 days of incubation. The lower number of TNCs (Figure 1A) was not a result of apoptosis, loss of cell viability, or senescence (supplemental Figures 1B and 4G; data not shown). To closely track the behavior of CD34+ cells, we performed carboxyfluorescein diacetate succinimidyl ester (CFSE) staining analysis and monitored cell division history. CD34+ cells treated with VPA initially underwent fewer cell divisions than CD34+ cells cultured with cytokines alone (Figure 1B). During the first 4 days of culture, a high percentage of quiescent CD34+ cells (G0) was evident only in VPA cultures (Figure 1C). During more prolonged incubation with VPA, the percentage of quiescent cells and the intensity of CFSE fluorescence declined in VPA-containing cultures, indicating a greater number of cell divisions (Figure 1B-C). The first 4 days of expansion were accompanied by an elevation in the percentage of phenotypically defined HSCs (CD34+CD90+; Figure 1D; supplemental Figure 1C) and long-term HSCs (CD34+CD90+CD49f+; supplemental Figure 1D). In contrast, more prolonged treatment with VPA (days 5-7) was characterized by a gradual decline in the percentage of HSCs (Figure 1D; supplemental Figure 1D) that was inversely correlated with an increase in HSC numbers (Figure 1E; supplemental Figure 1E). The prompt increase in the percentage of HSCs was observed as early as 24 hours after incubation with VPA (Figure 1D; supplemental Figure 1D). This elevation was accompanied by a substantial increase in the number of phenotypically defined HSCs (∼63-fold within 24 hours of VPA treatment; Figure 1E; supplemental Figure 1E). Whereas the percentage of CD34+CD90+ cells increased, the percentage of CD34+CD90− cells declined within 24 to 48 hours of VPA treatment, indicating a phenotypic switch (supplemental Figure 1F). These findings raised the possibility that this phenotypic switch, rather than the limited numbers of cell divisions, might account for the rapid increase in HSC numbers. To test this possibility, we examined the HSC markers in cultures initiated with highly purified UCB-CD34+CD90− cells. Within 24 hours of incubation with VPA, 78% of CD34+CD90− cells acquired the CD34+CD90+ phenotype compared with 0% observed in cultures containing cytokines alone (Figure 1F). Moreover, cells retained the CD34+CD90+ phenotype during the first 4 days of incubation with VPA (Figure 1G). Collectively, these findings indicate that the high degree of HSC expansion during the first days of incubation with VPA is the result of a rapid acquisition of the HSC phenotype and limited numbers of cell divisions.
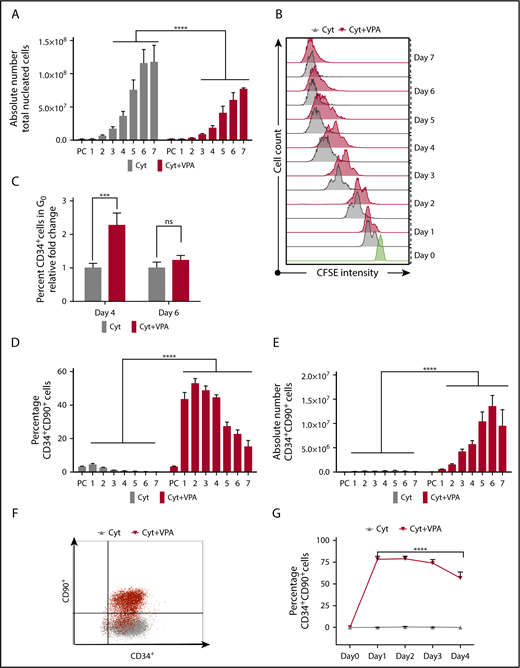
VPA induces a rapid acquisition of the HSC phenotypic markers. (A) The number of viable TNCs generated throughout 7 days of culture of UCB-CD34+ cells with either cytokines alone or a combination of VPA with cytokines, as measured by acridine orange/propidium iodide staining (n = 16). X-axis represents days of the culture, and PC denotes the uncultured UCB cells. (B) Cell division history of CD34+ cells incubated with cytokines alone (gray) or VPA (red), as determined by loss of CFSE fluorescence intensity. Green histogram represents the CFSE fluorescence intensity of the CD34+ cells before treatment with VPA. (C) Percentage of quiescent CD34+ cells (G0), as determined by pyronin and Hoescht staining (n = 8). (D-E) Percentage and absolute numbers of CD34+CD90+ cells generated throughout 7 days of culture with cytokines alone or VPA, as determined by flow cytometry (n = 21). (F) Representative of flow cytometry plots of CD34+CD90+ cells present in cultures initiated with highly purified CD34+CD90− cells after 24 hours of treatment with either cytokines alone (gray) or VPA (red) (n = 4). (G) Percentage of CD34+CD90+ cells generated from CD34+CD90− cells and determined by flow cytometry (n = 4). “n” is the number of biological replicates. Error bars with standard error of the mean. ****P ≤ .0001; ***P ≤ .001 were determined by negative-binomial models for panels A and E, β models for panel D, and 2-way ANOVA for panels C and G. ns, not significant.
VPA induces a rapid acquisition of the HSC phenotypic markers. (A) The number of viable TNCs generated throughout 7 days of culture of UCB-CD34+ cells with either cytokines alone or a combination of VPA with cytokines, as measured by acridine orange/propidium iodide staining (n = 16). X-axis represents days of the culture, and PC denotes the uncultured UCB cells. (B) Cell division history of CD34+ cells incubated with cytokines alone (gray) or VPA (red), as determined by loss of CFSE fluorescence intensity. Green histogram represents the CFSE fluorescence intensity of the CD34+ cells before treatment with VPA. (C) Percentage of quiescent CD34+ cells (G0), as determined by pyronin and Hoescht staining (n = 8). (D-E) Percentage and absolute numbers of CD34+CD90+ cells generated throughout 7 days of culture with cytokines alone or VPA, as determined by flow cytometry (n = 21). (F) Representative of flow cytometry plots of CD34+CD90+ cells present in cultures initiated with highly purified CD34+CD90− cells after 24 hours of treatment with either cytokines alone (gray) or VPA (red) (n = 4). (G) Percentage of CD34+CD90+ cells generated from CD34+CD90− cells and determined by flow cytometry (n = 4). “n” is the number of biological replicates. Error bars with standard error of the mean. ****P ≤ .0001; ***P ≤ .001 were determined by negative-binomial models for panels A and E, β models for panel D, and 2-way ANOVA for panels C and G. ns, not significant.
VPA treatment alters the transcriptional landscape of UCB-CD34+ cells
Given the role of VPA as an epigenetic modifier,1,41-43 we postulated that the rapid acquisition of an HSC phenotype is accompanied by an altered transcriptome. We performed single-cell transcriptome analysis (scRNA-seq)40 in uncultured CD34+ cells or CD34+ cells isolated from cultures treated for 2 days with VPA (Figure 2A). In comparison with uncultured CD34+ cells, VPA increased the percentage of cells with CD34 (1.7-fold), CD90 (59-fold), and CD49f (34-fold) transcripts, while reducing the percentage of cells with CD38 transcripts (3.2-fold; Figure 2A, table). Moreover, bulk RNA-seq analysis revealed that both CD90 and CD49f transcript levels were increased in the CD34+ cells expanded for 2 and 4 days with VPA compared with those treated with cytokines alone or with the uncultured CD34+ cells (Figure 2B-C). The global transcriptome of CD34+ cells expanded for 2 and 4 days with VPA was distinct from that of CD34+ cells treated with cytokines alone (Figure 2D; supplemental Figure 2A). Comparison of their gene expression profiles revealed that VPA treatment upregulated 188 and downregulated 51 genes with a Log2 FC>4. Significant upregulation was observed not only in genes that phenotypically mark long-term functional HSCs such as CD90, CD49f, CD143, CD133, and EPCR, but also genes that govern HSC quiescence, metabolism, and self-renewal capacity including Tie2, ALDH1, PBX1, HES1, MEIS1, GATA244-51 (supplemental Figure 2B). The increase in key regulators of HSC quiescence is correlated with reduced gene expression of CDKs, including CDK6, and the increased expression of CDK inhibitors, including p21 (supplemental Figure 2C). Thus, this transcriptional program regulated by VPA might underlie the delayed proliferation kinetics and increased quiescence of CD34+ cells observed during the first 4 days of expansion. Such correlation and transcriptional program has been reported to be essential for quiescence of functional UCB-HSCs.52-54 Set enrichment analysis revealed that the upregulated genes observed in VPA-expanded CD34+ cells were enriched for the set of genes that characterize both human and nonhuman primate primary HSCs55 (Figure 2E). Strikingly, VPA-expanded CD34+ cells were enriched for numerous other gene sets reported to be upregulated in HSCs and early progenitor cells, including the “Ivanova” long-term human HSC signature56 (Figure 2F; supplemental Figure 2D). Together, this evidence suggests that VPA alters the transcriptome of CD34+ cells, leading to the expansion of cells with gene expression profiles that resemble those of primary long-term HSCs.
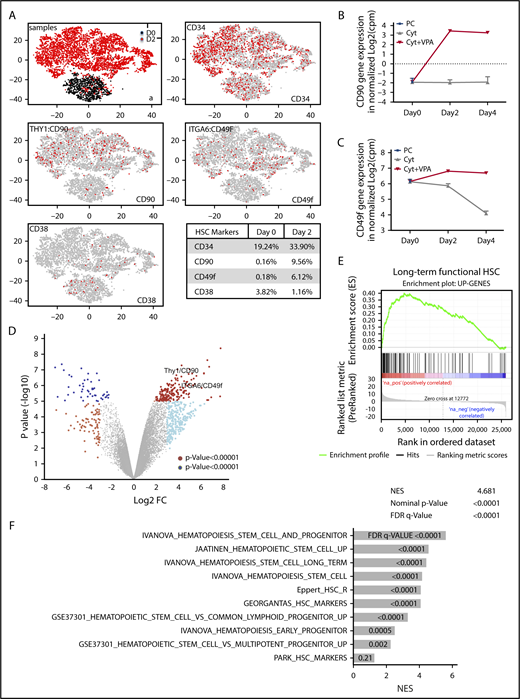
VPA alters the transcriptional landscape of UCB-CD34+cells. (A) GEM drop-seq analysis of uncultured single CD34+(D0) and CD34+ cells isolated from cultures incubated for 2 days with VPA (D2). Gene expression data were plotted in 2D, using nonlinear projection t-SNE. Subpanel a indicates distinct clusters of cells D0 (black) and D2 (red). The other subpanels indicate expression of CD34, CD90, CD49f, and CD38 genes in each single cell (gray: not expressed, red: expressed). (B-C) Bulk RNA-seq analysis indicates CD90 (B) and CD49f (C) gene expression in the uncultured (PC), UCB-CD34+ cells (black triangle) and in CD34+ cells isolated from cultures expanded with cytokines alone (gray) or VPA (red). (D) Volcano plot represents differential expressed genes analyzed by bulk RNA-seq in CD34+ cells isolated from cultures expanded for 4 days with VPA compared with CD34+ cells expanded with cytokines alone (n = 3). VPA treatment upregulated 188 and downregulated 51 genes (log2 fold change, >4, with an FDR < 0.05). (E-F) The upregulated genes shown in panel D were enriched for the gene set that are upregulated in primate HSCs (E) and for other upregulated genes sets in human and murine HSCs and HSPCs (F) analyzed by GSEA. “n” is the number of biological replicates. cpm, counts per million; FDR, false discovery rate; NES, normalized enrichment score.
VPA alters the transcriptional landscape of UCB-CD34+cells. (A) GEM drop-seq analysis of uncultured single CD34+(D0) and CD34+ cells isolated from cultures incubated for 2 days with VPA (D2). Gene expression data were plotted in 2D, using nonlinear projection t-SNE. Subpanel a indicates distinct clusters of cells D0 (black) and D2 (red). The other subpanels indicate expression of CD34, CD90, CD49f, and CD38 genes in each single cell (gray: not expressed, red: expressed). (B-C) Bulk RNA-seq analysis indicates CD90 (B) and CD49f (C) gene expression in the uncultured (PC), UCB-CD34+ cells (black triangle) and in CD34+ cells isolated from cultures expanded with cytokines alone (gray) or VPA (red). (D) Volcano plot represents differential expressed genes analyzed by bulk RNA-seq in CD34+ cells isolated from cultures expanded for 4 days with VPA compared with CD34+ cells expanded with cytokines alone (n = 3). VPA treatment upregulated 188 and downregulated 51 genes (log2 fold change, >4, with an FDR < 0.05). (E-F) The upregulated genes shown in panel D were enriched for the gene set that are upregulated in primate HSCs (E) and for other upregulated genes sets in human and murine HSCs and HSPCs (F) analyzed by GSEA. “n” is the number of biological replicates. cpm, counts per million; FDR, false discovery rate; NES, normalized enrichment score.
VPA treatment triggers remodeling of the mitochondrial network
Long-term HSCs are characterized by a primitive mitochondrial network and rely mainly on glycolysis for energy production.7,11,12 We therefore examined whether changes in mitochondrial profile accompany the transcriptomic alterations induced by VPA treatment. During the first 4 days of incubation, the subpopulations of CD34+, CD34+CD90−, and CD34+CD90+ cells were characterized by a lower mitochondrial mass, membrane potential, and superoxide anion production (ROS) than the corresponding subpopulations of cells cultured with cytokines alone (dotted line in Figure 3A). These mitochondrial alterations occurred rapidly and were observed after both short (2 days) and prolonged (6 days) periods of incubation with VPA (supplemental Figure 3A-B). To rule out any artifact caused by the efflux of MitoTracker Green dye, we inhibited dye efflux with verapamil.57 A significant reduction in the mitochondrial mass of CD34+ CD90+ cells was evident within the first 24 hours of VPA treatment (supplemental Figure 3C-D), suggesting that the alterations in mitochondrial mass occur simultaneously with the acquisition of the HSC phenotype. The primitive mitochondrial profile was most pronounced in the pool of CD34+CD90+ cells expanded with VPA. Within this pool, CD34highCD90high cells generated lower ROS levels and contained a lower mitochondrial mass than CD34lowCD90low cells, indicating a correlation between the HSC phenotype and mitochondrial profile (Figure 3B-C). Consistent with the reduced mitochondrial mass (Figure 3A), VPA-expanded CD34+ cells were characterized by a decreased mitochondrial DNA content (Figure 3D). Electron microscopic studies demonstrated that the cytoplasm of CD34+ cells treated with cytokines alone was filled with mitochondria (Figure 3E) that were tubular and contained well-defined cristae. In contrast, CD34+ cells expanded with VPA contained fewer mitochondria (Figure 3F), which were round with limited numbers of immature cristae, indicative of a primitive mitochondrial profile. The primitive mitochondrial phenotype observed in CD34+ cells was similar to that observed in the long-term HSCs expanded with VPA (supplemental Figure 3E). Confocal microscopy analysis revealed that CD34+ cells treated with cytokines alone and stained with either TOMM20 or Mitotracker exhibited an intact mitochondrial network distributed throughout the cytoplasm (Figure 3G). Conversely, VPA-treated CD34+ cells contained globular mitochondria that were distributed at their apices (Figure 3G). We also assessed mitochondrial OXPHOS activity. CD34+ cells expanded with VPA exhibited limited mitochondrial metabolism and activity, as indicated by reduced ATP levels and OCR activity (Figure 3H-I). They also had lower basal and maximal oxygen respiration levels compared with CD34+ cells cultured with cytokines alone (Figure 3I). In contrast, GSEA analysis revealed an enrichment of the genes involved in the glycolytic pathway in VPA-expanded CD34+ cells (Figure 3J). Moreover, these cells displayed a higher ECAR/OCR ratio compared with CD34+ cells treated with cytokines alone, suggesting an enhanced glycolytic potential (Figure 3K). Thus, VPA-expanded CD34+ cells rely more on glycolysis than on mitochondrial OXPHOS. Collectively, these data indicate that HSCs expanded with VPA exhibit a restructured primitive mitochondrial network accompanied by limited oxidative respiration and enhanced glycolytic potential, all of which resembles the characteristics of the primary HSCs.
![Figure 3. VPA treatment generates HSCs with a remodeled mitochondrial network. (A) Mitochondrial mass, membrane potential, and superoxide anion levels (ROS) in different subsets of CD34+ cells expanded for 4 days with VPA, as determined by staining with MitoTrackerGreen, tetramethylrhodaminemethyl ester, or MitoSOXRed. Bars represent the fold change of median fluorescence intensity (MFI) relative to the corresponding CD34+ subsets cultured with cytokines alone (dotted line) (n = 11). (B-C) Flow cytometer histograms indicating mitochondrial ROS levels (B) and mitochondrial mass (C) in CD34highCD90high (gray) and CD34lowCD90low cells (red) expanded for 4 days with VPA (n = 13). Similar numbers of CD34highCD90high and CD34lowCD90low cells were analyzed in panels B and C. Numbers in panel B represent the average fold change of ROS levels. (D) Mitochondrial to nuclear DNA ratio in the isolated CD34+ cells. Graphs represent the relative fold change of mtDNA/nDNA ratio of CD34+ cells treated with VPA normalized to that of CD34+ cell treated with cytokines alone within each experiment (n = 8). (E-F) Electromicrographs of CD34+ cells isolated after 4 days of expansion. Images were captured: (a) magnification ×1000; scale bar, 10 μm; (b) magnification ×2500; scale bar, 5 μm; (c) magnification ×10 000; scale bar, 1 μm. Numbers represent the average mitochondrial number per each cell (n = 16). (G) Confocal microscopic images of CD34+ cells isolated after 4 days of expansion and stained with 4′,6-diamidino-2-phenylindole (blue-nuclei) and MitoTrackerOrange (red; scale bar, 10 μm) or stained for mitochondrial membrane protein Tomm20 (green; scale bar, 7.5 μm). (H-I) Oxygen consumption rate (H), basal and maximal oxygen respiration and ATP production (I) measured by seahorse analyzer in CD34+ cells expanded for 4 days (n = 7). (J) Enrichment of glycolysis pathway analyzed by GSEA on the upregulated genes identified by the bulk RNA-seq in CD34+ cells cultured for 4 days with cytokines with VPA relative of CD34+ cells cultured with cytokines alone. (K) Fold change of the metabolic potential represented as glycolytic (extracellular acidification rate [ECAR]) to aerobic (oxygen consumption rate [OCR]) metabolism ratio of CD34+ cells expanded for 4 days with VPA relative to CD34+ cells treated with cytokines alone.39 Metabolic potential represents the percentage of stressed OCR and ECAR values measured on stimulation with oligomycin and carbonilcyanide p-triflouromethoxyphenylhydrazone (FCCP) over basal OCR and ECAR levels, respectively (n = 3). Experiments in H, I, and K were performed in triplicates, and values in I and K were normalized within each experiment. “n” is the number of biological replicates. Error bars with SEM, *P ≤ .05; **P ≤ .01; ***P ≤ .001; ****P ≤ .0001 were determined by 2-way ANOVA for panel A and unpaired Student t test for panels B, C, F, I, and K.](https://ash.silverchair-cdn.com/ash/content_public/journal/bloodadvances/2/20/10.1182_bloodadvances.2018024273/4/m_advances024273f3.png?Expires=1769127564&Signature=TG3ewgDqVhxpDh-JkGoiuXQQv9Cfu-ccmhXiKjJaYMQTF660Bt5xg-R-Qx0jSRioqvFGe6dCTiIeBDg~hleYbqrfgLM4BBRNhCn6Mf8lwn~6BS6Vi~0Gim5eoDgM3NVhsQJs8J~ltw6pghqgCvjAeYZZXzY8SrTmsZRHCj1wwnETos3ScKweFfwwaTkBZwm~3bwKEq5zvp8VO0iKusPfHYjO~PZmDX7oLJW5LohGdqMjoYObYDPZOBOdh3-6q37FmcnaibN10o2FXaZbWqke8nE7Mo6gmjOqL6UZO20he9~Dh8Z-7Y3H8KQiCCEuWYTsoD9yOFMB-5RDLOsZldggNg__&Key-Pair-Id=APKAIE5G5CRDK6RD3PGA)
VPA treatment generates HSCs with a remodeled mitochondrial network. (A) Mitochondrial mass, membrane potential, and superoxide anion levels (ROS) in different subsets of CD34+ cells expanded for 4 days with VPA, as determined by staining with MitoTrackerGreen, tetramethylrhodaminemethyl ester, or MitoSOXRed. Bars represent the fold change of median fluorescence intensity (MFI) relative to the corresponding CD34+ subsets cultured with cytokines alone (dotted line) (n = 11). (B-C) Flow cytometer histograms indicating mitochondrial ROS levels (B) and mitochondrial mass (C) in CD34highCD90high (gray) and CD34lowCD90low cells (red) expanded for 4 days with VPA (n = 13). Similar numbers of CD34highCD90high and CD34lowCD90low cells were analyzed in panels B and C. Numbers in panel B represent the average fold change of ROS levels. (D) Mitochondrial to nuclear DNA ratio in the isolated CD34+ cells. Graphs represent the relative fold change of mtDNA/nDNA ratio of CD34+ cells treated with VPA normalized to that of CD34+ cell treated with cytokines alone within each experiment (n = 8). (E-F) Electromicrographs of CD34+ cells isolated after 4 days of expansion. Images were captured: (a) magnification ×1000; scale bar, 10 μm; (b) magnification ×2500; scale bar, 5 μm; (c) magnification ×10 000; scale bar, 1 μm. Numbers represent the average mitochondrial number per each cell (n = 16). (G) Confocal microscopic images of CD34+ cells isolated after 4 days of expansion and stained with 4′,6-diamidino-2-phenylindole (blue-nuclei) and MitoTrackerOrange (red; scale bar, 10 μm) or stained for mitochondrial membrane protein Tomm20 (green; scale bar, 7.5 μm). (H-I) Oxygen consumption rate (H), basal and maximal oxygen respiration and ATP production (I) measured by seahorse analyzer in CD34+ cells expanded for 4 days (n = 7). (J) Enrichment of glycolysis pathway analyzed by GSEA on the upregulated genes identified by the bulk RNA-seq in CD34+ cells cultured for 4 days with cytokines with VPA relative of CD34+ cells cultured with cytokines alone. (K) Fold change of the metabolic potential represented as glycolytic (extracellular acidification rate [ECAR]) to aerobic (oxygen consumption rate [OCR]) metabolism ratio of CD34+ cells expanded for 4 days with VPA relative to CD34+ cells treated with cytokines alone.39 Metabolic potential represents the percentage of stressed OCR and ECAR values measured on stimulation with oligomycin and carbonilcyanide p-triflouromethoxyphenylhydrazone (FCCP) over basal OCR and ECAR levels, respectively (n = 3). Experiments in H, I, and K were performed in triplicates, and values in I and K were normalized within each experiment. “n” is the number of biological replicates. Error bars with SEM, *P ≤ .05; **P ≤ .01; ***P ≤ .001; ****P ≤ .0001 were determined by 2-way ANOVA for panel A and unpaired Student t test for panels B, C, F, I, and K.
VPA treatment generates HSCs with a remodeled mitochondrial network. (A) Mitochondrial mass, membrane potential, and superoxide anion levels (ROS) in different subsets of CD34+ cells expanded for 4 days with VPA, as determined by staining with MitoTrackerGreen, tetramethylrhodaminemethyl ester, or MitoSOXRed. Bars represent the fold change of median fluorescence intensity (MFI) relative to the corresponding CD34+ subsets cultured with cytokines alone (dotted line) (n = 11). (B-C) Flow cytometer histograms indicating mitochondrial ROS levels (B) and mitochondrial mass (C) in CD34highCD90high (gray) and CD34lowCD90low cells (red) expanded for 4 days with VPA (n = 13). Similar numbers of CD34highCD90high and CD34lowCD90low cells were analyzed in panels B and C. Numbers in panel B represent the average fold change of ROS levels. (D) Mitochondrial to nuclear DNA ratio in the isolated CD34+ cells. Graphs represent the relative fold change of mtDNA/nDNA ratio of CD34+ cells treated with VPA normalized to that of CD34+ cell treated with cytokines alone within each experiment (n = 8). (E-F) Electromicrographs of CD34+ cells isolated after 4 days of expansion. Images were captured: (a) magnification ×1000; scale bar, 10 μm; (b) magnification ×2500; scale bar, 5 μm; (c) magnification ×10 000; scale bar, 1 μm. Numbers represent the average mitochondrial number per each cell (n = 16). (G) Confocal microscopic images of CD34+ cells isolated after 4 days of expansion and stained with 4′,6-diamidino-2-phenylindole (blue-nuclei) and MitoTrackerOrange (red; scale bar, 10 μm) or stained for mitochondrial membrane protein Tomm20 (green; scale bar, 7.5 μm). (H-I) Oxygen consumption rate (H), basal and maximal oxygen respiration and ATP production (I) measured by seahorse analyzer in CD34+ cells expanded for 4 days (n = 7). (J) Enrichment of glycolysis pathway analyzed by GSEA on the upregulated genes identified by the bulk RNA-seq in CD34+ cells cultured for 4 days with cytokines with VPA relative of CD34+ cells cultured with cytokines alone. (K) Fold change of the metabolic potential represented as glycolytic (extracellular acidification rate [ECAR]) to aerobic (oxygen consumption rate [OCR]) metabolism ratio of CD34+ cells expanded for 4 days with VPA relative to CD34+ cells treated with cytokines alone.39 Metabolic potential represents the percentage of stressed OCR and ECAR values measured on stimulation with oligomycin and carbonilcyanide p-triflouromethoxyphenylhydrazone (FCCP) over basal OCR and ECAR levels, respectively (n = 3). Experiments in H, I, and K were performed in triplicates, and values in I and K were normalized within each experiment. “n” is the number of biological replicates. Error bars with SEM, *P ≤ .05; **P ≤ .01; ***P ≤ .001; ****P ≤ .0001 were determined by 2-way ANOVA for panel A and unpaired Student t test for panels B, C, F, I, and K.
Primitive mitochondrial profile is essential for acquisition of the HSC phenotype
To explore whether the phenotypic and mitochondrial alterations were linked and dependent on continuous exposure to VPA, we removed VPA at different time points. Within 48 hours of VPA removal, both the percentage and number of HSCs decreased to levels resembling those observed in cultures containing cytokines alone (Figure 4A-B). Independent of the time of VPA removal, the remaining HSCs exhibited an increase in mitochondrial mass, membrane potential, and ROS levels compared with the HSCs that were continuously exposed to VPA (Figure 4C-E). These changes were most prominent in the subpopulation of HSCs that were exposed to VPA for the shortest period. Given that HSCs expanded with VPA exhibited an enhanced glycolytic capacity, we explored the role of glycolysis during acquisition of the HSC phenotype. RNA-seq analysis revealed that CD34+ cells expanded with VPA have an increased levels of monocarboxylate transporters (supplemental Figure 3F), which have been associated with pluripotent cells.58 We combined VPA with an inhibitor of monocarboxylate transporters, α-cyano-4-hydroxycinnamic acid, which inhibits lactate efflux and glycolysis.59 This combination inhibited glycolysis (Figure 4F) and decreased the percentage of HSCs during the first 48 hours of incubation with VPA without inducing cell death (Figure 4G; supplemental Figure 3G). To further establish the role of mitochondria in acquisition of the HSC phenotype, we expanded the CD34+ cells under normoxic (21% O2) and hypoxic (1.5% O2) conditions that lower mitochondrial respiration.3,60,61 VPA-expanded HSCs in cultures incubated under hypoxia exhibited lower ROS levels, mitochondrial mass, and potential compared with cells incubated under normoxia (Figure 4H). Alterations in the mitochondrial profile observed under hypoxia were associated with an increase in the percentage of HSCs (Figure 4I). These findings suggest that both the acquisition and the maintenance of the HSC phenotype requires continuous exposure to VPA, and that the cellular reprograming of CD34+ cells into HSCs is tightly coupled to and dependent on an altered mitochondria with limited activity and enhanced glycolytic potential.
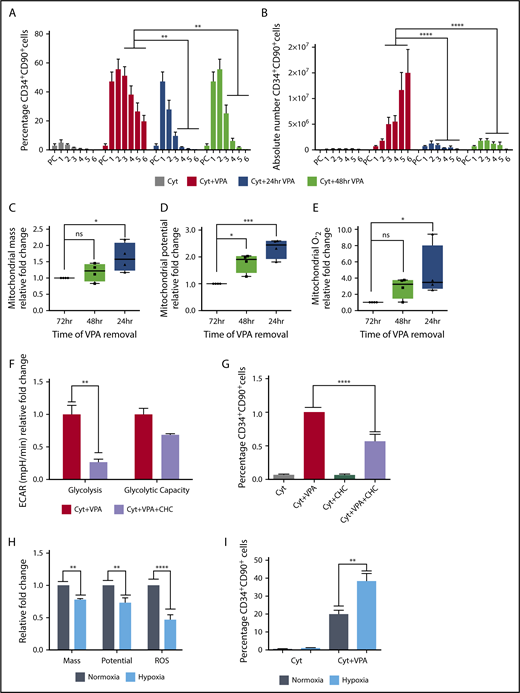
Primitive mitochondrial profile accompanied by increased glycolysis is required for the acquisition of HSCs. (A-B) Effect of VPA withdrawal at different points on the percentage (A) and absolute number (B) of CD34+CD90+ cells generated by treatment with VPA or cytokines alone throughout the 6-day culture period (n = 5). X-axis represents days of the culture, and PC denotes the uncultured UCB cells. (C-E) Effect of VPA removal after various intervals on mitochondrial mass (C), membrane potential (D), and superoxide anion levels (E) of CD34+CD90+ cells cultured for 4 days. Graphs represent fold change of MFI values of MitoTracker Green, tetramethylrhodaminemethyl ester, and MitoSOX relative to the corresponding values observed in CD34+CD90+ cells that were continuously exposed for 72 hours to VPA (n = 4). (F) Glycolysis activity measured by ECAR in VPA expanded CD34+ cells in the presence or absence of 2-cyano-3-(4-hydroxyphenyl)-2-propenoic acid. (G) Effect of glycolysis inhibition on the percentage of CD34+CD90+ cells expanded for 2 days with VPA in the presence of 1 mM 2-cyano-3-(4-hydroxyphenyl)-2-propenoic acid. (H) Effect of hypoxia on mitochondrial mass, potential, and ROS levels of CD34+CD90+ cells expanded for 4 days with VPA (n = 4). (I) Effect of hypoxia on the percentage of CD34+CD90+ cells generated by the end of the expansion period (n = 4). “n” is the number of biological replicates. Error bars with standard error of the means, ****P ≤ .0001; ***P ≤ .001; **P ≤ .01; *P ≤ .05 were determined by β models for panel B, negative-binomial models for panel C, and 2-way ANOVA for panels D-H.
Primitive mitochondrial profile accompanied by increased glycolysis is required for the acquisition of HSCs. (A-B) Effect of VPA withdrawal at different points on the percentage (A) and absolute number (B) of CD34+CD90+ cells generated by treatment with VPA or cytokines alone throughout the 6-day culture period (n = 5). X-axis represents days of the culture, and PC denotes the uncultured UCB cells. (C-E) Effect of VPA removal after various intervals on mitochondrial mass (C), membrane potential (D), and superoxide anion levels (E) of CD34+CD90+ cells cultured for 4 days. Graphs represent fold change of MFI values of MitoTracker Green, tetramethylrhodaminemethyl ester, and MitoSOX relative to the corresponding values observed in CD34+CD90+ cells that were continuously exposed for 72 hours to VPA (n = 4). (F) Glycolysis activity measured by ECAR in VPA expanded CD34+ cells in the presence or absence of 2-cyano-3-(4-hydroxyphenyl)-2-propenoic acid. (G) Effect of glycolysis inhibition on the percentage of CD34+CD90+ cells expanded for 2 days with VPA in the presence of 1 mM 2-cyano-3-(4-hydroxyphenyl)-2-propenoic acid. (H) Effect of hypoxia on mitochondrial mass, potential, and ROS levels of CD34+CD90+ cells expanded for 4 days with VPA (n = 4). (I) Effect of hypoxia on the percentage of CD34+CD90+ cells generated by the end of the expansion period (n = 4). “n” is the number of biological replicates. Error bars with standard error of the means, ****P ≤ .0001; ***P ≤ .001; **P ≤ .01; *P ≤ .05 were determined by β models for panel B, negative-binomial models for panel C, and 2-way ANOVA for panels D-H.
Suppression of ROS levels by p53 activity is essential for HSC expansion
We explored whether the reduced mitochondrial mass and activity was the sole mechanism by which ROS were maintained at low levels. VPA increased transcript levels of the antioxidant enzymes MnSOD and sestrin 2 (Figure 5A). To understand the mechanism responsible for this increase, we examined p53, which regulates both MnSOD and sestrin 2 levels.62,63 VPA increased both total and acetylated levels of p53 (Figure 5B), thereby enhancing the p53 activity. Levels of p21, a downstream target of p53, were also increased by VPA. GSEA analysis revealed an enrichment of the genes involved in the p53 network (supplemental Figure 4A). In contrast, VPA treatment suppressed p38 phosphorylation, indicating low levels of oxidative stress13 (Figure 5B). To elucidate the role of p53 during HSC expansion, we used p53 siRNA and pifithrin α, which inhibits p53 transcriptional activities. As anticipated, p53 levels were not affected by treatment with pifithrin α (data not shown), whereas p53 siRNA treatment reduced p53 transcript levels (supplemental Figure 4B). These treatments did not have an effect on cell viability or apoptosis (supplemental Figure 4F-H). Combination of VPA with either pifithrin α or p53 siRNA suppressed the percentage and absolute number of HSCs, irrespective of the duration of culture (Figure 5C-D; supplemental Figure 4C-D; data not shown). A significant reduction in the percentage of HSCs was observed as early as 48 hours of treatment with VPA and pifithrin α, indicating that p53 inhibition affects the acquisition of the HSC phenotype (supplemental Figure 4E). We next examined the relationship between increased p53 and mitochondrial activity. HSCs present in cultures incubated with a combination of VPA and either pifithrin α or p53 siRNA exhibited a similar mitochondrial mass with HSCs expanded with VPA (Figure 5E; supplemental Figure 4I). Pifithrin α treatment did not alter the mitochondrial DNA content observed in CD34+ cells expanded with VPA (Figure 5F). In contrast, HSCs exposed to a combination of VPA and either pifithrin α or p53 siRNA generated higher levels of ROS than HSCs propagated with VPA (Figure 5G; supplemental Figure 4J). Isolated CD34+ cells from cultures receiving VPA and pifithrin α displayed elevated OXPHOS activity, as well as ATP and basal oxygen respiration levels, compared with CD34+ cells expanded with VPA, indicating an increased mitochondrial activity (Figure 5H; supplemental Figure 4K). These data suggest that p53 contributes to acquisition and expansion of HSCs with VPA by modulating ROS levels, rather than by affecting mitochondrial mass. The functional significance of these findings was demonstrated by transplanting the progeny of 5 × 10⁴ CD34+ cells expanded for 4 days into NSG mice (NOD scid gamma NOD.Cg-Prkdcscid Il2rgtm1Wjl/SzJ). The cells treated with VPA led to a higher degree of human cell chimerism than that achieved with grafts generated by the combination of VPA and pifithrin α (Figure 5I). We sought to assess the effect of a further elevation of p53 levels on VPA-mediated HSC expansion. The addition of low doses of nutlin 3a, an inhibitor of MDM2/p53 to VPA increased p53 levels (supplemental Figure 4L) and augmented the percentage of HSCs (Figure 5J) without affecting their viability (data not shown). Higher concentrations of nutlin 3a (5-10 µM) in combination with VPA triggered cell death (data not shown), raising the possibility that HSCs benefit from a limited increase in the p53 levels. The relative increase in HSC percentage induced by the combined treatment of nutlin 3a with VPA (Figure 5J) was comparable to that achieved with the combination of VPA with the antioxidant N-acetyl-cysteine (NAC-5mM; Figure 5K) that antagonize ROS (Figure 5M). Strikingly, HSCs generated with VPA and HSCs generated with the combination of nutlin 3a and VPA contained a similar mitochondrial mass (Figure 5L). Thus, although VPA induces remodeling of a mitochondrial network, which is needed to maintain ROS at low levels, there are still sufficient ROS levels that can limit the degree of HSC expansion with VPA. Similar to NAC, HSCs expanded with nutlin 3a, and VPA contained lower levels of ROS than HSCs expanded with VPA (Figure 5M). Thus, using different approaches, we demonstrated that a higher degree of ROS suppression affects both the acquisition and the maintenance of the HSCs. Collectively, these data implicate p53 as an additional, yet an important, regulator of ROS that influence the stem cell fate and their functionality during expansion with VPA.
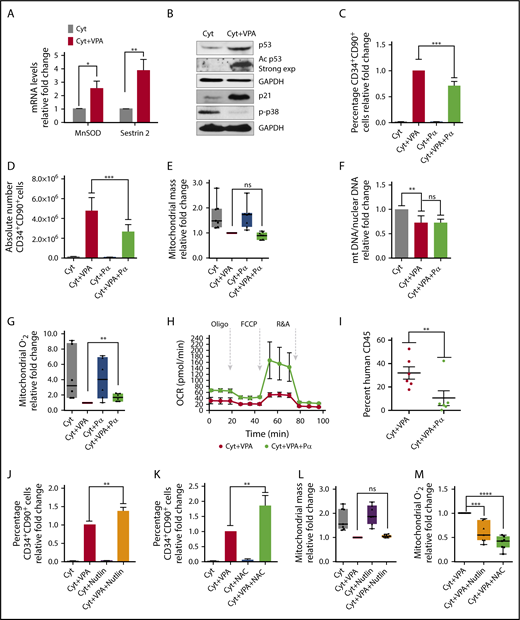
p53 inhibition impairs expansion of HSCs with VPA by increasing ROS levels. (A) Transcript levels of MnSOD and Sestrin 2 in TNCs cultured for 4 days (n = 6). (B) Total and acetylated levels of p53, p21, and p-p38 were determined by western blot analysis. GAPDH (representative blot) was used as an internal control (n = 3). Relative fold change for p53, p21, and p38 in VPA-treated cells compare with those treated with cytokines alone was 2.58, 24.9, and 0.12, respectively. ImageJ was used to quantify WB images and values were normalized to GAPDH. (C-D) Effect of pifithrin α (Pα) on the percentage (C) and absolute number of CD34+CD90+ cells (D) cultured for 4 days (n = 8). Graphs represent fold change of the percentage of CD34+CD90+ cells treated as indicated relative to those treated with VPA within each experiment. (E) Effect of p53 inhibition on mitochondrial mass of CD34+CD90+ cells expanded for 4 days. Graphs represent fold change of MFI of MitoTracker Green in CD34+CD90+ within each experiment (n = 6). (F) Relative mitochondrial to nuclear DNA ratio of purified CD34+ cells from cultures treated for 4 days (n = 6). Graphs represent fold change of the mtDNA/nDNA ratio of CD34+ cells treated as indicated relative to those treated with cytokines alone within each experiment. (G) Effect of p53 activity inhibition on ROS levels in CD34+CD90+ cells expanded for 4 days. Graphs represent fold change of MitoSOX (MFI) in CD34+CD90+ cells within each experiment (n = 6). (H) Oxygen consumption rates measured by seahorse analyzer in CD34+ cells expanded for 4 days (n = 3). Experiments in H were performed in triplicates and values were normalized within each experiment. (I) Percentage of human CD45+ cells in the bone marrow of NSG mice 16 weeks posttransplantation with grafts derived from 4 different donors (n = 6). (J-K) Effect of nutlin 3a and NAC on the percentage of CD34+CD90+ cells expanded for 4 days (n = 5). (L-M) Effect of nutlin 3a or NAC on the mitochondrial mass (L) and mitochondrial ROS (M) of CD34+CD90+ cells (n = 6). Graphs in panels J-L represent fold change of the percentage of CD34+CD90+ cells treated as indicated relative to those expanded with VPA within each experiment. “n” is the number of biological replicates. Error bars with SEM, ****P ≤ .0001; ***P ≤ .001; **P ≤ .01; *P ≤ .05 were determined by negative-binomial models for panels E and I, unpaired Student t test for panels A, E, and G, 2-way ANOVA for panels C, F, J-M.
p53 inhibition impairs expansion of HSCs with VPA by increasing ROS levels. (A) Transcript levels of MnSOD and Sestrin 2 in TNCs cultured for 4 days (n = 6). (B) Total and acetylated levels of p53, p21, and p-p38 were determined by western blot analysis. GAPDH (representative blot) was used as an internal control (n = 3). Relative fold change for p53, p21, and p38 in VPA-treated cells compare with those treated with cytokines alone was 2.58, 24.9, and 0.12, respectively. ImageJ was used to quantify WB images and values were normalized to GAPDH. (C-D) Effect of pifithrin α (Pα) on the percentage (C) and absolute number of CD34+CD90+ cells (D) cultured for 4 days (n = 8). Graphs represent fold change of the percentage of CD34+CD90+ cells treated as indicated relative to those treated with VPA within each experiment. (E) Effect of p53 inhibition on mitochondrial mass of CD34+CD90+ cells expanded for 4 days. Graphs represent fold change of MFI of MitoTracker Green in CD34+CD90+ within each experiment (n = 6). (F) Relative mitochondrial to nuclear DNA ratio of purified CD34+ cells from cultures treated for 4 days (n = 6). Graphs represent fold change of the mtDNA/nDNA ratio of CD34+ cells treated as indicated relative to those treated with cytokines alone within each experiment. (G) Effect of p53 activity inhibition on ROS levels in CD34+CD90+ cells expanded for 4 days. Graphs represent fold change of MitoSOX (MFI) in CD34+CD90+ cells within each experiment (n = 6). (H) Oxygen consumption rates measured by seahorse analyzer in CD34+ cells expanded for 4 days (n = 3). Experiments in H were performed in triplicates and values were normalized within each experiment. (I) Percentage of human CD45+ cells in the bone marrow of NSG mice 16 weeks posttransplantation with grafts derived from 4 different donors (n = 6). (J-K) Effect of nutlin 3a and NAC on the percentage of CD34+CD90+ cells expanded for 4 days (n = 5). (L-M) Effect of nutlin 3a or NAC on the mitochondrial mass (L) and mitochondrial ROS (M) of CD34+CD90+ cells (n = 6). Graphs in panels J-L represent fold change of the percentage of CD34+CD90+ cells treated as indicated relative to those expanded with VPA within each experiment. “n” is the number of biological replicates. Error bars with SEM, ****P ≤ .0001; ***P ≤ .001; **P ≤ .01; *P ≤ .05 were determined by negative-binomial models for panels E and I, unpaired Student t test for panels A, E, and G, 2-way ANOVA for panels C, F, J-M.
p53-MnSOD axis is required for HSC expansion
We next examined the link between the limited increase in p53 activity and the enhanced expression of antioxidant enzymes. The increased transcript and protein levels of MnSOD and sestrin2 associated with VPA treatment were no longer observed in cultures treated with a combination of VPA with either p53 siRNA or pifithrin α, indicating that both of them are regulated by p53 (Figure 6A-B; supplemental Figure 5A-B). We next used 2 different validated MnSOD siRNAs and combined each of them with VPA. These treatments decreased MnSOD levels (supplemental Figure 5C) without compromising the viability of the cultured cells (supplemental Figure 5D; data not shown). Combining VPA with MnSOD siRNAs reduced both the percentage and the absolute number of HSCs generated as compared with cultures treated with VPA alone (Figure 6C-D; supplemental Figure 5E-F). Importantly, HSCs present in cultures treated with the combination VPA with MnSOD siRNAs contained similar mitochondrial mass but produced higher ROS levels than those present in cultures treated with VPA (Figure 6E-F). We conclude that both MnSOD and p53 inhibition had similar effects on the HSC expansion achieved with VPA. These findings indicate that the ability of VPA to expand the pool of HSCs cannot be solely attributed to its effects on mitochondrial activity, but relies in part on the p53-MnSOD axis to further suppress excessive levels of ROS.
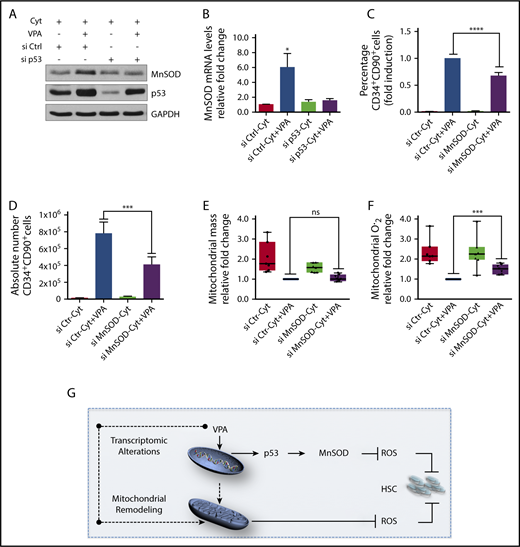
p53-MnSOD axis is critical for ex vivo expansion of HSCs by VPA. (A) Effect of VPA and p53 siRNA treatment on p53 and MnSOD protein levels in the TNCs cultured as indicated for 4 days. (B) Effect of p53 inhibition on MnSOD transcript levels assessed by quantitative reverse transcription polymerase chain reaction on the TNCs cultured for 4 days. mRNA levels were represented as fold change relative to mRNA levels of cells cultured with cytokines alone within each experiment that was performed in triplicate (n = 6). (C-D) Effect of MnSOD siRNA on the percentage and absolute number of CD34+CD90+ cells generated after 4 days of incubation (n = 5). (E-F) Effect of MnSOD siRNA on the mitochondrial mass (E) and ROS levels (F) in CD34+CD90+ cells cultured for 4 days. Graphs represent fold change of median fluorescence intensity of MitoTracker Green and MitoSOX, relative to the corresponding values observed in CD34+CD90+ cells cultured with VPA within each experiment (n = 7). (G) Model of the mechanisms underlying the ex vivo expansion of HSCs. The dotted arrows indicate possible mechanisms activated by VPA resulting in mitochondrial network remodeling. “n” is the number of biological replicates. Error bars with standard error of the mean. ****P ≤ .0001; ***P ≤ .001; *P ≤ .05 were determined by 2-way ANOVA for panels B-C, negative-binomial models for panels D and I, and unpaired Student t test for E-F.
p53-MnSOD axis is critical for ex vivo expansion of HSCs by VPA. (A) Effect of VPA and p53 siRNA treatment on p53 and MnSOD protein levels in the TNCs cultured as indicated for 4 days. (B) Effect of p53 inhibition on MnSOD transcript levels assessed by quantitative reverse transcription polymerase chain reaction on the TNCs cultured for 4 days. mRNA levels were represented as fold change relative to mRNA levels of cells cultured with cytokines alone within each experiment that was performed in triplicate (n = 6). (C-D) Effect of MnSOD siRNA on the percentage and absolute number of CD34+CD90+ cells generated after 4 days of incubation (n = 5). (E-F) Effect of MnSOD siRNA on the mitochondrial mass (E) and ROS levels (F) in CD34+CD90+ cells cultured for 4 days. Graphs represent fold change of median fluorescence intensity of MitoTracker Green and MitoSOX, relative to the corresponding values observed in CD34+CD90+ cells cultured with VPA within each experiment (n = 7). (G) Model of the mechanisms underlying the ex vivo expansion of HSCs. The dotted arrows indicate possible mechanisms activated by VPA resulting in mitochondrial network remodeling. “n” is the number of biological replicates. Error bars with standard error of the mean. ****P ≤ .0001; ***P ≤ .001; *P ≤ .05 were determined by 2-way ANOVA for panels B-C, negative-binomial models for panels D and I, and unpaired Student t test for E-F.
Discussion
In the current study, we demonstrate the mechanisms and events by which VPA treatment orchestrates the cellular reprograming of UCB-CD34+ cells leading ultimately to HSC expansion. Although ex vivo cultures have been reported to induce stress that compromises the primitive characteristics and function of primary HSCs, our data indicate that ex vivo treatment of UCB-CD34+ cells with VPA triggers the acquisition and retention of a transcriptome and primitive mitochondrial profile, which closely resembles that of primary functional HSCs.
VPA treatment alters the transcriptional landscape of UCB-CD34+ expanded cells. Key regulators that govern self-renewal potential and quiescence of HSCs, as well as long-term HSC phenotypic markers, were also strongly upregulated by VPA treatment.51 Conflicting reports have raised questions regarding the linkage between human HSC phenotypic markers and HSC functionality.64 However, a recent report has shown that nonhuman primate cells with the CD34+CD90+CD45RA− phenotype supported short-term and long-term multilineage reconstitution persisting up to 7.5 years after their transplantation into myeloablated nonhuman primates.55 Notably, the transcriptome of UCB-CD34+ cells expanded with VPA was enriched for both human and nonhuman long-term HSC signatures, supporting our previous functional HSC studies using NSG mice.1 On the basis of this evidence, we conclude that VPA expands a pool of cells with a transcriptome that resembles that of primary functional HSCs. This expansion is not simply a result of proliferation of the existing stem cells but, rather, a result of acquisition and retention of the HSC phenotype, as these cells undergo cell divisions and expand in numbers.
Remarkably, our data link the acquisition of an HSC phenotype and transcriptome to mitochondrial remodeling and p53 activation. Each of these events acts in concert to limit ROS levels. A switch from glycolysis to mitochondrial OXPHOS associated with increased ROS levels and mitochondrial ultrastructural changes is a hallmark of differentiating HSCs.11,19,20,22,65 In contrast, we demonstrated that the cellular reprograming of more differentiated UCB-CD34+ cells into HSCs is tightly linked to the remodeling to a primitive mitochondrial network, accompanied by respective changes in their ultrastructure and an enhanced glycolytic capacity. Similar mitochondrial network restructuring has been reported during iPSCs reprograming.25-27,65 Remodeling of mitochondrial network induced by VPA was concomitant with reduced mitochondrial content, OXPHOS activity, and ROS levels. Although acquisition of the HSC phenotype is associated with a reduced OXPHOS activity and ROS levels, increased mitochondrial activity and ROS levels accompany the loss of HSCs. An additional reduction in mitochondrial activity or ROS levels associated with hypoxic conditions or NAC treatment further enhanced the effect of VPA on HSCs. In contrast, inhibition of glycolysis impaired HSC reprograming and expansion induced with VPA. These findings suggest that remodeling to a primitive mitochondrial network is required for cellular reprograming of UCB-CD34+ cells and influence the degree of ex vivo expansion of HSCs.
A restructured primitive mitochondrial network triggered by VPA, however, is not sufficient to maintain ROS levels below a threshold that would lead to successful expansion with VPA. In addition to mitochondrial remodeling associated with limited activity, VPA activates the p53-MnSOD axis to reduce ROS levels. Here, we provide evidence that acquisition of HSCs from UCB-CD34+ cells and their functional identity is dependent on p53 activity. Furthermore, p53 activation and mitochondrial remodeling are distinct events. p53 activity does not affect mitochondrial mass. In fact, a reduction in the mitochondrial mass occurs simultaneously with an increase in the mitochondrial antioxidant MnSOD levels, a downstream target of p53. We therefore conclude that after VPA treatment, p53 activation and the remodeled mitochondrial network act in concert to reduce ROS levels permitting HSC expansion.
The role of p53 in HSC expansion with VPA is unexpected because p53 inhibition improves the efficacy of iPSCs reprograming.66 Both positive and negative effects of p53 on normal HSC behavior have, however, been described.36 Although activation of p53 can lead to apoptosis in response to stress,36,67 p53-deficient HSCs exhibit a reduced repopulating potential, and many have concluded that a threshold level of p53 is necessary for HSCs to cope with oxidative stress.33,34,36,39,68,69 Thus, it is conceivable that although VPA restructures a primitive mitochondrial profile to maintain ROS at low levels, it also regulates p53 activity at a level at which it exerts its antioxidant effects.
Mitochondrial remodeling might be either a downstream event of the nuclear epigenetic modifications1,39,43,70 or a consequence of the direct effects of VPA on mitochondria.10,65,71 It is important to emphasize that HSC expansion requires the priming of UCB-CD34+ cells with cytokines. Such cytokine treatments have been associated with the accumulation of active mitochondria that can be removed by mitophagy.24 Our ongoing investigation indicates that VPA treatment affects both mitophagy and mitochondrial biogenesis (unpublished data). These data highlight the capacity of VPA to induce transcriptional and mitochondrial alterations, as well as limited p53 activation. These events act in concert and determine the fate of cultured HSCs.
The data reported in this article have been deposited in the Gene Expression Omnibus database (accession number GSE110974).
The full-text version of this article contains a data supplement.
Acknowledgments
The authors thank Camelia Iancu-Rubin and Christoph Schaniel for their feedback and revision of the manuscript, as well as Bartek Jablonski and Selma Bekri for their technical assistance.
This work was supported by NYSTEM grant C030136 (R.H.) and National Institutes of Health, National Institute of Diabetes and Digestive and Kidney Diseases grant R56 DK046943 (S.C.S.).
Authorship
Contribution: L.P. conceived, designed, performed experiments, supervised the study, analyzed data, and prepared the manuscript; E.Z. performed experiments, analyzed data, and assisted with manuscript preparation; M.D. performed experiments, analyzed data, and assisted with manuscript preparation; U.O. performed statistical analysis; R.H. conceived experiments, designed experiments, supervised the study, analyzed data, and prepared the manuscript; Y.G performed RNA-seq analysis; R.S. supervised single-cell RNA-seq assay; and S.C.S supervised the RNA-seq analysis.
Conflict-of-interest disclosure: The authors declare no competing financial interests.
Correspondence: Luena Papa, Mount Sinai School of Medicine, 1 Gustave L. Levy Pl, Box 1079, New York, NY 10029; e-mail: luena.papa@mssm.edu; and Ronald Hoffman, Mount Sinai School of Medicine, 1 Gustave L. Levy Pl, Box 1079, New York, NY 10029; e-mail: ronald.hoffman@mssm.edu.

