

Key Points
Subclone formation is similar in AL and MGUS/MM; t(11;14) is typical main clone; 1q gain and 17p, 8p, or 13q deletion are frequent subclones.
t(11;14) suppresses emergence of subclones, thus accounting for the lower subclone frequency in AL amyloidosis.

Abstract
Analysis of intraclonal heterogeneity has yielded insights into the clonal evolution of hematologic malignancies. We compared the clonal and subclonal compositions of the underlying plasma cell dyscrasia in 544 systemic light chain amyloidosis (PC-AL) patients with 519 patients with monoclonal gammopathy of undetermined significance (MGUS), smoldering multiple myeloma (SMM), or symptomatic MM; ie, PC–non-AL patients). Using interphase fluorescence in situ hybridization, subclones were stringently defined as clone size below two thirds of the largest clone and an absolute difference of ≥30%. Subclones were found less frequently in the PC-AL group, at 199 (36.6%) of 544 as compared with 267 (51.4%) of 519 in the PC–non-AL group (P < .001), and were not associated with the stage of plasma cell dyscrasia in either entity. In both groups, translocation t(11;14), other immunoglobulin heavy chain translocations, and hyperdiploidy were typically found as main clones, whereas gain of 1q21 and deletions of 8p21, 13q14, and 17p13 were frequently found as subclones. There were no shifts in the subclone/main clone ratio depending on the MGUS, SMM, or MM stage of plasma cell dyscrasia. In multivariate analysis, t(11;14) was associated with lower rates of subclone formation and hyperdiploidy with higher rates. PC-AL itself lost statistical significance, demonstrating that the lower subclone frequency in AL is a reflection of its exceptionally high t(11;14) frequency. In summary, the subclone patterns in PC-AL and PC–non-AL are closely related, implying that subclone formation depends on the main cytogenetic categories and is independent of disease entity and stage.
Introduction
Intraclonal genetic heterogeneity has been investigated in hematologic malignancies in recent years.1-4 Studies have revealed that malignant cells within a single patient typically share common cytogenetic aberrations but are not genetically uniform, with some tumor cells harboring additional aberrations. Therefore, different subclones can be delineated among the malignant cells of an individual patient.
So far, these analyses of subclone architecture have yielded valuable insights into genetic clonal evolution during tumor development. In these models, cytogenetic aberrations are typically aligned on a timeline of genetic evolution, and clonal relationships are visualized in ancestral trees. Accordingly, cytogenetic aberrations that are present in main clones are deemed to constitute early, possibly initiating events, whereas cytogenetic aberrations detectable only in subclone size are considered as later and progression-related events. Typically, hierarchical cytogenetic patterns of clustering and mutually exclusive aberrations can be discerned. Frequently, subclones arise in tumor genomes, which already harbor a high complexity of cytogenetic aberrations. Interestingly, intraclonal heterogeneity has been identified as an adverse prognostic parameter in some hematologic malignancies, with genetic clonal heterogeneity favoring the outgrowth of therapy-resistant clones.4
Clonal heterogeneity has also been detected in multiple myeloma (MM),5-13 where the competition among subclones under the selective pressure of treatment has drawn attention as a possible resistance mechanism.6,14,15
Previous studies, including work from our own group, have identified the cytogenetic landscape in systemic light chain (AL) amyloidosis.16-21 It has been shown that the type of cytogenetic aberrations and their patterns are related to those in MM, although frequencies differ; t(11;14) is the prevailing cytogenetic aberration in AL amyloidosis, with fewer cases of hyperdiploid and high-risk karyotypes. However, the intraclonal heterogeneity of plasma cell dyscrasia in AL has remained unknown. Therefore, we aimed to characterize the cytogenetic architecture of subclones in a large cohort of AL patients, with an equally large non-AL group for comparison. We stratified both groups in monoclonal gammopathy of undetermined significance (MGUS), smoldering MM (SMM), and symptomatic MM patients to avoid bias of the analysis by the usually smaller underlying plasma cell clone in AL.
Material and methods
Patient selection and clinical parameters
All AL patients studied at our center by interphase fluorescence in situ hybridization (iFISH) from March 2004 to September 2017 were included (PC-AL group). AL cases with an underlying lymphoproliferative disorder or immunoglobulin M (IgM) gammopathy were excluded.22 The bone marrow aspiration for iFISH had to be performed while patients were still treatment naive. Patients with prior conventional chemotherapy (n = 19) or steroid prephase (n = 15) who had not attained at least partial remission were also included in this study. All patients with iFISH testing in remission, at relapse, or after high-dose chemotherapy were excluded. A total of 227 of 544 patients in the PC-AL group had been included in prior studies of the patterns of cytogenetic aberrations in AL.17,19,20 Untreated patients with MGUS, SMM, or symptomatic MM composed the control group (PC–non-AL group). Asymptomatic patients were drawn from a cohort from August 2002 to May 2017. Symptomatic patients were drawn from the GMMG HD4 trial.23 All patients provided written consent to participate in the study. The University of Heidelberg Ethics Committee approved the study.
The classification of patients into the MGUS, SMM, and symptomatic MM categories followed standard guidelines, with a bone marrow plasmocytosis ≥10% or a serum monoclonal protein >30 g/L defining the transition from MGUS to SMM.24 These cutoffs were equally applied to classify the underlying plasma cell dyscrasia in the PC-AL group and PC–non-AL comparison group.
The plasma cell content was taken from the bone marrow histology. In cases with no evaluable histology specimen, the bone marrow plasma cell count from the cytology smear was used instead.
Immunofixation of serum and urine was performed according to standard procedures, yielding the heavy and light chain type. Serum free light chains were determined using the Freelite serum free light chain test (Binding Site, Schwetzingen, Germany).
Cytogenetic testing and definition of main clones and subclones
iFISH was performed as previously described after previous enrichment of plasma cells using magnetic activated cell sorting with CD138 immunobeads.19,25,26 The iFISH panel covered IgH translocations t(11;14), t(4;14), and t(14;16). IgH translocations with unknown partner were identified by an IgH breakapart probe. Furthermore, the panel included probes for the chromosomal regions 1q21, 5p15/5q35, 8p21, 9q34, 11q22.3 (from August 2010 onward) or 11q23 (until August 2010), 13q14, 15q22, 17p13, and 19q13. iFISH was performed with commercial 2-color probe sets according to the manufacturer’s instructions (Kreatech, Amsterdam, The Netherlands; MetaSystems, Altlussheim, Germany). We counted at least 100 interphase nuclei per probe using a DM RXA fluorescence microscope (Leica, Wetzlar, Germany) or an automated FISH spot-counting system (Applied Spectral Imaging, Edingen-Neckarhausen, Germany). For study inclusion, the entire panel of iFISH probes had to be tested, with only ≤3 missing probes allowed. The lower thresholds for all cytogenetic aberrations were uniformly set at 10%.19
Hyperdiploidy was defined according to the criteria of Wuilleme et al,27 requiring trisomies of at least 2 of the 3 probes: 5p15/5q35, 9q34, and 15q22. High-risk cytogenetics was defined by the presence of t(4;14), t(14;16), deletion of 17q13, and/or gain of 1q21 (≥3 copies).28-32
For the distinction between main clones and subclones, the largest aberration was used as reference. Cytogenetic aberrations were classified as subclonal when both the clone size was smaller than two thirds the size of the largest clone and the absolute difference in clone size amounted to at least 30%.23 For example, in the case of a largest clone of 100% of analyzed CD138-enriched cells, all additional cytogenetic aberrations ≤66% would be counted as subclones; in the case of a main cytogenetic aberration of 60%, cytogenetic aberrations ≤30% would be counted as subclones. All aberrations with a clone size above the threshold were counted as main clones.
Only patients with a largest clone size ≥60% were considered for this analysis to allow a reliable allocation of the cytogenetic aberrations into the main clone and subclone categories. Importantly, this requirement led to a similar reduction of patient numbers from 735 to 544 in the PC-AL group and from 730 to 519 in the PC–non-AL group. Expectedly, early-stage gammopathy patients with a lower plasma cell count were overrepresented among excluded patients in PC-AL and PC–non-AL groups alike.
For cases of intraclonal heterogeneity within 1 chromosome probe (eg, a mixed triploid and tetraploid copy number state in uneven chromosomes), we used the term main clone and subclone within a single chromosome. For statistical analysis in this study, this phenomenon was counted as a subclone as well.
Statistical analysis
Fisher’s exact test was used to test association between categorical parameters. Cochran-Armitage test was used to test for trend across diagnostic categories. Wilcoxon test and Kruskal-Wallis test were used to compare quantitative parameters between groups. Group comparisons between AL and non-AL cohorts accounting for diagnostic stage were performed with a logistic regression model. P values were adjusted for multiple testing across probes using Holm correction to control the family-wise error rate. Difference in PC count between cytogenetic groups was assessed in a linear regression model after logit transformation, accounting for diagnostic stage. Difference in light chain disease (κ/λ) distribution between cytogenetic groups was assessed in a logistic regression model, accounting for diagnostic stage. A multivariable logistic regression model was fitted to assess the impact of parameters on likelihood of subclone formation (yes vs no). A proportional odds model was fitted to assess the impact of parameters on number of subclones (0 vs 1 vs >1). Cytogenetic aberrations were clustered, treating clonal aberration (none vs subclone vs main clone) as categorical variables.33 P < .05 was considered statistically significant. Analysis was performed with R version 3.4 statistical software.
Results
Clinical characteristics
The clinical and hematologic characteristics of the patients are listed in Table 1. Expectedly, the AL group contained a higher percentage of early and λ-restricted plasma cell dyscrasias and light chain–only types.
Patient clinical and hematologic characteristics
| PC-AL (n = 544) | PC–non-AL (n = 519) | P | |
|---|---|---|---|
| Clinical parameters | |||
| Median age (range), y | 62 (36-82) | 57 (25-91) | .003 |
| Sex, n (%) | .01 | ||
| Male | 343 (63.0) | 287 (55.3) | |
| Female | 201 (37.0) | 232 (44.7) | |
| Karnofsky index, median (range) | 80 (30-100) | ||
| Hematologic parameters | |||
| Stage of plasma cell dyscrasia, n (%) | <.001 | ||
| MGUS | 164 (30.1) | 62 (11.9) | |
| SMM | 345 (63.4) | 156 (30.1) | |
| MM | 35 (6.4) | 301 (58.0) | |
| Bone marrow plasmocytosis, median (range), % | 12 (1-99) | 30 (1-100) | <.001 |
| Median bone marrow plasmocytosis according to stage of plasma cell dyscrasia, % | |||
| MGUS | 5.9 | 6.1 | |
| SMM | 18.7 | 23.3 | |
| MM | 46.8 | 55.8 | |
| Monoclonal protein, n (%) | <.001 | ||
| IgG | 157 (28.9) | 328 (63.2)* | |
| IgA | 49 (9.0) | 116 (22.4)* | |
| IgD | 6 (1.1) | 3 (0.6) | |
| Light chain only | 332 (61.0) | 66 (12.7) | |
| Light chain restriction, n (%) | <.001 | ||
| κ | 124 (22.8) | 322 (62.3)* | |
| λ | 420 (77.2) | 193 (37.3)* | |
| dLFC, median (range), mg/L | 306.2 (−17.7 to 19 251.5) | ||
| ≥180, n/N (%) | 340/533 (63.8) | ||
| Organ involvement | |||
| No. of involved organs, median (range) | 3 (1-7) | ||
| Heart involvement, n/N (%) | 429/544 (78.9) | ||
| Mayo stage 2004, N (%)† | |||
| I | 73 (13.8) | ||
| II | 196 (37.2) | ||
| III | 258 (49.0) | ||
| NT-pro-BNP, median (range), ng/L | 4134 (22-565 442) | ||
| Soft tissue involvement, n/N (%) | 249/543 (45.9) | ||
| Renal involvement, n/N (%) | 233/543 (57.1) | ||
| Renal stage, N (%) | |||
| 1 | 271 (52.0) | ||
| 2 | 192 (36.9) | ||
| 3 | 58 (11.1) | ||
| GI tract involvement, n/N (%) | 192/544 (35.3) | ||
| Liver involvement, n/N (%) | 104/543 (19.2) | ||
| Peripheral neuropathy, n/N (%) | 88/543 (16.2) |
dFLC, difference between involved and uninvolved light chains; NT-pro-BNP, N-terminal prohormone of brain natriuretic peptide.
Group also includes biclonal gammopathies.
Staging criteria according to Dispenzieri et al.39
Overall frequencies and patterns of cytogenetic aberrations
The current study confirmed the previously reported frequency ranges of cytogenetic aberrations in AL amyloidosis (PC-AL) as compared with MGUS, SMM, and symptomatic MM (PC–non-AL). Translocation t(11;14) was most prevalent, with 331 (60.8%) of 544 patients affected in the PC-AL group as compared with 76 (14.6%) of 519 in the PC–non-AL group (Table 2). Markedly, within the AL group, the frequency of t(11;14) declined with the progression of plasma cell dyscrasia. Nevertheless, t(11;14) remained significantly more prevalent in PC-AL as compared with PC–non-AL, even after accounting for the different distribution of plasma cell dyscrasia stages (P < .001). In contrast, PC-AL displayed less hyperdiploidy (P < .001 for all probes) and high-risk aberrations (P < .001 for t(4;14) and t(14;16); P = .034 for gain of 1q21; P = .19 for deletion of 17p13).
Frequency of cytogenetic iFISH aberrations depending on disease (PC-AL vs PC–non-AL) and stage of plasma cell dyscrasia (MGUS/SMM/MM)
| PC-AL | PC–non-AL | P (PC-AL vs PC–non-AL) | |||||||||
|---|---|---|---|---|---|---|---|---|---|---|---|
| n/N (%) | P | n/N (%) | P | ||||||||
| Total (n = 544) | MGUS (n = 164) | SMM (n = 345) | MM (n = 35) | Total (n = 519) | MGUS (n = 62) | SMM (n = 156) | MM (n = 301) | ||||
| Translocations | |||||||||||
| t(11;14) | 331/544 (60.8) | 117/164 (71.3) | 200/345 (58.0) | 14/35 (40.0) | .001 | 76/519 (14.6) | 4/62 (6.5) | 7/156 (4.5) | 65/301 (21.6) | <.001 | <.001 |
| t(4;14) | 19/544 (3.5) | 1/164 (0.6) | 16/345 (4.6) | 2/35 (5.7) | .17 | 86/519 (16.6) | 6/62 (9.7) | 33/156 (21.2) | 47/301 (15.6) | .81 | <.001 |
| t(14;16) | 13/543 (2.4) | 2/164 (1.2) | 11/344 (3.2) | 0/35 (0) | .58 | 30/511 (5.5) | 9/60 (15.0) | 15/153 (9.8) | 6/298 (2.0) | <.001 | <.001 |
| IgH unknown | 94/541 (17.4) | 25/164 (15.2) | 286/343 (16.6) | 12/34 (35.3) | .25 | 166/489 (33.9) | 37/61 (60.7) | 75/153 (49.0) | 54/275 (19.6) | <.001 | <.001 |
| Gains | |||||||||||
| 1q21 | 167/544 (30.7) | 40/164 (24.4) | 115/345 (33.3) | 12/35 (34.3) | .25 | 195/519 (37.6) | 23/62 (37.1) | 69/156 (44.2) | 103/301 (34.2) | .75 | .034 |
| 5p15/5q35 | 83/533 (15.6) | 17/160 (10.6) | 54/341 (15.8) | 12/32 (37.5) | .013 | 136/367 (37.1) | 17/54 (31.5) | 54/148 (36.5) | 65/165 (39.4) | .75 | <.001 |
| 9q34 | 172/543 (31.7) | 42/163 (25.8) | 112/345 (32.5) | 18/35 (51.4) | .054 | 283/517 (54.7) | 31/62 (50.0) | 80/156 (51.3) | 172/299 (57.5) | .75 | <.001 |
| 11q22.3 | 211/544 (38.8) | 71/164 (43.3) | 128/345 (37.1) | 12/35 (34.3) | .31 | 224/519 (43.2) | 15/62 (24.2) | 58/156 (37.2) | 151/301 (50.2) | <.001 | .59 |
| 11q23 | |||||||||||
| 15q22 | 97/544 (17.9) | 19/163 (11.7) | 64/344 (18.6) | 14/35 (40.0) | .004 | 245/517 (47.5) | 21/62 (33.9) | 65/156 (41.7) | 159/299 (53.2) | .01 | <.001 |
| 19q13 | 102/542 (18.8) | 21/163 (12.9) | 70/344 (20.3) | 11/35 (31.4) | .054 | 258/519 (49.7) | 23/62 (37.1) | 73/156 (46.8) | 162/301 (53.8) | .067 | <.001 |
| Deletions | |||||||||||
| 8p21 | 38/534 (7.1) | 6/161 (3.7) | 28/338 (8.3) | 4/35 (11.4) | .22 | 108/519 (20.8) | 3/62 (4.8) | 29/156 (18.6) | 76/301 (25.2) | .003 | .034 |
| 13q14 | 209/544 (38.4) | 56/164 (34.1) | 133/345 (38.6) | 20/35 (57.1) | .22 | 264/519 (50.9) | 2 /62 (41.9) | 79/156 (50.6) | 159/301 (52.8) | .75 | .071 |
| 17p13 | 16/544 (2.9) | 3/164 (1.8) | 10/345 (2.9) | 3/35 (8.6) | .25 | 47/519 (9.1) | 1/62 (1.6) | 10/156 (6.4) | 36/301 (12.0) | .024 | .19 |
Frequency of cytogenetic aberrations in the AL amyloidosis group (PC-AL) as compared with the MGUS/SMM/MM control group (PC–non-AL group). Frequencies are also detailed for the respective stages of plasma cell dyscrasia. P values indicate changes of the frequency of the respective aberrations depending on the stage of plasma cell dyscrasia. The P value in the last column addresses the frequency difference between the PC-AL and PC–non-AL groupS (adjusted for the respective frequencies of MGUS/SMM/MM in both groups via logistic regression). All P values were adjusted for multiple testing across probes using Holm correction to control the family-wise error rate.
The juxtaposition of the PC-AL and PC–non-AL groups in cluster analysis showed largely overlapping cytogenetic patterns, despite the known discrepant frequencies of the respective chromosomal aberrations. Here, the cluster analysis confirmed the known dichotomy between t(11;14) and hyperdiploidy and the distribution of 11q22.3 or 11q23 aberrations into the t(11;14)+ and hyperdiploid cases. Hyperdiploidy probes clustered jointly with each other, and accordingly, probes 5p15/5q35, 9q34, 15q22, and 19q13 were combined into a single branch (supplemental Figure 1).
Regarding the association with hematologic parameters, gains of chromosomes 5p15/5q35 and 19q13 (P < .05 each) went along with a higher bone marrow plasma cell count in the PC-AL group. Translocation t(11;14) as a notable exception was associated with a lower bone marrow plasma cell count (P = .03). Detailed analysis of the individual chromosomal aberrations confirmed the previously observed association of t(11;14) with a light chain–only type and hyperdiploidy with an intact immunoglobulin (P < .001 each). Furthermore, gain of 1q21 was strongly associated with λ (P < .001) and gain of 11q22.3 or 11q23 with κ light chain restriction (P = .009).
Next, we analyzed the frequencies of cytogenetic aberrations depending on the stage of plasma cell dyscrasia, classified as MGUS, SMM, or symptomatic MM (Table 2). In PC-AL, the SMM and MM stages displayed a lower t(11;14) frequency than the MGUS stage (P = .001) and increased frequencies for all hyperdiploidy gains. Statistical significance for increased frequencies of gain of 1q21, t(4;14), IgH translocations with an unknown partner, and deletions of 8p12 and 13q14 was lost after adjustment for multiple testing.
Overall frequency of subclone aberrations
The overall subclone frequency in the PC-AL group was 199 (36.6%) of 544. This subclone group comprised 21 patients with main clone and subclone within a single chromosome, typically a mixed triploid and tetraploid state of a chromosomal gain; 154 patients with a pure subclone aberration; and 24 patients displaying both phenomena for different cytogenetic probes.
Within the PC-AL group, the overall subclone frequency slightly increased from 54 (32.9%) of 164 at the MGUS stage to 132 (38.3%) of 345 at the SMM and 13 (37.1%) of 35 at the symptomatic MM stages, although this increase in subclone formation along with the progression of plasma cell dyscrasia was not statistically significant (P = .32; Figure 1).
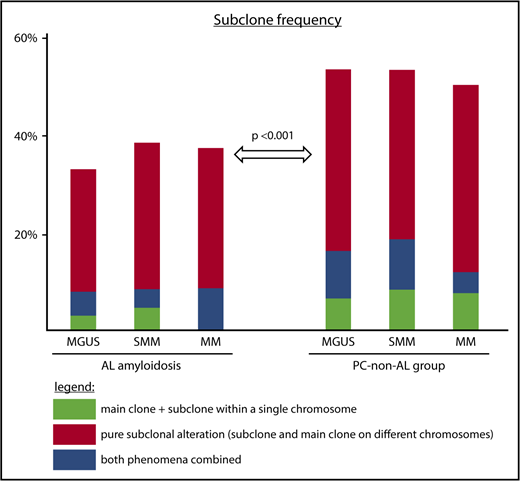
Subclone frequencies depending on disease and plasma cell stage. Subclone frequencies for patients with main clone and subclone within a single chromosome (green); pure subclone aberrations, where subclone and main clone affect different chromosomes (red); and both of these types for each disease entity (blue). P value is given for test on overall difference in subclone frequency between PC-AL and PC–non-AL accounting for stage of plasma cell dyscrasia.
Subclone frequencies depending on disease and plasma cell stage. Subclone frequencies for patients with main clone and subclone within a single chromosome (green); pure subclone aberrations, where subclone and main clone affect different chromosomes (red); and both of these types for each disease entity (blue). P value is given for test on overall difference in subclone frequency between PC-AL and PC–non-AL accounting for stage of plasma cell dyscrasia.
In the PC–non-AL group, the overall frequency of subclone formation was significantly higher, at 267 (51.4%) of 519 (P < .001). Here, the subclone group was composed of 40 cases of main clone and subclone within a single chromosome, 192 cases of a pure subclone aberration, and 35 cases with both phenomena.
This higher frequency was homogeneously found at all stages of non-AL plasma cell dyscrasia, with 33 (53.2%) of 62 in MGUS (P = .006), 83 (53.2%) of 156 in SMM (P = .002), and 151 (50.2%) of 301 in symptomatic MM (P = .16).
Among the subclone patients, 71 (35.7%) of 199 in the PC-AL group harbored at least 2 subclone aberrations, as compared with 122 (45.7%) of 267 in the PC–non-AL group (P = .04). The PC-AL group harbored not only fewer subclone patients overall, but also fewer patients with several subclones.
Frequency of subclone aberrations in specific cytogenetic aberrations
Table 3 summarizes the distribution of main clones and subclones specified by the individual cytogenetic aberrations. In PC-AL, IgH translocations were overwhelmingly found as main clones, with IgH translocations in subclones found only in rare exceptions. This effect was most pronounced for t(11;14), which was found in 331 AL patients (60.8%), among them 328 times as main clone (60.3%) and a mere 3 times as subclone (0.6%). However, the effect was also visible for t(4;14), at 3.1% vs 0.4%; t(14;16), at 2.4% vs 0%; and IgH translocations with an unknown partner, at 15.2% vs 2.2%. The hyperdiploidy probes 5p15/5q35, 9q34, 15q22, and 19q13 were also predominantly found as main clone aberrations.
Frequency of cytogenetic aberrations separated by subclones and main clones
| Cytogenetic aberration | PC-AL (n = 544) | PC–non-AL (n = 519) | P (PC-AL vs PC–non-AL) | ||||||
|---|---|---|---|---|---|---|---|---|---|
| n/N (%) | Subclone/main clone ratio | n/N (%) | Subclone/main clone ratio | ||||||
| Main clone | Main clone plus subclone | Subclone | Main clone | Main clone plus subclone | Subclone | ||||
| t(11;14) | 328/544 (60.3) | 3/544 (0.6) | 0.009 | 75/519 (14.5) | 1/519 (0.2) | 0.013 | 1 | ||
| t(4;14) | 17/544 (3.1) | 2/544 (0.4) | 0.12 | 82/519 (15.8) | 4/519 (0.8) | 0.05 | 1 | ||
| t(14;16) | 13/543 (2.4) | 0/543 (0) | 0 | 30/511 (5.9) | 0/511 (0) | 0 | — | ||
| IgH unknown | 82/541 (15.2) | 12/541 (2.2) | 0.15 | 138/489 (28.2) | 28/489 (5.7) | 0.20 | 1 | ||
| Gain 1q21 | 102/544 (18.8) | 15/544 (2.8) | 50/544 (9.2) | 0.56 | 114/519 (22.0) | 35/519 (6.7) | 46/519 (8.9) | 0.54 | 1 |
| Gain 5p15/5q35 | 75/533 (14.1) | 1/533 (0.2) | 7/533 (1.3) | 0.11 | 111/367 (30.2) | 3/367 (0.8) | 22/367 (6.0) | 0.22 | 1 |
| Gain 9q34 | 123/543 (22.7) | 7/543 (1.3) | 42/543 (7.7) | 0.38 | 202/517 (39.0) | 23/517 (4.4) | 58/517 (11.2) | 0.36 | 1 |
| Gain 11q22.3 | 168/544 (30.9) | 12/544 (2.2) | 31/544 (5.7) | 0.24 | 179/519 (34.5) | 10/519 (1.9) | 35/519 (6.7) | 0.24 | 1 |
| Gain 11q23 | |||||||||
| Gain 15q22 | 74/542 (13.7) | 6/542 (1.1) | 17/542 (3.1) | 0.29 | 201/517 (38.9) | 14/517 (2.7) | 30/517 (5.8) | 0.20 | 1 |
| Gain 19q13 | 87/542 (16.1) | 5/542 (0.9) | 10/542 (1.8) | 0.16 | 191/519 (36.8) | 12/519 (2.3) | 55/519 (10.6) | 0.33 | .43 |
| Deletion 8p21 | 20/534 (3.7) | 18/534 (3.4) | 0.90 | 66/519 (12.7) | 42/519 (8.1) | 0.64 | 1 | ||
| Deletion 13q14 | 157/544 (28.9) | 52/544 (9.6) | 0.33 | 228/519 (43.9) | 36/519 (6.9) | 0.16 | 1 | ||
| Deletion 17p13 | 4/544 (0.7) | 12/544 (2.2) | 3.0 | 31/519 (6.0) | 16/519 (3.1) | 0.52 | 1 | ||
Frequencies of each chromosomal aberration separately for subclones and main clones. The phenomenon main clone and subclone within a single chromosome, typically a mixed triploid and tetraploid state, is listed separately for chromosomal gains. The subclone/main clone ratio denotes the proportion of subclone vs main clone aberrations. Low ratios, such as 0.009 for t(11;14), indicate the cytogenetic aberrations are typically found as a main clone, whereas high ratios, such as 3.0 for deletion of 17p13, indicate that the aberrations are frequently of subclone size. For this analysis, the cases of main clone and subclone within a single chromosome were counted as both subclone and main clone aberrations. The P value in the last column addresses the subclone frequency difference between the PC-AL and PC–non-AL groups (again adjusted for the respective frequencies of MGUS/SMM/MM in both groups via logistic regression). P values were adjusted for multiple testing across probes using Holm correction to control the family-wise error rate.
The only aberration present more frequently in subclone than in main clone size was deletion of 17p13, at 2.2% vs 0.7%. Deletion of 8p21 and gain of 1q21 were also frequent subclone aberrations (3.4% vs 3.7% and 11.9% vs 21.5% in subclone vs main clone, respectively).
These results were largely corroborated in the PC–non-AL group, with accordingly no statistically significant differences between the PC-AL and PC–non-AL groups. This implies that generally, the typical clone size of a cytogenetic aberration is an inherent feature of the aberration and not an AL-specific effect.
Among the exceptional 10 cases in PC-AL and PC–non-AL featuring t(11;14) and t(4;14) at subclone size, 3 patients displayed concurrent large hyperdiploidy gains, implying hyperdiploidy as the initiating event or a large hyperdiploid clone pushing aside the t(11;14)/t(4;14) to subclone level. In the other 7 patients, t(11;14) or t(4;14) was downgraded to subclone size by gain of 11q22.3 or 11q23, deletion of 13q14, or gain of 4p16 in main clone size. These few cases, particularly those resulting from translocation-associated gain of 11q22.3 or 11q23, might well be due to statistical scattering and therefore a biologically incorrect subclone classification.
In a next step we analyzed the subclone vs main clone frequencies for the respective cytogenetic aberrations separately by disease group. Here, the subclone/main clone ratio for each cytogenetic aberration remained largely unchanged irrespective of PC-AL vs PC–non-AL and also irrespective of the stage of plasma cell dyscrasia (Figure 2; supplemental Table 1). A notable exception seems to be deletion of 17p13, which was only detectable in subclone size at the MGUS stage, whereas it was found in main clone size in some cases in the MM group (overall number of deletion of 17p13 in PC-AL was only n = 16; P = 1.0 after adjustment for multiple testing). This phenomenon was more pronounced in the larger deletion of 17p13 PC–non-AL group (n = 47), although statistical significance was lost after adjustment for multiple testing (P = .15).

Subclone frequencies specified for individual chromosomes. Frequency of cytogenetic aberrations, sorted by main clone (blue), main clone plus subclone within a single chromosome (green), and subclone (red) by disease entity and stage. P values denote a significant trend of increased or decreased overall frequency of the respective cytogenetic aberration in the PC-AL or PC–non-AL group, respectively. Only P values significant (P ≤ .05) after adjustment for multiple testing are provided. *P value for deletion of 17p refers to a shift in the subclone/main clone ratio along the progression of plasma cell dyscrasia (P = .013 before adjustment; P = .15 after adjustment for multiple testing).
Subclone frequencies specified for individual chromosomes. Frequency of cytogenetic aberrations, sorted by main clone (blue), main clone plus subclone within a single chromosome (green), and subclone (red) by disease entity and stage. P values denote a significant trend of increased or decreased overall frequency of the respective cytogenetic aberration in the PC-AL or PC–non-AL group, respectively. Only P values significant (P ≤ .05) after adjustment for multiple testing are provided. *P value for deletion of 17p refers to a shift in the subclone/main clone ratio along the progression of plasma cell dyscrasia (P = .013 before adjustment; P = .15 after adjustment for multiple testing).
Cluster analysis incorporating main clone and subclone information
When main clone and subclone aberrations were clustered, similar clusters were obtained irrespective of main clone or subclone size (supplemental Figure 2).
Association of clone size with hematologic and clinical parameters
In both the PC-AL and PC–non-AL groups, the median plasma cell content was comparable among subclone-positive and -negative patients (PC-AL group: 12% vs 12%; P = .96; PC–non-AL group: 30% vs 30%; P = .95). Likewise, no individual cytogenetic aberration of subclone size was significantly associated with the bone marrow plasma cell content in PC-AL.
The association of gain of 1q21 with λ light chain restriction was equally visible at the subclone and the main clone levels and in both the PC-AL and PC–non-AL groups (P < .001 and P = .33 for subclone and main clone levels, respectively; P < .001 for both PC-AL and PC–non-AL groups), suggesting an inherent feature of gain of 1q21 independent of clone size and type of plasma cell dyscrasia.
Patients with light chain–only types were less likely to carry subclones (PC-AL: 32% vs 44%; P = .006; PC–non-AL: 36% vs 54%; P = .01). Possibly, the subclonal imbalance of intact immunoglobulin vs light chain–only types is a mere reflection of the low propensitiy of t(11;14) to form subclones and the high propensity of hyperdiploid types to do so.
For the PC-AL group, we also analyzed the association between subclone formation, both overall and for the specific iFISH probes, and organ involvement, including heart, kidney, liver, gastrointestinal tract, autonomous and peripheral nerves, and soft tissue. Here, no statistically significant associations were detected (data not shown).
Propensity for subclone formation in different main clone categories
In a next step, we examined the main clone aberrations and their predisposition to give rise to additional subclone aberrations. Both in the PC-AL and PC–non-AL group, t(11;14) as main clone aberration was associated with an overall lower subclone rate (29% vs 49% and 32% vs 55%, respectively; P < .001 for both). In contrast, hyperdiploidy as main clone aberration increased the propensity for subclone formation in the PC-AL group and PC–non-AL group alike (PC-AL: 49% vs 34%; P = .007; PC–non-AL: 60% vs 44%; P < .001). This phenomenon was highly statistically significant when hyperdiploidy according to Wuilleme score was substituted for by at least 1 hyperdiploid probe in main clone size as criterion (P < .01). High-risk main clone aberrations displayed subclone frequencies of 43% vs 34% (P = .06) in PC-AL and 49% vs 53% (P = .38) in PC–non-AL. The types of subclone aberrations in the respective cytogenetic categories are detailed in supplemental Figure 3.
Multivariate analysis on propensity for subclone formation
Finally, we performed a multivariate analysis to identify factors independently associated with subclone occurrence. In PC-AL, t(11;14) as main clone was still significantly associated with a lower subclone likelihood (odds ratio, 0.47; 95% confidence interval, 0.29-0.75; P = .002). The same effect was observed in the PC–non-AL group (P = .03; Figure 3). In contrast, in the PC–non-AL group, a main clone with a hyperdiploid probe led to a higher rate of subclone formation (odds ratio, 1.60; 95% confidence interval, 1.07-2.41; P = .02). The same but less pronounced trend was also found in the PC-AL group, although without statistical significance, probably because of the lower rate of hyperdiploidy in AL amyloidosis. However, high-risk aberration in main clone, stage of plasma cell dyscrasia, type of light chain restriction, and detection of an intact immunoglobulin did not significantly influence subclone formation. The multivariate analysis showed largely overlapping patterns between PC-AL and PC–non-AL in terms of subclone formation. Consequently, PC-AL vs PC–non-AL did not influence subclone likelihood as an independent additional factor. All conclusions remained unchanged when the plasma cell content was incorporated instead of the plasma cell stage as predictor into the multivariate model (supplemental Table 2) or when the dependent variable subclone (yes vs no) was substituted by subclone frequency (0 vs 1 vs ≥ 2; data not shown), or even when a less stringent subclone definition (clonal size less than three quarters of the largest clone and the absolute difference in clonal size at least 20%) was employed.

Multivariate analysis of factors influencing subclone formation. Multivariate analysis of factors influencing subclone formation in a forest plot, both for PC-AL and PC–non-AL separately as well as combined. In both the PC-AL group and PC–non-AL control group, t(11;14) as main clone aberration was associated with decreased subclone formation, whereas hyperdiploidy was associated with increased subclone formation in the PC–non-AL control group. The effects were similar in the PC-AL and non–PC-AL groups, suggesting that subclone formation is an inherent trait of the respective cytogenetic aberrations, irrespective of clinical disease.
Multivariate analysis of factors influencing subclone formation. Multivariate analysis of factors influencing subclone formation in a forest plot, both for PC-AL and PC–non-AL separately as well as combined. In both the PC-AL group and PC–non-AL control group, t(11;14) as main clone aberration was associated with decreased subclone formation, whereas hyperdiploidy was associated with increased subclone formation in the PC–non-AL control group. The effects were similar in the PC-AL and non–PC-AL groups, suggesting that subclone formation is an inherent trait of the respective cytogenetic aberrations, irrespective of clinical disease.
Discussion
In this study, we analyzed the cytogenetic subclone architecture in AL depending on the stage of plasma cell dyscrasia and compared it with an equally subdivided non-AL group for the first time. Obviously, our analysis had to rely entirely on the iFISH technique, because metaphases, which would permit development of ancestral trees,4 are available in plasma cell dyscrasias only at poor detection rates of 15% to 20% and were accordingly not performed in our patient cohort. Therefore, a meticulous quantification of clonal size was paramount for our approach. We achieved this by a magnetic activated cell sorting–based plasma cell purification, an automated analyzing system for iFISH stains, a selection of patients harboring at least 1 characteristic cytogenetic aberration in ≥60% of cells as a reference for clonal size, and a strict and uniformly applied definition of subclone. By this strict and conservative approach, we ensured that subclones counted in this analysis were truly subclones. On the basis of these criteria, our group was recently able to delineate a prognostic effect of subclone formation in intensively first-line–treated MM patients, thus demonstrating the reliability and significance of this approach.23
Our new analysis corroborates the exceptional position of t(11;14) as the hallmark genetic aberration in AL.16,17,21 Its higher frequency in AL was confirmed in this study even after statistically accounting for the different distributions of the plasma cell stages, implying an inherent trait of AL. Translocation t(11;14) is also typically found as a main clone aberration and therefore is presumably at the root of plasma cell tumorigenesis. This study also shows that in AL, t(11;14) is particularly prevalent in the early stages of plasma cell dyscrasia, with frequencies dropping with progression to symptomatic MM. It again appears as a marker of early gammopathy in AL. Markedly, not only does t(11;14) rarely manifest itself as a subclone, it also hinders other subclone aberrations from arising. It might confer stability to the plasma cell clone, impeding the acquisition of additional aberrations and emergence of subclones.
This study shows that the similarities between the cytogenetic landscape of AL amyloidosis and that of MGUS and myeloma are indeed profound. Previous studies have shown that the frequencies of the cytogenetic aberrations differ but that clustering patterns largely overlap. Our study now shows that even the subclone architecture between the different entities is closely related. Firstly, our study shows that the concept of hyperdiploidy vs t(11;14) as the 2 main genetic branches in plasma cell dyscrasias19,34 is equally valid in PC-AL and PC–non-AL. Both t(11;14) and hyperdiploid probes were typically found as main clone aberrations in both PC-AL and PC–non-AL, implying a role as early and initiating events at the root of tumorigenesis. Gain of 1q21 and deletions of 17p13, 8p21, and 13q14, on the contrary, were consistently more frequently detected in subclones, suggesting a role as secondary and progression-related aberrations. Thus, the subclone architecture of plasma cell dyscrasia in AL closely resembles that in myeloma,9,11,35,36 obviously suggesting in-depth common pathogenetic mechanisms. This large overlap was also highlighted in multivariate analysis of sublcone formation, where subclone architecture in PC-AL and PC–non-AL was homogenous, and the entity by itself was not statistically significant. In multivariate analysis, t(11;14) proved the strongest factor in suppressing subclone evolution in both PC-AL and PC–non-AL. t(11;14) remained genetically stable throughout, echoing the stable clonal composition of clones harboring t(11;14) over time in a longitudinal myeloma study.8,37
We conclude that the lower subclone frequency in AL amyloidosis is a reflection of the high t(11;14) frequency, as well as the universal low propensity of t(11;14) for developing genetic subclones, rather than an AL amyloidosis–specific effect.
Interestingly, the progression of plasma cell dyscrasia from MGUS stage to SMM and overt MM went along with a marked overall increase of non-t(11;14) cytogenetic aberrations, as previously reported for MM.5,6,11,37 However, with the exception of deletions of 17p13 and to some extent 13q14, there was no relevant shift from subclones to main clones. This suggests a state of equilibrium in the outgrowth of subclones to main clones and an emergence of new subclones in genetically more complex karyotypes in untreated patients. It could be speculated that deletion of 17p13, with its subsequent loss of TP53, is biologically more far-reaching than other progression-related genetic events, so clonal expansion more quickly entails progression of the plasma cell clone.
In MM and other hematologic malignancies, cytogenetic intraclonal heterogeneity has been demonstrated as an adverse prognostic factor in prospective clinical trials.4,23 However, we think that a sound analysis of the prognostic role of subclones in AL is not feasible yet, given that the prognostic impact of cytogenetic aberrations in this entity strongly depends on cardiac staging and the respective treatment administered.
In conclusion, our study demonstrates that cytogenetic landscape and subclone architecture are universally shared by the different plasma cell dyscrasia entities. t(11;14) and hyperdiploidy as early initiating genetic events are overwhelmingly found as main clones, whereas gain of 1q21 and deletions of 8p21, 13q14, and 17p13 as likely progression-related aberrations are more frequently detected in subclones. Translocation t(11;14) leads to genetically stable plasma cell clones in PC-AL and PC–non-AL, giving rise to fewer subclones and slowing the progression of plasma cell dyscrasia. This finding alleviates concerns regarding chemotherapy-induced clonal selection and subsequent outgrowth of resistant clones in t(11;14)+ AL amyloidosis and further justifies the more cautious approach to chemotherapy in AL amyloidosis often necessitated by the severity of organ involvement. It could also be speculated, given the genetic stability of t(11;14)+ clones, that the observed poor response to bortezomib may continue through second-line treatment and beyond.38
The full-text version of this article contains a data supplement.
Acknowledgments
The authors thank Rita Ziehl for excellent data management.
This work was supported in part by grants from the Dietmar-Hopp Foundation “Heidelberger Konzept zur Optimierung der Diagnostik und Therapie des Multiplen Myeloms” (H.G.) and the German Federal Ministry of Education and Research (A.J. and S.O.S.).
Authorship
Contribution: T.B., M.M., A.K., U.H., A.J., and S.O.S. designed the research; T.B., M.M., K.H., T.D., and U.H. collected the data; T.B., M.M., M.-S.R., J.H., C.K., T.D., C.M.-T., H.G., U.H., and S.O.S. treated the patients included in this study; A.S. and D.H. performed plasma cell enrichment; M.G. and A.J. performed interphase fluorescence in situ hybridization testing; T.H. performed the statistical analysis; T.B., T.H., and S.O.S. wrote the manuscript; and all authors revised the manuscript.
Conflict-of-interest disclosure: H.G. has received research support from Amgen, Bristol-Myers Squibb, Celgene, Chugai, Janssen, Sanofi, Mundipharma, Takeda, and Novartis and speaker honoraria from Celgene, Janssen, Novartis, Chugai, Bristol-Myers Squibb, and ArtTempi and is on advisory boards of Adaptive Biotechnology, Amgen, Bristol-Myers Squibb, Celgene, Janssen, Sanofi, and Takeda. J.H. has received research funding from Sanofi, Novartis, and Celgene as well as honoraria/travel support from Amgen, Bristol-Myers Squibb, Celgene, Janssen, Medtronic, Novartis, and Takeda. The remaining authors declare no competing financial interests.
Correspondence: Stefan O. Schönland, Department of Internal Medicine, Division of Hematology/Oncology, Amyloidosis Center, University of Heidelberg, Im Neuenheimer Feld 410, 69120 Heidelberg, Germany; e-mail: stefan.schoenland@med.uni-heidelberg.de.

