

Key Points
One third of MYC rearrangements in DLBCL occur in a cluster upstream of the MYC coding sequence and are enriched for IGH partners.
Most MYC rearrangements in HGBL-DH patients have non-IG partners.

Abstract
Genomic rearrangements in the MYC locus occur in ∼12% of lymphomas with diffuse large B-cell lymphoma (DLBCL) morphology and are associated with inferior outcome. Previous studies exploring MYC rearrangements have primarily used fluorescence in situ hybridization (FISH) assays to characterize break-apart status but have rarely examined breakpoint location, and in some cases have not examined partner identity. We performed targeted sequencing of MYC, BCL2, BCL6, and the immunoglobulin (IG) loci in 112 tumors with DLBCL morphology harboring MYC rearrangement. We characterized the location of the MYC rearrangement at base pair resolution and identified the partner in 88 cases. We observed a cluster of breakpoints upstream of the MYC coding region and in intron 1 (the “genic cluster”). Genic cluster rearrangements were enriched for translocations involving IGH (80%), whereas nongenic rearrangements occurred mostly downstream of the MYC gene with a variety of partners, including IGL and IGK. Other recurrent partners included BCL6, ZCCHC7, and RFTN1, which has not previously been described as a MYC partner. We compared 2 commercially available FISH break-apart assays for the MYC locus and observed discordant results in 32% of cases examined, including some with MYC-IGL and MYC-IGK rearrangements. In cases of high-grade B-cell lymphoma with MYC and BCL2 and/or BCL6 rearrangement (HGBL-DH), so-called “double-hit” lymphomas, the majority of MYC rearrangements had non-IG partners (65%), with breakpoints outside the genic cluster (72%). In patients with de novo HGBL-DH of DLBCL morphology, MYC-IG rearrangements showed a trend toward inferior time to progression and overall survival compared with MYC–non-IG rearrangements. Our data reveal clinically relevant architecture of MYC rearrangements in lymphomas with DLBCL morphology.
Introduction
Genomic rearrangements in the MYC gene locus were first described through the characterization of the t(8;14)(q24;q32) translocation in Burkitt lymphoma 40 years ago.1-3 MYC acts as a transcription factor regulating pathways including cell proliferation and growth, DNA replication, apoptosis, and differentiation, making it a powerful oncogene upon dysregulation.4 Similar MYC rearrangements, with a wider array of partner regions, have also been shown to occur in ∼12% of lymphomas with diffuse large B-cell lymphoma (DLBCL) morphology, and their presence is associated with inferior outcomes.5-9 In DLBCL-morphology tumors, rearrangements of the MYC locus are reported to occur concurrently with BCL2 and/or BCL6 rearrangements in 8% of cases, almost all of which are of the germinal center B-cell–like (GCB) subtype.7,9-14 These lymphomas have recently been classified as a distinct World Health Organization entity, “high-grade B-cell lymphoma with MYC and BCL2 and/or BCL6 rearrangements” (HGBL-DH),15 and have sufficiently poor prognosis for many centers to recommend dose-intensive chemotherapy regimens.16,17
Although MYC rearrangements are known to have prognostic impact in DLBCL, previous large-scale studies examining their incidence and impact have mostly used break-apart fluorescence in situ hybridization (FISH) assays. These are able to detect the presence or absence of rearrangements but lack the resolution to identify the precise location of MYC breakpoints and require additional assays to identify rearrangement partners. Previous work in Burkitt lymphoma has classified MYC translocations according to recurrent breakpoint patterns, with breaks located in the MYC gene (class I), immediately upstream (class II), distally upstream (class III), or downstream.18 The patterns and relative incidences of these classes in lymphomas with DLBCL morphology have not been examined on a large scale. Currently, it remains unclear whether the location of the MYC break has any significance and whether breakpoint architecture differs between patient subsets (eg, HGBL-DH). Published studies have produced conflicting evidence about whether MYC rearrangement partner impacts patient outcome, with some demonstrating that MYC-immunoglobulin (IG) rearrangements are associated with inferior survival compared with MYC–non-IG rearrangements and other studies showing no association.12-14,19,20 However, the relationship among breakpoint location, MYC partner, and outcome has never been examined. Furthermore, some of these studies have used FISH break-apart assays with narrow gap sizes that have been demonstrated to lack the ability to detect a proportion of MYC locus rearrangements.21,22
In this study, we used a targeted hybrid capture-based assay23 to perform sequencing of the MYC, BCL2, BCL6, and IG (IGH, IGL, and IGK) loci in 112 tumors with DLBCL morphology that harbor MYC rearrangements. Using DNA extracted from routinely available formalin-fixed paraffin-embedded (FFPE) tissue, we characterized MYC rearrangements at base pair (bp) resolution and associated each rearrangement with its partner locus. By performing 2 FISH break-apart assays at the MYC locus, representing a wide-gap design and a narrower MYC-centric design, we were able to compare their sensitivity to detect breaks in the vicinity of MYC. Our data allowed us to identify recurrent patterns of rearrangement in the MYC locus and evaluate the impact of breakpoint architecture and partner identity on patient outcome.
Methods
Cohort selection and DNA extraction
To select cases for inclusion, 1048 biopsies from the BC Cancer lymphoma database were examined that were diagnosed with de novo DLBCL or transformed follicular lymphoma (tFL) with DLBCL morphology and had been assessed for MYC rearrangement status using the Vysis FISH break-apart assay (wide-gap design). Of these, 559 were also assessed with the Dako MYC break-apart assay (narrower MYC-centric design). Biopsies were selected if they were MYC break-apart positive by either assay and had available FFPE tumor tissue for analysis. This yielded a total of 112 cases: 95 with de novo DLBCL and 17 with tFL (Figure 1; Table 1; supplemental Table 1). Although the majority of biopsies emanated from population registry–based cohorts, 7 of the de novo DLBCL biopsies came from tissue microarrays consisting of selected patient cohorts, including 5 from patients who experienced central nervous system relapse. Break-apart assays for BCL2 and BCL6 (Vysis) were also performed for all biopsies. DNA was extracted from the FFPE tumors and used to create libraries for next-generation sequencing (supplemental Methods). Cell-of-origin subtype was assigned using the Lymph2Cx assay24 or the Hans algorithm.25 All patient specimens were collected as part of research projects approved by the University of British Columbia–British Columbia Cancer Agency Research Ethics Board (file H14-02304). This study abided by the Declaration of Helsinki.

Cohort selected for capture sequencing. (A) Biopsies from de novo DLBCL or tFL with DLBCL morphology were selected for inclusion if they were break-apart positive (BA+) at the MYC locus using the Vysis and/or Dako FISH assays. Cases with no available FFPE tissue were excluded, leaving a total of 112 cases. (B) The FISH break-apart (BA) status of the 112 cases are summarized. Cases in red boxes represent those successfully assessed with the Dako assay. ND, not done.
Cohort selected for capture sequencing. (A) Biopsies from de novo DLBCL or tFL with DLBCL morphology were selected for inclusion if they were break-apart positive (BA+) at the MYC locus using the Vysis and/or Dako FISH assays. Cases with no available FFPE tissue were excluded, leaving a total of 112 cases. (B) The FISH break-apart (BA) status of the 112 cases are summarized. Cases in red boxes represent those successfully assessed with the Dako assay. ND, not done.
Baseline patient and first-line treatment characteristics of the entire cohort
| Characteristic | de novo DLBCL (N = 95) | tFL (N = 17) | ||||
|---|---|---|---|---|---|---|
| n | % | Missing | n | % | Missing | |
| Male | 66 | 69 | 0 | 10 | 59 | 0 |
| Age >60 y | 62 | 65 | 0 | 9 | 53 | 0 |
| Ann Arbor stage III/IV | 56 | 59 | 0 | 12 | 86 | 3 |
| ECOG performance status >1 | 41 | 43 | 0 | 7 | 50 | 3 |
| Elevated LDH | 56 | 64 | 7 | 9 | 60 | 2 |
| Extranodal sites (any) | 60 | 63 | 0 | 10 | 77 | 4 |
| Extranodal site >1 | 21 | 22 | 0 | 9 | 69 | 4 |
| IPI 0-2 | 43 | 49 | 7 | 6 | 46 | 4 |
| IPI 3 | 17 | 19 | 7 | 3 | 23 | 4 |
| IPI 4-5 | 28 | 32 | 7 | 4 | 31 | 4 |
| CHOP-containing regimen | 86 | 91 | 0 | 14 | 82 | 0 |
| Rituximab given | 90 | 95 | 0 | 11 | 65 | 0 |
| Palliation | 2 | 2 | 0 | 2 | 12 | 0 |
| Intensive regimen* | 7 | 7 | 0 | 1 | 6 | 0 |
Median age for all patients is 64 years (range 28-87). For the de novo DLBCL patients, median duration of follow-up for living patients is 7.5 years (range 1.5-16).
CHOP, cyclophosphamide, doxorubicin, vincristine, and prednisone; ECOG, Eastern Cooperative Oncology Group; IPI, International Prognostic Index; LDH, lactate dehydrogenase.
Regimens included R-CODOX-M/IVAC (rituximab with cyclophosphamide, vincristine, doxorubicin, and high-dose methotrexate/ifosfamide, etoposide, and high-dose cytarabine), GDP (gemcitabine, dexamethasone, and cisplatin), and DA-EPOCH-R (dose-adjusted etoposide, prednisone, vincristine, cyclophosphamide, and doxorubicin with rituximab).
Targeted sequencing and structural variant detection
Prior to sequencing, a custom Agilent SureSelect hybrid capture assay was used to enrich for DNA in the regions of interest (supplemental Table 2). Regions for capture were chosen based on published literature and aimed to encompass all reported chromosomal breakpoints at the loci of interest.26-34 The total size of the target space was 7.8 Mb.
Libraries were pooled, and capture enrichment was performed, followed by sequencing on an Illumina HiSeq 2500 (v4 chemistry, 125 bp paired-end reads). Eleven cases had a second round of library construction and sequencing completed to further investigate breakpoints not yet identified in the MYC region, yielding 123 total libraries. To achieve ∼200× average depth of coverage in the captured regions, 57 of the libraries were sequenced on 3 lanes, and the remaining 66 were sequenced on 1 lane (supplemental Figure 1).
Reads were aligned to the GRCh37 reference genome using BWA-MEM (v0.7.5a),35 and predicted structural variants (SVs) were identified using the deStruct (v0.2.1; https://bitbucket.org/dranew/destruct) and DELLY (v0.5.5)36 tools in an ensemble approach (see supplemental Methods for details). Additional putative rearrangements were identified by manual inspection in IGV37 of the MYC gene and surrounding region.
PCR-based SV validation
A subset of 70 cases with available remaining high-quality DNA was selected for SV validation. Validation was attempted for all predicted rearrangements in the MYC, BCL2, and BCL6 regions in these cases. Each rearrangement had 3 sets of polymerase chain reaction (PCR) primers designed to amplify the fusion breakpoint and each of the 2 wild-type corresponding regions. The PCR-amplified fragments were generated using 35 cycles of PCR, followed by a second PCR reaction of 6 cycles to introduce Illumina sequencing adapters. Amplicons were pooled and sequenced on an Illumina MiSeq (250 bp paired-end reads). Sequenced reads were aligned to the putative fusion sequences, and reads mapping across a breakpoint were aligned to the hg19 reference with BLAT to verify exact breakpoint locations and identify any inserted sequence. Fusion sequences with no reads aligned to them were considered failed validations.
Whole-genome sequencing of DLBCL-derived cell lines
Genomic libraries were prepared for 19 DLBCL cell lines (supplemental Table 3) and sequenced on an Illumina HiSeq 2000 (paired-end 100 bp reads) or HiSeq X (paired-end 150-bp reads) platform (some previously described38 ; see supplemental Methods). Reads were aligned to the GRCh37 reference using BWA-MEM (v0.7.5a),35 and SVs in the MYC, BCL2, and BCL6 regions were identified using DELLY (v0.5.5).36
Outcome analysis
We used descriptive statistics to summarize the baseline characteristics of all patients (Table 1). Survival analysis was performed on (1) all patients with de novo DLBCL treated with R-CHOP chemotherapy (rituximab with cyclophosphamide, doxorubicin, vincristine, and prednisone) and (2) as above, but limited to patients representative of a population-based registry, excluding the patients from selected cohorts. Time to progression (TTP) was defined as the time from date of diagnosis to disease progression, relapse, or death related to lymphoma or its treatment. The Kaplan-Meier method was used to estimate overall survival (OS) and TTP, and log-rank tests were performed to compare risk between groups. Three-year estimates with 95% confidence intervals were calculated. Statistical analysis was performed using STATA/IC statistical software (v13; StataCorp).
Results
FISH break-apart assays identify a cohort of 112 cases
We used 2 MYC break-apart FISH designs: the Vysis assay, which has probes that bind across a large gap (∼1.6 Mb) that includes the MYC gene, and the Dako assay, which has a smaller gap (∼90 kb) centered around MYC. In total, we examined 112 biopsies that harbored rearrangement of the MYC locus using Vysis and/or Dako assays (Figure 1). The Vysis assay was performed on all 112 biopsies and was evaluable in 100 cases. The Dako assay was performed on 95 of the biopsies and was evaluable in 93 cases. Of the 81 cases with interpretable results for both MYC break-apart assays, 55 were positive by both, whereas 26 (32%) were positive by Vysis and negative by Dako. BCL2 and BCL6 break-apart FISH assays were attempted on all biopsies and were successful in 106 and 109 cases, respectively (supplemental Figure 2). Of 107 biopsies in which double-hit status was evaluable by FISH (ie, break-apart positive for BCL2 and/or BCL6 or negative for both), 75 (70%) were classified as HGBL-DH, with 49 of these harboring a BCL2 rearrangement (65%), 11 harboring a BCL6 rearrangement (15%), and 15 (20%) harboring both BCL2 and BCL6 rearrangements in addition to the MYC rearrangement (“triple-hit” cases).
Capture sequencing results are highly concordant with FISH assays
The capture sequencing and SV detection pipeline was able to identify rearrangements closely matching the observed FISH break-apart results (supplemental Table 4). Of the 112 cases, 93 (83%) had a predicted MYC rearrangement (translocation or large intrachromosomal SV) that matched the observed FISH pattern. Predicted BCL2 and BCL6 rearrangements were found with capture in 95% (61/64) and 69% (18/26) of FISH break-apart–positive cases, respectively.
Prior to validation, predictions were classified as high, moderate, or low confidence based on the number of tools that identified them and their read support (supplemental Methods). Of the 70 cases for which SV validation was attempted, 61 had predicted MYC rearrangements. Fifty-four of these (89%) validated, and the exact breakpoint locations and the sequence of any inserted DNA were identified (supplemental Table 4). Of the 7 cases for which the MYC rearrangements were not validated, 4 did not produce conclusive results: 1 had very few sequenced reads in the validation assay (∼3000 total vs median ∼440 000) and likely failed to amplify the fusion as a result of the low amount of input DNA, and 3 showed no amplification of 1 or both “wild-type” alleles, indicating PCR priming failure or inadequate DNA quality. The remaining 3 cases did not validate for unknown reasons, and we consider these to be artifactual predictions (2 low confidence, 1 moderate confidence). Thirty-seven validation cases had a predicted BCL2 rearrangement, and 100% of these validated. Of 13 cases with BCL6 rearrangements, 92% (12/13) were validated; the 1 failed case likely represented a PCR failure.
Of the cases with conclusive validation results, 49 had a moderate- or high-confidence MYC prediction, and 98% of these (48/49) successfully validated. In the cases in which MYC validation was inconclusive or not attempted, 94% (34/36) also had moderate- or high-confidence predictions, suggesting that the vast majority of MYC rearrangements in the nonvalidated cases are likely true positives. The 2 low-confidence predictions in these cases were omitted in downstream analyses.
Recurrent rearrangement breakpoint patterns in the MYC locus
In total, we identified 105 validated or high/moderate-confidence MYC rearrangements in 88 cases, including 93 translocations and 12 large (>2 Mb) intrachromosomal rearrangements (Figure 2). The large number of breakpoints identified with the capture sequencing approach allowed us to observe recurrent patterns in rearrangement anatomy. Many of the MYC breakpoints (35/105; 33%) occur in a cluster in close proximity to the MYC coding sequence, which we define here as the “genic cluster,” spanning from ∼1.5 kb upstream of the transcription start site to the end of MYC intron 1 (∼3.7 kb total). This cluster encompasses the class I and class II MYC translocations previously defined in Burkitt lymphoma.18 The remaining breakpoints are located outside the gene region, with 27% (19/70) occurring upstream of MYC in a space that includes previously defined class III MYC translocations.18 However, the majority of nongenic rearrangements occur telomeric to the genic cluster (51/70; 73%) up to 0.6 Mb downstream of MYC.
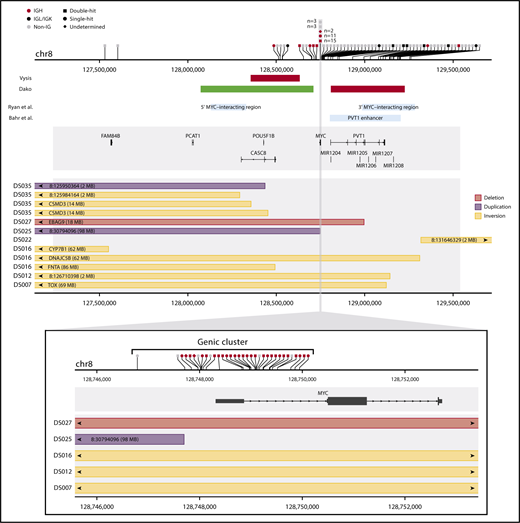
SVs in the MYC locus discovered by targeted capture sequencing. The horizontal axis represents genomic space on chromosome 8 (chr8). The upper panel summarizes the whole MYC capture region, and the bottom panel zooms in to the gene region. In each panel, the top track shows the location of translocation breakpoints (vertical ticks on the axis), and partner information is summarized with symbols above. The middle track shows gene models in the region. The bottom track shows the location of intrachromosomal rearrangements, with rectangles representing the span of the rearrangements. Arrows indicate that the end of the rearrangement is located outside of the plotting region at the labeled location. In the upper panel, rearrangements in the genic cluster have been binned for visualization. Additional middle tracks in the upper panel show the approximate location of reported enhancer regions (blue boxes) and the approximate binding location of FISH break-apart probes (green Vysis probe binds downstream of the plotted region). The shaded gray rectangle shows the captured region. Rearrangements that failed validation and low-confidence predictions in nonvalidated cases have been omitted. Intrachromosomal rearrangements smaller than 2 Mb have not been plotted, and rearrangements for which both reciprocal events were identified have only 1 displayed.
SVs in the MYC locus discovered by targeted capture sequencing. The horizontal axis represents genomic space on chromosome 8 (chr8). The upper panel summarizes the whole MYC capture region, and the bottom panel zooms in to the gene region. In each panel, the top track shows the location of translocation breakpoints (vertical ticks on the axis), and partner information is summarized with symbols above. The middle track shows gene models in the region. The bottom track shows the location of intrachromosomal rearrangements, with rectangles representing the span of the rearrangements. Arrows indicate that the end of the rearrangement is located outside of the plotting region at the labeled location. In the upper panel, rearrangements in the genic cluster have been binned for visualization. Additional middle tracks in the upper panel show the approximate location of reported enhancer regions (blue boxes) and the approximate binding location of FISH break-apart probes (green Vysis probe binds downstream of the plotted region). The shaded gray rectangle shows the captured region. Rearrangements that failed validation and low-confidence predictions in nonvalidated cases have been omitted. Intrachromosomal rearrangements smaller than 2 Mb have not been plotted, and rearrangements for which both reciprocal events were identified have only 1 displayed.
Breakpoints in the genic cluster are significantly enriched for IGH partners (28/35; 80%), whereas those outside of the genic cluster are enriched for non-IGH rearrangements (63/70; 90%) (Table 2; χ2P < .0001). Nongenic rearrangements are highly variable with respect to partners, with recurrent partners including the other IG genes (IGL and IGK) and previously described partner loci BCL6 and ZCCHC7/PAX5 (Figure 3).32 In addition, a novel recurrent partner, RFTN1, was identified in 4 cases. This gene encodes the RFTN1 protein, a lipid raft linker, and all breakpoints observed in the RFTN1 gene occur in intron 1 or intron 2 (supplemental Figure 3). Rearrangements in the known single-hit cases were 50% MYC-IG (17/34), and 41% (14/34) occurred in the genic cluster. In contrast, the majority of MYC rearrangements in HGBL-DH cases had non-IG partners (45/69; 65%), with the majority of breakpoints outside the genic cluster (50/69; 72%). A similar trend was seen in patients with GCB-DLBCL; 65% (46/71) of MYC rearrangements had non-IG partners, and 70% (50/71) occurred outside the genic cluster. The location of rearrangements with IGH and IGL/IGK partners showed a similar pattern to what has been reported in Burkitt lymphoma, suggesting a common mechanism and developmental stage at which these rearrangements arise (supplemental Figure 4).28,39,40
Summary of rearrangement partners identified in the MYC region using capture sequencing
| Total breakpoints | IGH partner | IGK/IGL partner | Non-IG partner | |
|---|---|---|---|---|
| Genic cluster | 35 | 28 (80) | 0 (0) | 7 (20) |
| Other | 70 | 7 (10) | 8 (11) | 55 (79) |
| Single-hit | 34 | 14 (41) | 3 (9) | 17 (50) |
| HGBL-DH | 69 | 19 (28) | 5 (7) | 45 (65) |
| GCB | 71 | 19 (27) | 6 (8) | 46 (65) |
| ABC/non-GCB | 25 | 11 (44) | 2 (8) | 12 (48) |
Total counts of rearrangements are shown with percentages in parentheses. Counts include translocations and large intrachromosomal rearrangements (>2 Mb). Rearrangements that failed validation and low-confidence predictions in nonvalidated cases have been omitted.
ABC, activated B-cell–like DLBCL.
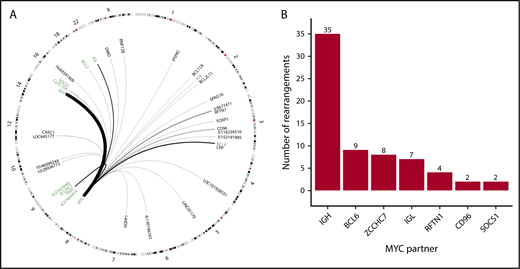
Identity and location of MYC rearrangement partners throughout the genome. (A) Circos plot showing identified rearrangement partners of MYC. Black arches represent translocations with thickness representing recurrence. Chromosomes with no identified partners are not drawn. Regions included in the capture space are labeled in green. (B) Absolute frequency of recurrent MYC rearrangement partners.
Identity and location of MYC rearrangement partners throughout the genome. (A) Circos plot showing identified rearrangement partners of MYC. Black arches represent translocations with thickness representing recurrence. Chromosomes with no identified partners are not drawn. Regions included in the capture space are labeled in green. (B) Absolute frequency of recurrent MYC rearrangement partners.
FISH break-apart status at the MYC locus is variable between FISH assays
Break-apart MYC FISH assays were interpretable using Vysis and Dako probes in 81 of the 112 cases, allowing us to compare the patterns observed with the 2 assays. In total, 32% (26/81) of cases were negative when hybridized with the Dako probe (supplemental Table 5) and positive by Vysis. Because of the probe design, most of the cases found to have a genic breakpoint were Dako break-apart positive (26/27; 96%), whereas 43% (20/46) of cases with nongenic breakpoints did not produce a break-apart signal using the Dako assay. In some cases, we were able to further determine whether an MYC-IGH rearrangement was present using a dual fusion FISH assay when capture did not identify a rearrangement (supplemental Methods; supplemental Table 1). With these data included, the Dako break-apart–negative cases had primarily MYC–non-IGH rearrangements (20/24; 83%), and 3 of these had an IGL or IGK partner. These findings are consistent with previous reports suggesting that the narrower MYC-centric Dako assay fails to detect a significant proportion of rearrangements in the MYC locus.21,22 The large sample size and exact breakpoint locations elucidated in this study allowed us to more accurately describe the location where MYC-locus rearrangements were too far downstream from the coding space to be detectable with the Dako assay (Figure 4).
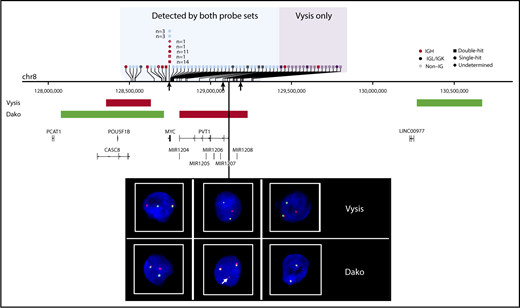
Sensitivity of rearrangement detection at the MYC locus with Vysis and Dako FISH probes. The horizontal axis represents genomic space on chromosome 8 (chr8). Translocations are represented by vertical ticks along the axis, with symbols describing the rearrangement partner labeled above. White crosses denote cases that were MYC break-apart positive by Dako only (ie, Vysis failed). The shaded blue region represents the space where rearrangements can be detected by both assays, and the shaded purple region shows where only Vysis can detect rearrangements. The approximate location of FISH binding probes is shown on the middle track. Representative FISH images show observed patterns: cases in the blue region produce a fusion signal and a break-apart signal in both assays (left); cases with breakpoints that lie within the Dako red probe binding region produce 2 fusion signals and a small additional red signal, as indicated by the white arrow (center); and cases in the purple region produce a break-apart signal with Vysis and 2 fusion signals with Dako (right). Breakpoints corresponding to the FISH images are indicated by black arrows under the chromosome track.
Sensitivity of rearrangement detection at the MYC locus with Vysis and Dako FISH probes. The horizontal axis represents genomic space on chromosome 8 (chr8). Translocations are represented by vertical ticks along the axis, with symbols describing the rearrangement partner labeled above. White crosses denote cases that were MYC break-apart positive by Dako only (ie, Vysis failed). The shaded blue region represents the space where rearrangements can be detected by both assays, and the shaded purple region shows where only Vysis can detect rearrangements. The approximate location of FISH binding probes is shown on the middle track. Representative FISH images show observed patterns: cases in the blue region produce a fusion signal and a break-apart signal in both assays (left); cases with breakpoints that lie within the Dako red probe binding region produce 2 fusion signals and a small additional red signal, as indicated by the white arrow (center); and cases in the purple region produce a break-apart signal with Vysis and 2 fusion signals with Dako (right). Breakpoints corresponding to the FISH images are indicated by black arrows under the chromosome track.
Recurrent rearrangement patterns in the IGH, BCL2, and BCL6 loci
In addition to the MYC locus, other loci in the capture space showed recurrent patterns with respect to breakpoint anatomy. Most BCL2 breakpoints with IGH partners were located in the 3′ untranslated region and downstream of the BCL2 gene, a region containing the previously designated major breakpoint region, minor cluster region, and intermediate cluster region (supplemental Figure 5).34 We identified additional breakpoints at the 5′ end of BCL2 (4 upstream, 1 in the 5′ untranslated region, and 1 in intron 2) in the known variant cluster region with partners including IGH, MYC, and IGK.41,42 In the BCL6 region, 52% of the breakpoints (12/23) occurred in the major breakpoint region comprising exon 1 and intron 1 (supplemental Figure 6).27 However, the remaining breakpoints were not localized to the alternative breakpoint region (245-285 kb 5′ of the gene) and were instead distributed throughout the region spanning from the 5′ end of BCL6 to ∼225 kb upstream (telomeric), including some in reported enhancer elements.43,44 This suggests that additional breakpoints outside the major and alternative breakpoint regions are frequent in B-cell lymphomas with DLBCL morphology. Because many of these breakpoints occur in a space not captured with our design, it is possible that additional breakpoints exist that have not been identified. Recurrent patterns were also observed in the IGH locus (Figure 5). Rearrangements with BCL2 occurred primarily in the D and J segments, whereas those with MYC occurred most often in switch regions upstream of constant segments.45,46 In BCL2-IGH rearrangements for which both reciprocal translocations were identified, the 2 IGH breakpoints always occurred in different IGH locations, with 1 in the D region and the other in the J region. Breakpoints with BCL6 partners, similar to MYC, occur in IGH constant switch regions.
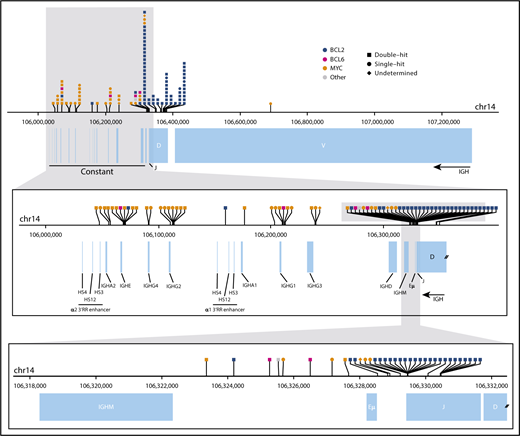
Translocation breakpoints in the IGH locus. The horizontal axis represents genomic space on chromosome 14 (chr14). The top panel shows the full IGH locus, the middle panel shows an enlargement of the constant region, and the bottom panel shows the smaller region surrounding the end of the variable diversity joining genes. In each panel, the top track indicates the location of translocation breakpoints (vertical tick marks), with symbols describing the identity of the partner region labeled above. Breakpoints shown on the uppermost panel have been binned for visualization. Annotations of the variable diversity joining segments, constant regions, and enhancer elements (Eµ and 3′RR) are depicted below.
Translocation breakpoints in the IGH locus. The horizontal axis represents genomic space on chromosome 14 (chr14). The top panel shows the full IGH locus, the middle panel shows an enlargement of the constant region, and the bottom panel shows the smaller region surrounding the end of the variable diversity joining genes. In each panel, the top track indicates the location of translocation breakpoints (vertical tick marks), with symbols describing the identity of the partner region labeled above. Breakpoints shown on the uppermost panel have been binned for visualization. Annotations of the variable diversity joining segments, constant regions, and enhancer elements (Eµ and 3′RR) are depicted below.
DLBCL cell lines show patterns similar to patient samples
To further investigate rearrangement patterns, we also examined the MYC, BCL2, and BCL6 loci for rearrangements in 19 DLBCL-derived cell lines (supplemental Tables 6 and 7). Using genome sequencing, we identified a MYC rearrangement in 12 of the cell lines (supplemental Figure 7). The patterns of rearrangement in the cell lines were consistent with those observed in primary patients, with a cluster of MYC-IGH rearrangements in the genic region and non-IGH partners distributed throughout the locus, predominantly downstream of the gene. The observed partner genes were also consistent and included BCL6, ZCCHC7, and IGL. Interestingly, NU-DHL-1 was confirmed to harbor an MYC-RFTN1 rearrangement (previously published as PVT1-RFTN138 ). DLBCL cell line rearrangements in the BCL2, BCL6, and IGH loci showed patterns similar to primary patients with respect to breakpoint location and partner identity (supplemental Figures 8-10).
Identity of the MYC rearrangement partner impacts prognosis
To investigate whether the MYC rearrangement partner impacts patient prognosis, we used the Kaplan-Meier method to estimate TTP and OS in patients with de novo DLBCL treated with first-line R-CHOP. Genic breakpoint status did not confer inferior survival in comparison with nongenic breakpoints. Consistent with previous reports,12,13 we observed a nonsignificant trend toward inferior outcome in all patients harboring MYC-IG rearrangements compared with those with MYC–non-IG rearrangements (supplemental Figure 11). In the subgroup of HGBL-DH patients with BCL2 rearrangement, a similar trend was observed, with MYC-IG cases showing inferior TTP (P = .12) and OS (P = .09). The same observations held true when considering only patients representative of a population-based registry (ie, excluding patients from selected cohorts) (supplemental Figure 11).
Discussion
In this study, we have performed the first large-scale characterization of MYC rearrangement architecture in lymphomas with DLBCL morphology. The nucleotide-level resolution of our sequencing assay allowed for the identification of recurrent rearrangement patterns that were not previously appreciated. Furthermore, we compared the sensitivity of 2 routinely available FISH assays and verified associations between MYC rearrangement partner and patient outcome.
We identified a genic cluster of MYC breakpoints located near the 5′ end of the coding sequence, which is highly enriched for MYC-IGH rearrangements, and demonstrated that most nongenic MYC rearrangements have non-IG partners and occur downstream of the gene. All downstream breakpoints identified are located within a region ∼565 kb telomeric of the coding space, which has been demonstrated to be enriched for enhancer elements.43,47 In conjunction with a previous study demonstrating that MYC rearrangements frequently occur within acetylated enhancer regions in B-cell lymphomas, the location of our mapped breakpoints may suggest that these rearrangements occur within enhancers in this region.43 Future experiments investigating acetylation status in both the MYC region and the numerous partner regions discovered here may provide insight into this potential mechanism. Interestingly, another known superenhancer region 1.7 Mb downstream of the MYC gene is not captured in our targeted sequencing assay.47 It is possible that some rearrangements have breakpoints in this region that are missed by our current design, and this may account for discrepancies between FISH and the capture results that can be improved in future experiments. We also identified numerous novel MYC rearrangement partners, including RFTN1, recurrently seen in 4 patient samples and the GCB-DLBCL cell line NU-DHL-1. This gene is known to be involved in B-cell receptor signal transduction.48 All breakpoints observed occurred in intron 1 or 2 (supplemental Figure 3), and further investigation is required to determine whether these rearrangements impact RFTN1 messenger RNA or protein expression, as well as how this may functionally impact tumor cells. Analysis of 19 DLBCL-derived cell line genomes ;found 12 cell lines harboring MYC rearrangements, including 9 HGBL-DHs (supplemental Table 7). Because the cell lines showed patterns similar to primary cases with respect to breakpoint location and partner identity, they appear to faithfully represent the spectrum of observed MYC rearrangements and provide opportunities to functionally study representative patterns in more detail. Interestingly, 9 of the 14 GCB cell lines profiled were HGBL-DHs, and only 1 had a sole MYC translocation, indicating a skew not representative of the general GCB patient population.
Breakpoints in the IGH locus showed highly recurrent patterns with respect to partner regions (Figure 5). The prevalence of BCL2 rearrangements in the variable diversity joining (VDJ) segments of the IGH locus is consistent with their origin during RAG-mediated VDJ recombination in the bone marrow.46 MYC and BCL6 rearrangements occurred primarily in IGH switch regions upstream of constant gene segments, indicating their likely origin during AID-mediated class switch recombination in the germinal center reaction. The mapping of breakpoints allowed us to observe the structure of the derivative chromosomes and location of regulatory enhancer elements resulting from characteristic IGH rearrangements with MYC, BCL2, and BCL6 (supplemental Figure 12). In all 3 characteristic rearrangements, the breakpoint architecture places the partner in close proximity to a highly active IGH enhancer element (Eµ or 3′RR), suggesting a classical mechanism of oncogene overexpression.
Consistent with previous reports, we observed underdetection of MYC break-apart–positive cases when using the Dako FISH assay (supplemental Table 5).21,22 MYC-centric FISH assays like Dako are effective at identifying genic breakpoints and, therefore, are biased toward finding MYC-IG rearrangements and missing MYC–non-IG rearrangements. The majority of cases with MYC-non-IG rearrangements are HGBL-DH (83%; 38/46), suggesting that the wider-gap Vysis probe has higher sensitivity for identifying these cases. This is particularly important because these cases now constitute a distinct World Health Organization entity, and routine MYC break-apart testing will require an assay that can reliably classify these patients. In our comparison of HGBL-DH patients with R-CHOP–treated de novo DLBCL, we confirmed a trend toward inferior survival in cases harboring MYC-IG rearrangements compared with those with MYC–non-IG rearrangements.12,13 However, the small size of this subset resulted in the trend being nonsignificant. Because our study used the Vysis probe design, we identified additional cases with both MYC-IG and MYC–non-IG rearrangements that would have likely been omitted in previous studies that used the Dako design.12,13 A potential limitation to our outcome analysis is that our cohort contains some cases identified in an era in which FISH assays were performed on the basis of defined patient or tumor characteristics and others for which FISH was applied to all tumors. Our findings will need to be further confirmed in large population-based studies in which FISH is applied to all biopsies.
Although our capture sequencing assay provides resolution not possible with FISH, it still has limitations. In 24 cases (21%), no MYC rearrangement was identified with sequencing that explained the observed FISH pattern. These discrepancies may be the result of technical issues (eg, degradation of FFPE DNA, breakpoints in low-coverage repetitive regions) or biological variability (eg, tumor heterogeneity). It is also likely that our design does not encompass all breakpoints that occur in the loci of interest. This is most evident at the BCL6 locus: the design used here, which covers the major and alternative breakpoint regions, did not include 35% (8/23) of the identified BCL6 breakpoints (supplemental Figure 6). In future experiments, an improved capture design may allow us to identify a higher proportion of rearrangements. Targeted sequencing may also be unable to characterize complex genetic rearrangements as a result of the inability of short reads to sequence across large regions. Some cases investigated had >50 predicted high-confidence rearrangements, including overlapping inversions, duplications, and deletions, and these numerous predictions may be the result of mapping difficulty in highly altered regions. Other cases had multiple rearrangements in the same locus (eg, MYC-IGH and BCL2-IGH), but our current method is unable to determine whether these occur on the same or alternate alleles, making it difficult to discern the sequence and potential mechanisms that give rise to these translocations. For these applications, long- or linked-read sequencing may improve upon the rearrangement detection pipeline.
This study provides a large-scale description of MYC rearrangements in B-cell lymphomas with DLBCL morphology at a resolution not previously attainable with conventional FISH methods. Our findings suggest that, given the heterogeneity of the rearrangements we characterized, future research and clinical trials may benefit from the use of both a wide-gap FISH assay and capture sequencing to stratify patients into subsets based on breakpoint location and partner. We anticipate that unresolved questions about the relationship between MYC rearrangement architecture and outcome can only be answered when larger numbers of patients are characterized. Further, examination in cohorts that have been treated with different therapeutic regimens is required to determine the clinical utility of assessing MYC rearrangement status and architecture. This work represents an important step toward understanding MYC rearrangements and their impact on patient outcomes, as well as designing effective strategies for detection in patient populations.
The full-text version of this article contains a data supplement.
Acknowledgments
The authors thank Doug Horsman for his contributions to cytogenetics at BC Cancer. They also thank Felix Breden (Simon Fraser University) and Corey Watson (University of Louisville) for sharing their knowledge regarding the IGH locus. The authors thank and acknowledge staff at Canada’s Michael Smith Genome Sciences Centre for the generation of discovery and validation sequencing datasets and acknowledge the team at the molecular cytogenetics laboratory, Institute of Human Genetics, Ulm University.
This work was supported by the Canadian Cancer Society Research Institute (704848, 705288), Genome Canada (4108), Genome British Columbia (171LYM), the Canadian Institutes of Health Research (GPH-129347), the Terry Fox Research Institute (1061), and the BC Cancer Foundation. A.M. was supported by fellowship awards from the Mildred Scheel Cancer Foundation (German Cancer Aid), the Michael Smith Foundation for Health Research, and Lymphoma Canada. R.S. is supported by the e:Med programme (Bundesministerium für Bildung und Forschung, FKZ 031A428H). C.S. is supported by a Michael Smith Foundation for Health Research career investigator award (5120).
Authorship
Contribution: L.C.C., S.B.-N., R.D.G., J.M.C., A.J.M., C.S., and D.W.S. designed the project; C.F., A.S.G., D.V., K.J.S., L.H.S., R.D.G., J.M.C., and D.W.S. collected patient data; G.W.S. and P.F. performed pathology; S.B.-N., D.E., A.M., B.C., P.A., R.K., and R.S. performed FISH analyses; S.B.-N., G.W.S., C.S., and D.W.S. performed cohort selection; S.B.-N., A.M., M.B., and B.M. performed nucleic acid extraction; M.A.M. and A.J.M. designed and performed the capture sequencing, whole-genome sequencing, and validation protocols; L.C.C. and R.D.M. performed sequencing and bioinformatics analysis; C.F. performed outcome analysis; L.C.C. wrote the manuscript; and all authors edited and approved the manuscript.
Conflict-of-interest disclosure: C.F. receives research funding from Roche/Genentech and honoraria from AbbVie, Seattle Genetics, and Roche/Genentech. The remaining authors declare no competing financial interests.
Correspondence: David W. Scott, Centre for Lymphoid Cancer, BC Cancer, 675 West 10th Ave, Vancouver, BC V5Z 1L3, Canada; e-mail: dscott8@bccancer.bc.ca; and Christian Steidl, Centre for Lymphoid Cancer, BC Cancer, 675 West 10th Ave, Vancouver, BC V5Z 1L3, Canada; e-mail: csteidl@bccancer.bc.ca.

