

Key Points
Mutant TP53 and ≥4 mutations predict dismal outcomes with current therapeutic options in patients with accelerated/blast phase of MPNs.
The benefit of intensive therapy is only seen in patients who are able to undergo transplant.

Abstract
There is a paucity of data regarding the impact of mutations on outcomes in accelerated-phase (AP) and blast-phase (BP) myeloproliferative neoplasms (MPNs). Moreover, it is unknown whether mutational status affects survival, as seen in chronic-phase MPNs. Therefore, we performed a retrospective analysis of all patients treated at our institution with AP/BP MPNs (N = 122; AP = 14; BP = 108) to comprehensively describe the mutational profile and correlate with clinical outcomes. Targeted sequencing with a 54-gene panel was performed. Forty-four patients were treated with intensive therapy, 27 with nonintensive therapy, and 51 with best supportive care (BSC). The most common mutation was JAK2V617F, occurring in 55% of subjects; CALR was found in 13% of patients and MPL in 6%. Thirty-two (26%) patients were triple negative. Other frequently mutated genes were ASXL1 (30%), TET2 (25%), SRSF2 (22%), RUNX1 (20%), and TP53 (17%). Mutations in 1, 2, 3, and ≥4 genes were seen in 15%, 13%, 25%, and 46% of patients, respectively. There was no difference in survival between patients treated with intensive vs nonintensive therapy, and the benefit of intensive therapy was limited to patients who were able to undergo transplantation. TP53 was the only individual mutation to correlate with shorter overall survival (hazard ratio, 1.89; P = .03). In the multivariate analysis, mutated TP53, ≥4 mutations, low albumin, increased peripheral blood blasts, ≥3 cytogenetic abnormalities, and BSC were associated with shorter survival. In conclusion, mutational data enhance the understanding of patients with AP/BP MPN who are likely to benefit from current therapeutic options.
Introduction
Improving the outcomes of patients with accelerated-phase (AP) and blast-phase (BP) Philadelphia-negative myeloproliferative neoplasms (MPNs) is an area of unmet clinical need.1-4 Several small studies have focused on the genetic mechanisms and pathogenesis of leukemic transformation and demonstrate a distinct difference in the mutational profile of post-MPN verses de novo acute myeloid leukemia (AML). Namely, mutations in FLT3 and NPM1 were rarely seen in AML secondary to MPNs, while TET2, SRSF2, IDH1, IDH2, and ASXL1 were frequently mutated.5,6 Despite the distinct mutational profile of BP MPN, the impact of genomic alternations on clinical outcomes remains largely unknown. Zhang and colleagues studied 53 patients with AML secondary to MPN and performed targeted sequencing of 22 genes, including JAK2 and MPL.5 In univariate analyses, mutations in SRSF2, but not JAK2, ASXL1, or TET2, conferred an adverse prognosis. This study predated the discovery of mutations in the calreticulin (CALR) gene. More recently, the leukemic cells of 75 patients in BP MPN were sequenced using a 33-gene panel.7 Mutations in RUNX1 and PTPN11 were associated with a shorter overall survival (OS).
Research in chronic-phase (CP) MPNs reveals that phenotypic driver mutations affecting the JAK-STAT pathway are associated with differences in clinical characteristics and outcomes.8-11 In patients with primary myelofibrosis, CALR mutation was associated with the longest survival (median OS, 17.7 years) compared with triple-negative patients who had the shortest survival of 3.2 years.9 However, the favorable prognostic effect of CALR is only seen with type 1/type 1–like mutations.12,13 It is unknown whether mutations of the JAK-STAT pathway impact clinical outcomes at the time of leukemic transformation, as the limited number of patients with CALR mutations in a previous study precluded adequate assessment,14 and a second study did not show any difference in survival.7
The value of intensive chemotherapy in the absence of hematopoietic cell transplant (HCT) for MPNs in AP/BP is limited.2,3 Better characterization of the mutational landscape may help in understanding the utility of currently available therapeutic options and future development of novel treatment approaches. We hypothesized that differences may exist in the baseline characteristics and outcomes between different subgroups based on their mutational profile at the time of transformation. Therefore, we retrospectively performed targeted sequencing on a cohort of MPN patients in AP/BP with the aim to comprehensively describe the mutational spectrum and correlate molecular profile with baseline clinical features and outcomes.
Methods
Patients
All patients with Philadelphia-negative MPNs in AP/BP and assessed at Princess Margaret Cancer Centre between January 1998 and April 2017 were identified by cross-referencing the MPN and leukemia databases. Pertinent clinical data were obtained in a specific case report form by chart review. The University Health Network Research Ethics Board approved the study. All patients provided written informed consent for collection of their peripheral blood (PB) or bone marrow samples as part of the University Health Network Hematologic Malignancy Tissue Bank. For inclusion in the study, participants required (1) a confirmed diagnosis of Philadelphia-negative MPN including essential thrombocythemia, polycythemia vera, primary myelofibrosis, post–essential thrombocythemia myelofibrosis, post–polycythemia vera myelofibrosis, or MPN-unclassifiable; (2) evidence of transformation to AP (10% to 19% blasts in the PB or bone marrow) or BP (≥20% blasts in the PB or bone marrow, or biopsy proven granulocytic sarcoma); and (3) an available sample for molecular analysis. Clinical outcomes of 47 patients included in the study cohort were previously published.2
Definitions
Intensive therapy was defined as induction chemotherapy with a plan for HCT in remission or after reversion to CP MPN. Nonintensive therapy included treatment with hypomethylating agent, low-dose subcutaneous cytarabine, or treatment as part of a clinical trial. Best supportive care (BSC) was defined as transfusional support and/or hydroxyurea with the aim of controlling leukocyte and/or blast count. Induction chemotherapy regimens consisted of (1) 3+7 (daunorubicin 60 mg/m2 IV bolus days 1 to 3 with cytarabine 200 mg/m2 per day [100 mg/m2 per day if age ≥60 years], continuous infusion on days 1 to 7); (2) FLAG-IDA (fludarabine 30 mg/m2 IV for 5 days, cytarabine 2000 mg/m2 IV for 5 days, idarubicin 10 mg/m2 IV push for 3 days, and granulocyte-colony stimulating agent [5 µg/kg per day] subcutaneously for 6 days); and (3) NOVE-HIDAC (mitoxantrone 10 mg/m2 IV for 5 days, etoposide 100 mg/m2 for 5 days, and cytarabine 1500 mg/m2 every 12 hours for 2 days [1000 mg/m2 if ≥60 years]). Response to induction chemotherapy included complete remission (CR), CR with incomplete count recovery, reversion to CP MPN, resistant disease, or induction-related death using criteria previously described.2
Molecular analysis
Targeted sequencing was performed on DNA isolated from PB (n = 94) or bone marrow (n = 28) samples. Analysis was performed using the TruSight Myeloid Sequencing Panel (Illumina, San Diego, CA) on the MiSeq platform (Illumina), as previously described.15,16 Fifty-four genes were profiled (39 genes tested for hotspot regions and 15 genes tested for complete exonic regions; supplemental Table 1A-B) using amplicon-based library preparation and (2 × 250 bp) paired-end sequencing using 50 ng input DNA. Sequence data were analyzed by the NextGENe (v.2.3.1, SoftGenetics) and MiSeq Reporter (v2.4.60, MSR, Illumina) software packages. Data files from each sample were uploaded into Bench Laboratory NGS v4.2 (Agilent Technologies, Santa Clara, CA) for subsequent filtering to prioritize for reporting those variants that passed all MSR quality criteria, including depth of coverage of at least 100× and a variant allele frequency (VAF) threshold of >15%. Well documented hotspots that were detected at VAF ≤15% were verified by an orthogonal method (Sanger sequencing when VAF was between 10% and 15%, and Droplet Digital polymerase chain reaction when VAF was between 2% and 10%). Variants with a global population minor allele frequency >1% according to population databases (1000 Genomes phase 1 release v3.20101123 and phase 3 release v5.20130502, ESP6500 [Variants in the Exome Sequencing Project ESP6500SI-V2 data set of the exome sequencing project, annotated with SeattleSeqAnnotation 137], Exome Aggregation Consortium, release 0.3, dbSNP build 147) and/or present in the Advanced Molecular Diagnostic Laboratory internal database of recurring variants were excluded. Variants selected for downstream analysis were those with anticipated effect on protein functions and included exonic frameshift and nonsense mutations, splice site variants that were ±2 bp of the intron/exon boundaries within canonical splice sites, missense variants, and in-frame insertions/deletions. Variants classified as pathogenic in the germline context according to ClinVar (National Center for Biotechnology Information ClinVar 20160831) were also reviewed for relevance. Variants were annotated using established criteria17 and then classified as oncogenic mutations or variants of unknown significance (unknown actionability in myeloid malignancies, and/or minor allele frequency >1% in subpopulations, and/or present outside of a functionally relevant protein domain). The latter variants were excluded from the downstream analysis. The complete list of annotated variants is reported in supplemental Table 2.
Statistical analysis
The primary end point was OS, defined from the time of transformation to AP or BP until death or last follow-up. Group comparisons were performed using the Kruskal-Wallis test and Fisher's exact test for continuous and categorical variables, respectively. OS estimates were calculated based on the Kaplan-Meier method. Survival between groups was compared using the log-rank test. For univariate and multivariate analyses, OS end points were fit using the Cox proportional hazards model. Model selection was based on the purposeful selection method of Hosmer et al.18 All data analyses were performed using SAS version 9.4.
Results
Study cohort
Two hundred and eight patients were identified from the MPN and leukemia databases (Figure 1). Following chart review, 28 patients were excluded due to MPN/myelodysplastic syndrome (MDS) (n = 15), no evidence of transformation to AP/BP (n = 6), MDS (n = 4), and 1 patient each with chronic neutrophilic leukemia, systemic mastocytosis, and insufficient information. Of the remaining 180 patients with an established diagnosis of MPN in AP/BP, 122 patients (AP = 14; BP = 108) had a sample available for molecular testing; this study cohort was used for all further analysis. The clinical features of this study population are summarized in Table 1. Comparison of the baseline clinical and laboratory variables and outcomes of patients with and without a banked tissue sample is shown in supplemental Table 3. Patients with a banked sample had a higher percentage of PB blasts (24% vs 18.5%, P = .04).
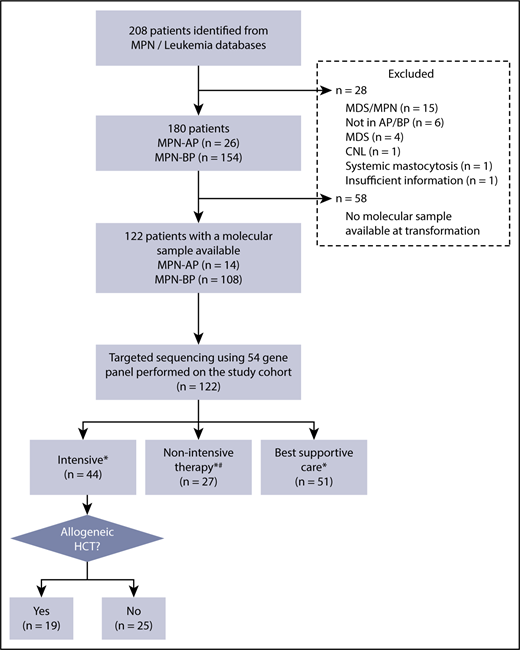
Eligibility of study cohort. *Treatment decision made by the treating physician, taking into consideration comorbidities, performance status, and patient preference. #Hypomethylating agent (HMA), n = 16; clinical trial, n = 10; low-dose chemotherapy, n = 1. CNL, chronic neutrophilic leukemia.
Eligibility of study cohort. *Treatment decision made by the treating physician, taking into consideration comorbidities, performance status, and patient preference. #Hypomethylating agent (HMA), n = 16; clinical trial, n = 10; low-dose chemotherapy, n = 1. CNL, chronic neutrophilic leukemia.
Baseline characteristics stratified by MPN driver mutations
| Study patients (N = 122) | JAK2 mutated (n = 67) | CALR mutated (n = 16) | MPL mutated (n = 7) | Triple negative (n = 32) | P, JAK2/MPL vs CALR vs triple negative | |
|---|---|---|---|---|---|---|
| Male, n (%) | 72 (59) | 41 (61) | 10 (63) | 6 (86) | 15 (47) | .27 |
| MPN diagnosis at AP/BP, n (%) | <.0001 | |||||
| PV/PPV-MF | 40 (33) | 36 (54) | 0 (0) | 0 (0) | 4 (13) | |
| ET/PET-MF | 38 (31) | 16 (24) | 11 (69) | 2 (29) | 9 (28) | |
| PMF | 34 (28) | 12 (18) | 5 (31) | 5 (71) | 12 (38) | |
| MPN-U | 10 (8) | 3 (5) | 0 (0) | 0 (0) | 7 (22) | |
| Age at AP/BP, median (range), y | 69 (36-86) | 69 (45-84) | 67 (47-79) | 70 (47-86) | 71 (36-86) | .08 |
| Time from MPN diagnosis to AP/BP, median (range), y | 5.4 (0.0-43.0) | 6.7 (0.1-43.0) | 10.9 (2.2-23.6) | 2.3 (0.3-6.5) | 2.8 (0.0-18.5) | .003 |
| Prior MPN therapies, n (%) | .84 | |||||
| 0 or 1 | 73 (60) | 37 (55) | 10 (63) | 5 (71) | 21 (66) | |
| 2 | 25 (21) | 13 (19) | 4 (25) | 2 (29) | 6 (19) | |
| ≥3 | 24 (20) | 17 (25) | 2 (13) | 0 (0) | 5 (16) | |
| Status at time of NGS, n (%) | .40 | |||||
| AP | 14 (11) | 6 (9) | 4 (25) | 1 (14) | 3 (9) | |
| AML* | 107 (88) | 60 (90) | 12 (75) | 6 (86) | 29 (91) | |
| MPAL | 1 (1) | 1 (2) | 0 (0) | 0 (0) | 0 (0) | |
| ECOG at AP/BP, n (%) | .51 | |||||
| 0 or 1 | 88 (72) | 51 (76) | 13 (81) | 5 (71) | 19 (59) | |
| 2 | 17 (14) | 9 (13) | 1 (6) | 0 (0) | 7 (22) | |
| ≥3 | 14 (12) | 7 (10) | 1 (6) | 2 (29) | 4 (13) | |
| Not available | 3 (3) | 0 (0) | 1 (6) | 0 (0) | 2 (6) | |
| Hemoglobin, median (range) (n = 120), g/L | 88 (51-183) | 91 (55-183) | 90 (52-124) | 89 (78-109) | 83 (51-111) | .05 |
| White blood cell count, median (range) (n = 121), ×109/L | 12.8 (0.8-278.0) | 12.0 (0.9-278.0) | 19.4 (1.3-138.8) | 18.7 (10.1-88.2) | 14.9 (0.8-150.0) | .94 |
| Platelets, median (range) (n = 120), ×109/L | 62 (7-1918) | 59 (8-1918) | 77 (9-865) | 112 (32-620) | 43 (7-863) | .13 |
| Blasts in PB, median (range) (n = 121), % | 24 (0-96) | 26 (0-96) | 24 (0-90) | 17 (7-60) | 24 (0-90) | .94 |
| Blasts in BM, median (range) (n = 100), % | 35 (0-95) | 40 (0-95) | 25 (3-90) | 20 (1-55) | 31 (0-90) | .73 |
| LDH, median (range), U/L | 624 (144-4274) | 618 (156-4000) | 1289 (354-4274) | 1548 (431-3410) | 465 (144-2168) | .01 |
| Albumin, median (range), g/L | 37 (23-48) | 37 (29-48) | 36 (27-43) | 37 (33-44) | 35 (23-46) | .09 |
| Spleen status, n (%) | .20 | |||||
| Splenectomy | 8 (7) | 4 (6) | 1 (6) | 1 (14) | 2 (6) | |
| Not palpable | 40 (33) | 19 (28) | 5 (31) | 1 (14) | 15 (47) | |
| Spleen ≤10 cm BCM | 30 (25) | 18 (27) | 3 (19) | 1 (14) | 8 (25) | |
| Spleen ≥11 cm BCM | 37 (30) | 23 (34) | 7 (23) | 3 (43) | 4 (13) | |
| Missing | 7 (6) | 3 (4) | 0 (0) | 1 (14) | 3 (9) | |
| Cytogenetic abnormalities, n (%) | .78 | |||||
| Normal | 30 (25) | 14 (28) | 6 (43) | 2 (50) | 8 (32) | |
| 1 | 18 (15) | 9 (18) | 3 (21) | 1 (25) | 5 (20) | |
| 2 | 14 (12) | 11 (22) | 0 (0) | 0 (0) | 3 (12) | |
| ≥3 | 32 (26) | 17 (33) | 5 (36) | 1 (25) | 9 (36) | |
| Failed | 11 (9) | 4 (6) | 2 (13) | 1 (14) | 4 (13) | |
| Not available | 17 (14) | 12 (18) | 0 (0) | 2 (29) | 3 (9) | |
| Co-occurrence of mutations, n (%) | ||||||
| ASXL1 | 36 (30) | 15 (22) | 7 (44) | 3 (43) | 11 (34) | .24 |
| TET2 | 30 (25) | 18 (49) | 3 (19) | 1 (14) | 8 (25) | .84 |
| SRSF2 | 27 (22) | 14 (21) | 1 (6) | 3 (43) | 9 (28) | .22 |
| RUNX1 | 25 (20) | 17 (25) | 3 (19) | 1 (14) | 4 (13) | .38 |
| TP53 | 21 (17) | 10 (15) | 4 (25) | 0 (0) | 7 (22) | .39 |
| DNMT3A | 20 (16) | 14 (21) | 4 (25) | 0 (0) | 2 (6) | .16 |
| IDH1 | 16 (13) | 9 (13) | 2 (13) | 1 (14) | 4 (13) | 1.00 |
| IDH2 | 16 (13) | 12 (18) | 1 (6) | 1 (14) | 2 (6) | .27 |
| STAG2 | 14 (11) | 10 (15) | 0 (0) | 0 (0) | 4 (13) | .30 |
| NRAS | 13 (11) | 8 (12) | 1 (6) | 0 (0) | 4 (13) | .84 |
| SETBP1 | 11 (9) | 1 (1) | 1 (6) | 1 (14) | 8 (25) | .002 |
| U2AF1 | 11 (9) | 6 (9) | 1 (6) | 1 (14) | 3 (9) | 1.00 |
| EZH2 | 9 (7) | 3 (4) | 4 (25) | 1 (14) | 1 (3) | .04 |
| SF3B1 | 9 (7) | 5 (7) | 0 (0) | 1 (14) | 3 (9) | .62 |
| KRAS | 8 (7) | 5 (7) | 0 (0) | 1 (14) | 2 (6) | .77 |
| PHF6 | 8 (7) | 6 (9) | 0 (0) | 0 (0) | 2 (6) | .77 |
| Number of mutations, n (%) | .09 | |||||
| 0-1 | 20 (16) | 7 (10) | 3 (19) | 0 (0) | 10 (31) | |
| 2-3 | 46 (38) | 28 (42) | 6 (38) | 3 (43) | 9 (28) | |
| ≥4 | 56 (46) | 32 (48) | 7 (44) | 4 (57) | 13 (41) | |
| Treatment received, n (%) | .15 | |||||
| Intensive | 43 (35) | 21 (31) | 8 (50) | 1 (14) | 13 (41) | |
| 3+7 | 20 (16) | 6 (9) | 3 (19) | 1 (14) | 10 (31) | |
| FLAG-IDA | 13 (11) | 9 (13) | 2 (13) | 0 (0) | 2 (6) | |
| NOVE-HIDAC | 10 (8) | 6 (9) | 3 (19) | 0 (0) | 1 (3) | |
| Transplant upfront | 1 (1) | 0 (0) | 0 (0) | 1 (14) | 0 (0) | |
| Nonintensive† | 27 (22) | 13 (19) | 5 (31) | 2 (29) | 7 (22) | |
| BSC | 51 (42) | 33 (49) | 3 (19) | 3 (43) | 12 (38) | |
| Allogeneic transplant, n (%) | .48 | |||||
| Yes | 19 (16) | 9 (14) | 4 (27) | 1 (17) | 5 (16) | |
| No | 103 (84) | 56 (86) | 11 (73) | 5 (83) | 27 (84) |
BCM, below costal margin; BM, bone marrow; ECOG, Eastern Cooperative Oncology Group; ET, essential thrombocythemia; MPAL, mixed-phenotype acute leukemia; LDH, lactate dehydrogenase; MPN-U, MPN unclassifiable; NGS, next-generation sequencing; PET-MF, post–essential thrombocythemia myelofibrosis; PMF, primary myelofibrosis; PPV-MF, post–polycythemia vera myelofibrosis; PV, polycythemia vera.
AML includes 1 patient with myeloid sarcoma.
Nonintensive therapy includes azacitidine (n = 16), clinical trial (n = 10), and low-dose cytarabine (n = 1).
Sequencing results
Five hundred and twenty-three variants were identified by sequencing, with 441 (84%) classified as oncogenic and 82 (16%) as variants of unknown significance. JAK2V617F was the most common, occurring in 55% of patients (n = 67), CALR in 13% (n = 16), and MPL in 6% (n = 7) (Figure 2A). Thirty-two (26%) patients were classified as triple negative with no canonical mutations identified in JAK2, CALR, or MPL. Among CALR mutant patients, type 1/type 1–like mutation was seen in 6 patients (38%), and type 2/type 2–like mutation was seen in 9 patients (56%). One patient had a mutation that was neither type 1 nor type 2. Other frequently mutated genes included ASXL1 (n = 36; 30%), TET2 (n = 30; 25%), SRSF2 (n = 27; 22%), RUNX1 (n = 25; 20%), TP53 (n = 21; 17%), DNMT3A (n = 20; 16%), IDH1 (n = 16; 13%), and IDH2 (n = 16; 13%) (Figure 2A). Mutations in FLT3 and NPM1 occurred in 3% (n = 4) and 2% (n = 2) of cases, respectively. No mutation was identified in the following genes with the sequencing panel used: ABL1, ATRX, BRAF, CBLB, CBLC, FBXW7, GATA1, GNAS, HNAS, JAK3, KDM6A, KMT2A, PDGFRA, and PTEN.
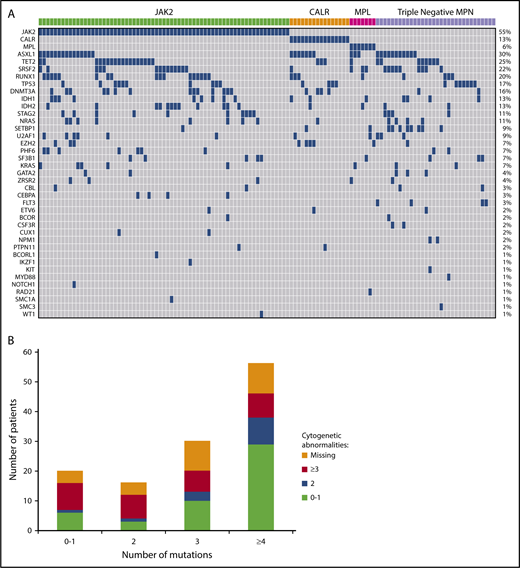
(A) Landscape plot of mutations. Each column represents an individual patient. The percentages on the right of the table represent percent of study patients with a mutation in each gene. (B) Number of mutations stratified by number of cytogenetic abnormalities.
(A) Landscape plot of mutations. Each column represents an individual patient. The percentages on the right of the table represent percent of study patients with a mutation in each gene. (B) Number of mutations stratified by number of cytogenetic abnormalities.
Mutations in 1, 2, 3, and ≥4 genes were seen in 15%, 13%, 25%, and 46% of patients, respectively. Two patients had no mutation identified by sequencing using the current panel. Of the 18 patients with a single identified mutation, 7 had mutations in JAK2, 5 in TP53, 3 in CALR. The remaining 3 patients had a mutation in ASXL1, FLT3, and RUNX1, respectively. Sixteen patients had 2 mutations identified by sequencing. Of this group, 14 patients had a mutation in either JAK2, CALR, MPL, or TP53 with only 2 patients having no mutation in the aforementioned genes. Furthermore, nearly half (47%; n = 10/21) of all TP53 mutations occurred alone or with one other abnormality. The proportion of patients with ≥3 cytogenetic abnormalities were equally represented across the mutational spectrum (Figure 2B), with no correlation between number of mutations and number of cytogenetic abnormalities (P = .17).
Correlation of baseline characteristics with mutation profile
Baseline characteristics at the time of AP/BP and stratified by MPN driver mutations are described in Table 1. As expected, prior MPN diagnosis (P < .0001) and latency from MPN diagnosis to transformation (P = .003) was significantly different between the subgroups. Patients with JAK2 mutation were more likely to have a previous diagnosis of polycythemia vera/post–polycythemia vera myelofibrosis. CALR mutated patients had the longest latency from MPN diagnosis to AP/BP (10.9 years), while MPL mutated and triple-negative patients had the shortest latency (2.3 and 2.8 years, respectively). There was no difference in hematological parameters or cytogenetic abnormalities between the subgroups. Lactate dehydrogenase was the only laboratory variable to differ with a lower value seen in triple-negative patients (P = .01). Exploratory analysis correlating mutations (frequency of >15% in the study population) with complete blood count and blast count at time of AP/BP, showed that ASXL1-mutated patients were more likely to have a higher white blood cell count (31.3 vs 10.3 × 10⁹/L, P = .04).
In triple-negative patients, the most frequently mutated genes included ASXL1 (34%), SRSF2 (28%), and TET2 (25%). SETBP1 mutation was present at a higher frequency in the triple-negative cohort; 8 (25%) patients had a mutation compared with 1 patient each in the JAK2/CALR/MPL-mutated groups (P = .002). CALR-mutated patients were more likely to have an EZH2 mutation (n = 4; 25%; P = .04). There was no difference between the subgroups in the frequency of TP53 mutation (P = .39) or number of mutations (P = .09).
Correlation of baseline characteristics with treatment approach
Forty-four patients (36%) were treated with intensive therapy, 27 (22%) with nonintensive therapy, and 51 (42%) with BSC (supplemental Table 4). Younger patients were more likely to be treated with intensive therapy (P < .0001), while patients with poor performance status (ECOG ≥ 3; P < .0001) and low albumin level (P = .04) were more likely to receive BSC.
Outcomes
The median OS for the study cohort was 5.8 months. There was no difference in the 2-year survival for patients stratified according to their mutational status (JAK2 mutated, 18%; CALR mutated, 9%; MPL mutated, 14%; and triple negative, 12%) (P = .36; Figure 3A). Prior MPN diagnosis did not impact prognosis once patients transformed to AP/BP. Patients with ≥3 cytogenetic abnormalities had an inferior outcome (P = .004; Figure 3B). TP53 mutation was the only individual mutation to correlate with shorter OS (P = .03; Figure 3C). Mutational burden was also statistically significant with ≥4 mutations associated with an inferior survival (P = .02; Figure 3D).
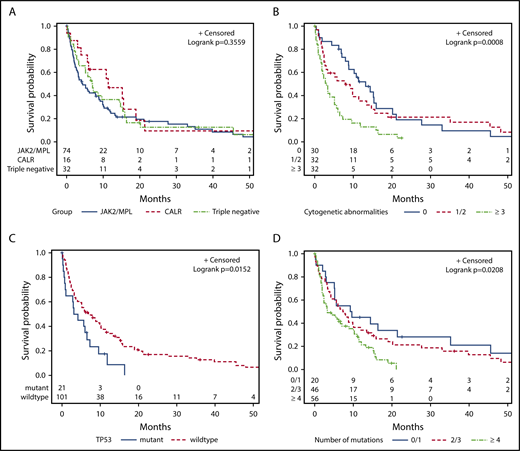
Kaplan-Meier curves for univariate analysis, irrespective of treatment approach. Stratified by (A) JAK2/MPL vs CALR vs triple-negative patients, (B) cytogenetic abnormalities, (C) TP53 mutation, and (D) number of mutations.
Kaplan-Meier curves for univariate analysis, irrespective of treatment approach. Stratified by (A) JAK2/MPL vs CALR vs triple-negative patients, (B) cytogenetic abnormalities, (C) TP53 mutation, and (D) number of mutations.
The majority of patients in our study population had signaling pathway mutations that could be classified into 1 of 2 groups: mutations in genes implicated in activated JAK-STAT signaling (JAK2, CALR, MPL, and CSF3R) or RAS signaling (NRAS, KRAS, PTPN11, CBL, FLT3, and KIT).17 Mutations in the JAK-STAT signaling pathway did not impact survival, whereas mutations in RAS signaling pathway were associated with shorter OS (2.5 vs 8.6 months, P = .02; supplemental Table 5). Furthermore, when stratified for patients with JAK-STAT signaling mutations, the addition of a mutation in the RAS signaling pathway was associated inferior outcomes (1.7 vs 8.0 months; P = .01).
For patients treated with intensive therapy, nonintensive therapy, and BSC, the 2-year OS was 18%, 15%, and 9%, respectively (P < .0001; Figure 4A). There was no difference in survival between patients treated with intensive vs nonintensive therapy (P = .85). Within the intensive-therapy group, survival advantage was only seen in patients who proceeded to HCT (Figure 4B).

Kaplan-Meier curves for univariate analysis. Stratified by (A) treatment approach for all patients, (B) treatment approach for intensive therapy (with and without transplant) and nonintensive therapy, (C) cytogenetic abnormalities and number of mutations, and (D) treatment approach and number of mutations.
Kaplan-Meier curves for univariate analysis. Stratified by (A) treatment approach for all patients, (B) treatment approach for intensive therapy (with and without transplant) and nonintensive therapy, (C) cytogenetic abnormalities and number of mutations, and (D) treatment approach and number of mutations.
In univariate analysis, factors associated with shorter OS included older age (P = .01), ECOG ≥3 (P = .002), low albumin level (P = .001), higher percentage of PB blasts (P = .0003) and BM blasts (P = .01) (Table 2). There was no difference in survival for patients diagnosed between 1997-2007 and 2008-2017 (P = .45). Patients with ≥3 cytogenetic abnormalities and ≥4 mutations had the shortest OS (Figure 4C). Patients with ≥4 mutations had inferior outcomes regardless of whether they received intensive or nonintensive therapy (Figure 4D).
Univariate analysis for OS (N = 122)
| Median OS, mo | HR | 95% CI | P | |
|---|---|---|---|---|
| MPN diagnosis at time of AP/BP | .59 | |||
| PV/PPV-MF | 4.3 | 1.00 | — | |
| ET/PET-MF | 6.5 | 0.72 | 0.44-1.17 | |
| PMF | 8.6 | 0.85 | 0.52-1.39 | |
| MPN-U | 7.4 | 0.98 | 0.48-1.98 | |
| Age at AP/BP, y* | 1.02 | 1.01-1.04 | .01 | |
| Year of AP/BP diagnosis | .45 | |||
| 1997-2007 | 9.7 | 1.00 | — | |
| 2008-2017 | 5.7 | 1.20 | 0.75-1.90 | |
| Prior MPN therapies | .38 | |||
| 0 or 1 | 8.6 | 1.00 | — | |
| 2 | 4.2 | 1.44 | 0.88-2.38 | |
| ≥3 | 4.0 | 1.10 | 0.66-1.82 | |
| ECOG at AP/BP | .002 | |||
| 0 or 1 | 8.8 | 1.00 | — | |
| 2 | 2.6 | 1.74 | 0.98-3.11 | |
| ≥3 | 1.7 | 3.25 | 1.74-6.09 | |
| Hemoglobin* | 0.99 | 0.98-1.00 | .13 | |
| White blood cells* | 1.00 | 1.00-1.01 | .36 | |
| Platelets* | 1.00 | 1.00-1.00 | .07 | |
| Blasts in PB* | 1.01 | 1.01-1.02 | .0003 | |
| Blasts in BM* | 1.01 | 1.00-1.02 | .01 | |
| LDH* | 1.00 | 1.00-1.00 | .22 | |
| Albumin* | 0.92 | 0.88-0.97 | .001 | |
| Spleen status | .13 | |||
| Splenectomy | 3.0 | 1.00 | — | |
| Not palpable | 8.6 | 0.41 | 0.19-0.91 | |
| Spleen ≤10 cm BCM | 5.1 | 0.66 | 0.30-1.45 | |
| Spleen ≥11 cm BCM | 8.8 | 0.47 | 0.21-1.04 | |
| Missing | 5.2 | 0.80 | 0.28-2.30 | |
| Cytogenetic abnormalities | .004 | |||
| Normal | 13.2 | 1.00 | ||
| 1 | 9.2 | 1.07 | 0.56-2.03 | |
| 2 | 5.2 | 1.53 | 0.76-3.08 | |
| ≥3 | 3.0 | 2.64 | 1.52-4.57 | |
| Treatment received | <.0001 | |||
| Intensive | 9.8 | 1.00 | — | |
| Nonintensive | 12.1 | 0.95 | 0.55-1.65 | |
| BSC | 2.0 | 2.97 | 1.90-4.64 | |
| Number of mutations | .02 | |||
| 0-1 | 9.4 | 1.00 | — | |
| 2-3 | 7.3 | 1.27 | 0.72-2.24 | |
| ≥4 | 3.4 | 2.04 | 1.15-3.65 | |
| JAK2 V617F (n = 67) | .36 | |||
| Yes | 4.4 | — | — | |
| No | 7.3 | 0.84 | 0.57-1.23 | |
| CALR (n = 16) | .21 | |||
| Yes | 11.4 | — | — | |
| No | 5.7 | 1.45 | 0.79-2.65 | |
| MPL (n = 7) | .47 | |||
| Yes | 3.4 | — | — | |
| No | 6.0 | 0.75 | 0.35-1.61 | |
| ASXL1 (n = 36) | .91 | |||
| Yes | 7.0 | — | — | |
| No | 5.8 | 0.98 | 0.64-1.50 | |
| DMNT3A (n = 20) | ||||
| Yes | 4.4 | — | — | .97 |
| No | 6.5 | 0.98 | 0.56-1.74 | |
| EZH2 (n = 9) | ||||
| Yes | 10.8 | — | — | .81 |
| No | 5.8 | 0.92 | 0.44-1.89 | |
| IDH1 (n = 16) | ||||
| Yes | 4.4 | — | — | .53 |
| No | 6.0 | 0.83 | 0.47-1.46 | |
| IDH2 (n = 16) | ||||
| Yes | 5.1 | — | — | .71 |
| No | 6.2 | 1.12 | 0.61-2.04 | |
| KRAS (n = 8) | ||||
| Yes | 1.2 | — | — | .10 |
| No | 6.9 | 0.49 | 0.23-1.06 | |
| NRAS (n = 13) | ||||
| Yes | 2.7 | — | — | .73 |
| No | 6.0 | 0.89 | 0.45-1.67 | |
| PHF6 (n = 8) | ||||
| Yes | 3.8 | — | — | .25 |
| No | 6.2 | 0.62 | 0.28-1.33 | |
| RUNX1 (n = 25) | ||||
| Yes | 5.2 | — | — | .17 |
| No | 6.5 | 0.71 | 0.44-1.15 | |
| SETBP1 (n = 11) | ||||
| Yes | 7.0 | — | — | .94 |
| No | 5.8 | 1.03 | 0.52-2.04 | |
| SF3B1 (n = 9) | ||||
| Yes | 6.9 | — | — | .84 |
| No | 5.8 | 0.93 | 0.45-1.91 | |
| SRSF2 (n = 27) | ||||
| Yes | 9.8 | — | — | .40 |
| No | 5.8 | 1.22 | 0.76-1.97 | |
| STAG2 (n = 14) | ||||
| Yes | 2.3 | — | — | .71 |
| No | 6.2 | 0.90 | 0.51-1.58 | |
| TET2 (n = 30) | ||||
| Yes | 3.9 | — | — | .10 |
| No | 7.0 | 0.68 | 0.44-1.06 | |
| TP53 (n = 21) | ||||
| Yes | 3.6 | — | — | .03 |
| No | 7.0 | 0.53 | 0.32-0.89 | |
| U2AF (n = 11) | ||||
| Yes | 4.2 | — | — | .24 |
| No | 6.5 | 0.67 | 0.36-1.26 |
CI, confidence interval.
Continuous variable.
TP53 mutation cohort
Twenty-two mutations in TP53 were identified in 21 (17%) patients. Of the 15 patients with available cytogenetic results, 14 had a complex karyotype. The median OS for this cohort was 3.6 months. Eight patients were treated with intensive therapy, 3 with azacitidine, and 10 with BSC. Of the 8 patients receiving induction chemotherapy, 1 achieved CR (duration, 2.2 months), 3 reverted to CP MPN, 2 had resistant disease, and 2 patients died of induction therapy–related complications. Two patients proceeded to HCT, including 1 patient not in remission, both patients died of relapsed AML within 9 months of transplant. The median OS for TP53 mutant patients treated with intensive chemotherapy, azacitidine, and BSC was 8.1 months, 7.3 months, and 0.9 months, respectively (P = .0003).
Multivariate analysis
To further investigate the impact of mutations and clinical variables on OS, the following factors were analyzed in the multivariate analysis: number of mutations, TP53 mutation, albumin level, percentage of blasts in PB, number of cytogenetic abnormalities, and treatment intent. All the above variables, except age was found to be independently associated with shorter survival (Table 3).
Multivariate analysis for OS
| Variable | HR | 95% CI | P |
|---|---|---|---|
| Number of mutations | <.0001 | ||
| 0/1 | 1.00 | — | |
| 2/3 | 2.43 | 1.21-4.88 | |
| ≥4 | 5.51 | 2.50-12.15 | |
| TP53 mutation | |||
| No | 1.00 | — | .04 |
| Yes | 1.91 | 1.02-3.56 | |
| Age, y | 0.99 | 0.96-1.01 | .27 |
| Albumin level, g/L | 0.91 | 0.86-0.96 | .0004 |
| Blasts in PB, % | 1.02 | 1.01-1.02 | .0001 |
| Number of cytogenetic abnormalities | .01 | ||
| 0 | 1.00 | — | |
| 1 | 1.31 | 0.67-2.58 | |
| 2 | 1.95 | 0.92-4.15 | |
| ≥3 | 3.63 | 1.77-7.44 | |
| Missing | 2.15 | 1.11-4.15 | |
| Treatment intent | <.0001 | ||
| Intensive | 1.00 | — | |
| Nonintensive | 0.99 | 0.49-1.98 | |
| BSC | 3.99 | 2.02-7.92 |
Discussion
Several studies have shown that the benefit of induction chemotherapy in AP/BP MPN is restricted to patients who proceed to HCT.2,3 Patients who are unable to undergo transplant derive minimal benefit from intensive therapy. We extend these findings further to demonstrate that the advantage of intensive therapy is limited to patients with wild-type TP53 and <4 mutations. Furthermore, we show that regardless of treatment approach, patients with ≥4 mutations did not obtain any significant benefit. A recent study in MDS and overlap MDS/MPN also highlighted the importance of number of mutations in predicting response to therapy with hypomethylating agents.19
We found no difference in survival for patients with JAK2/CALR/MPL-mutated and triple-negative AP/BP MPNs. The only individual mutation conferring a significant adverse prognosis was TP53. We did not observe the detrimental impact of RUNX1, SRSF2, or PTPN11 mutations seen by other groups.5,7 The reasons for this discrepancy are not clear. Although difficult to compare between various studies, the frequency of PTPN11 mutation was low in our cohort (frequency: 2/122 vs 5/75 in a study from Mayo Clinic) limiting further analysis. Our patient cohort had a higher proportion of patients proceeding to HCT compared with the Mayo Clinic study.7
No difference in outcome was observed in patients treated with intensive and nonintensive therapies. Importantly, the benefit of intensive therapy was only apparent in patients who proceeded to HCT. These finding are important in guiding routine clinical practice, as patients with AP/BP MPN without the option or future prospect of transplant could be spared from the toxicities associated with intensive chemotherapy. These patients could be treated with nonintensive approaches such as hypomethylating agents or clinical trials. The latter treatment approach allows patients to be treated as an outpatient with generally less morbidity and perhaps economically preferable compared with induction chemotherapy regimens. Furthermore, we highlight that in AP/BP MPN patients, low serum albumin is predictive of shorter survival. A previous study in MDS has demonstrated the negative prognostic value of hypoalbuminemia, which is a surrogate marker of nutritional and performance status.20
Our study provides some observations and insights into the understanding of leukemic transformation in patients with MPN. Firstly, clonal complexity is evident in AP/BP with a greater number of mutations per patient identified compared with CP MPN. For example, when the same sequencing panel and annotation criteria was applied, ≥3 mutations were seen in 71% of patients in AP/BP compared with 34% of patients in CP.16 Secondly, the frequency of RUNX1, TP53, IDH1, IDH2, and SETBP1 appears significantly higher in AP/BP than in CP MPN.21 Moreover, in our study, SETBP1 mutations were enriched in triple-negative patients. SETBP1 mutations are associated with adverse outcomes in chronic myelomonocytic leukemia and MDS.22 Taken together, these findings might suggest that alterations in SETBP1 may have a role in the transformation of CP MPNs to AP/BP. Finally, CALR type 2/type 2–like mutations were more common in our cohort as compared with CP MPNs, where CALR type 1/type 1–like mutations are more frequently observed.13
Our study demonstrates that molecular profiling can further assist in selecting patients who can benefit from current treatment approaches, including intensive therapy. Unless an emergent or life-threatening situation (eg, hyperleukocytosis or disseminated intravascular coagulation) develops, we recommend that the intensive treatment approach be reserved for patients with (1) wild-type TP53, (2) <4 mutations and/ or <3 cytogenetic abnormalities, and (3) a realistic prospect of transplantation. For all other patients, we suggest treatment with a hypomethylating agent or consideration for enrollment in a clinical trial where possible. Treatment with novel therapies as part of a clinical trial are potentially available to patients with AML, such as IDH1/2 inhibitors, venetoclax, and combination therapies. However, several AML clinical trials exclude patients with a previous history of MPN, limiting access to these novel treatments for this group of patients. For induction candidates, the option of CPX-351 is worthy of further investigation in clinical trials. In conclusion, our study shows that the benefit of current treatment options, including intensive therapy, is limited to patients with wild-type TP53 and <4 mutations. Continuous enrollment in clinical trials is important to improve the outcomes for this cohort of patients.
The full-text version of this article contains a data supplement.
Acknowledgments
This work was supported by grants from the Princess Margaret Cancer Centre Foundation and the Elizabeth and Tony Comper Foundation to the MPN Program at the Princess Margaret Cancer Centre (V.G.).
Authorship
Contribution: C.J.M., S.C., D.M., A. Schimmer, A. Schuh, H.S., K.Y., M.D.M., H.T., A.V., V.G., and J.H. contributed to clinical patient management; A.A. and J.O.C. collected the samples; C.J.M., G.D.-R., R.D., and N.S. collected the clinical data; T.S., M.S., M.T., N.K., and S.K.-R. performed molecular investigations; T.P. and J.S. performed statistical analyses; C.J.M. and V.G. compiled the clinical and mutational data, analyzed the data, and wrote the manuscript; C.J.M., J.A.K., N.K., M.S., and M.T. analyzed and annotated the mutational data; V.G. designed and supervised the study and was overall responsible for the conduct of the study; and all authors reviewed the manuscript.
Conflict-of-interest disclosure: T.P. provided consultancy services to Celgene. A. Schimmer, D.M., T.S., and N.S. received honoraria from Novartis. A. Schimmer received research funding from Medivir Pharmaceuticals. A. Schuh served on the advisory board of Amgen. K.Y. received research funding and served on the advisory board of Novartis. S.K.-R. received research funding from BMS. V.G. received research funding through his institution and honoraria from Novartis and Incyte and has served on the advisory board of Novartis. The remaining authors declare no competing financial interests.
Correspondence: Vikas Gupta, Department of Medical Oncology and Hematology, Princess Margaret Cancer Centre, 610 University Ave, Toronto, ON M5G 2M9, Canada; e-mail: vikas.gupta@uhn.ca.

