

Key Points
The ELN guideline classifying FLT3-ITD low allele ratio with NPM1 mutation as having a favorable prognosis is questionable.
Performing allo-HSCT during CR1 irrespective of the FLT3-ITD allele ratio and NPM1 mut status significantly improves outcome.

Abstract
In the opinion of the European LeukemiaNet (ELN), nucleophosmin member 1 gene mutation (NPM1 mut)–positive acute myeloid leukemia (AML) with an fms-like kinase 3-internal tandem duplication (FLT3-ITD) allele ratio (AR) <0.5 (low AR) has a favorable prognosis, and allogeneic hematopoietic stem cell transplant (allo-HSCT) in the first complete remission (CR1) period is not actively recommended. We studied 147 patients with FLT3-ITD gene mutation–positive AML, dividing them into those with low AR and those with AR of ≥0.5 (high AR), and examined the prognostic impact according to allo-HSCT in CR1. Although FLT3-ITD AR and NPM1 mut are used in the prognostic stratification, we found that NPM1 mut–positive AML with FLT3-ITD low AR was not associated with favorable outcome (overall survival [OS], 41.3%). Moreover, patients in this group who underwent allo-HSCT in CR1 had a significantly more favorable outcome than those who did not (relapse-free survival [RFS] P = .013; OS P = .003). Multivariate analysis identified allo-HSCT in CR1 as the sole favorable prognostic factor (RFS P < .001; OS P < .001). The present study found that prognosis was unfavorable in NPM1 mut–positive AML with FLT3-ITD low AR when allo-HSCT was not carried out in CR1.
Introduction
Acute myeloid leukemia (AML) is a heterogeneous hematological malignancy characterized by myeloblast invasion of the bone marrow, peripheral blood, and other tissues in association with impaired differentiation and autonomous proliferation of hematopoietic stem cells. Induction therapy achieves complete remission (CR) in 60% to 80% of cases. However, the subsequent 5-year survival rate remains at ∼40%.1 Allogeneic hematopoietic stem cell transplantation (allo-HSCT) is a useful treatment aimed at cure of AML. However, non-relapse mortality in allo-HSCT is as high as ∼20%,2 and allo-HSCT therefore needs to be applied appropriately based on a consideration of the prognosis. To allow this, prognostic stratification plays an important role, but at present, chromosomal analysis places more than half of patients in the intermediate prognosis group, suggesting that this form of stratification is as yet insufficient. Our current tasks are to achieve more detailed prognostic stratification and a more accurate understanding of when hematopoietic stem cell transplant is indicated.
The prognostic factors in AML include age, white blood cell count at initial presentation, and chromosomal abnormality. The advent of the next-generation sequencer has enabled prognostic stratification to additionally take account of gene mutations.3 It has been suggested that the gene mutations nucleophosmin member 1 (NPM1), CCAAT/enhancer-binding protein α (CEBPA), and fms-like kinase 3-internal tandem duplication (FLT3-ITD) may act as prognostic factors in AML of normal karyotype, and these mutations are also used in the prognostic classification of the European LeukemiaNet (ELN). However, they are found in only ∼30% of patients in the intermediate prognosis group. A more detailed stratification is therefore required going forward.
FLT3, a member of the type III receptor tyrosine kinase family, consists of a ligand-binding extracellular domain, a single transmembrane domain, a cytoplasmic domain containing the juxtamembrane domain, tyrosine kinase domain 1, and tyrosine kinase domain 2. FLT3-ITD gene mutation was first reported in 1996 by Nakao et al4 and is observed in ∼25% of AML patients.5 In the FLT3-ITD gene mutation, the ITD is inserted into the FLT3 gene on chromosome 13, and its length varies from 3 to several hundred nucleotides.6 The FLT3-ITD gene mutation promotes proliferative activation through persistent phosphorylation of the FLT3 receptor and simultaneously suppresses apoptosis.7-9 In clinical terms, FLT3-ITD gene mutation is associated with increased white blood cell count, elevation of myeloblast proportion, and risk of relapse from CR and has been reported to carry an unfavorable prognosis.5,10,11 For this reason, allo-HSCT in the first complete remission (CR1) is recommended in FLT3-ITD–positive AML patients of transplant-eligible age.12-16
In FLT3-ITD gene mutation–positive AML cases, there was for many years no settled opinion regarding the status as prognosis-regulating factors of FLT3-ITD allele ratio (AR), the size of the ITD insertion mutation, the presence in ITD of tyrosine kinase domain 1, and the presence of the NPM1 gene mutation (NPM1 mut).12-21 In recent years, however, it has been reported that the inclusion of FLT3-ITD AR may make possible more detailed prognostic stratification in NPM1 mut–positive AML.12,22-24 In response to these findings, the ELN proposed a new prognostic classification in 2017.25 In the opinion of the ELN, NPM1 mut–positive AML with FLT3-ITD AR <0.5 has a favorable prognosis, and allo-HSCT in CR1 is not actively recommended. In contrast, the guideline of the National Comprehensive Cancer Network classifies FLT3-ITD gene mutation as a poor prognostic factor.26 Although it involves only a certain proportion of FLT3-ITD–positive cases, this is the first time that FLT3-ITD–positive AML has been classified in the favorable prognosis group, and there appears to be a fair number of clinicians who view the ELN recommendation with skepticism. The present study therefore aimed to examine the prognostic impact of FLT3-ITD AR and explore whether allo-HSCT is indicated in FLT3-ITD–positive AML.
Materials and methods
Patients
The study was a retrospective analysis of the 147 FLT3-ITD–positive cases among de novo AML patients diagnosed at Nippon Medical School Hospital or partner research institutions in the period since the year 2000 after excluding therapy-related AML, AML arising from myelodysplastic syndromes, and acute promyelocytic leukemia (M3). None of the patients was treated with FLT3 inhibitors. All samples were obtained at diagnosis after obtaining written informed consent in accordance with the Declaration of Helsinki. All the experiments were approved by the ethics committee of each institution.
Screening for cytogenetic abnormalities
G-band analysis was carried out using bone marrow aspirate sampled at the time of initial presentation. In cases where sampling was difficult, peripheral blood was used for the test instead. The cytogenetic prognosis was then classified in accordance with the system recommended by the ELN.
Gene mutation analysis
Following reference to existing studies,11,27,28 5′-GCAATTTAGGTATGAAAGCCAGC-3′ was used as the forward primer and 5′-CTTTCAGCATTTTGACGGCAAC-3′ as the reverse primer. Approximately 1 ng DNA was added to a mixture of 0.2 μM of the respective primer with TaKaRa Taq (Takara Bio, Shiga, Japan) (5 μL Ex Taq Buffer, 4 μL dDNP mixture, and 0.25 μL TaKaRa Ex Taq polymerase), and the whole mixture was brought to an overall volume of 50 μL with sterile purified water. The resulting mixture was subjected to polymerase chain reaction amplification at 95°C for 3 minutes, followed by 35 cycles at 98°C for 5 seconds, 64°C for 30 seconds, 72°C for 1 minute, and 72°C for 7 minutes. The amplified products were electrophoresed through 2% agarose gels and visualized under UV light with ethidium bromide staining. Cases in which an additional higher molecular weight band was observed were judged to be FLT3-ITD gene mutation–positive (FLT3-ITD). The AR and mutant size of FLT3-ITD patient samples were measured by fragment analysis using Applied Biosystems 3130 and 3130xl Genetic Analyzers (Thermo Fisher, Carlsbad, CA). FLT3-ITD AR was calculated as the ratio of the area under the curve of mutant to wild-type alleles (FLT3-ITD/FLT3wt). FLT3-ITD allele frequency (AF) was calculated as the area under the curve of mutant alleles as a percentage of mutant and wild-type alleles. In cases with >1 mutant, all FLT3-ITD mutants were aggregated. Mutant size was calculated by subtracting the total number of bases with wild-type FLT3 from the total number of bases containing mutant FLT3. As in previous reports, screening was carried out for NPM1 mut and CEBPA mutation.29,30
Statistical analysis
CR in the present study was defined according to the criteria for CR (bone marrow blasts <5%, absence of circulating blasts and blasts with Auer rods, absence of extramedullary disease, absolute neutrophil count ≥1.0 × 10⁹/L, and platelet count ≥100 × 109/L) or those for CR with incomplete hematologic recovery (the same except for residual neutropenia [<1.0 × 10⁹/L] or thrombocytopenia [<100 × 109/L]) in the ELN’s Response Criteria in AML.25 Relapse was defined as a return to ≥5% blast cells in the bone marrow after successful achievement of CR. Primary induction failure was defined as nonresponse to remission induction. Overall survival (OS) was defined as the time interval measured from the date of diagnosis to the date of death. Relapse-free survival (RFS) for patients who had achieved CR was calculated as the time interval from the date of CR to the date of relapse. These were defied according to the ELN. 25 An χ2 test was used for the analysis of nominal variables. Where a figure of <5 appeared in any field of the 2 × 2 table, a Fisher's exact test was used for analysis. The nonparametric Mann-Whitney U test was used to determine the statistical significance of differences in median values. All statistical tests were 2 sided. To analyze OS and RFS, the Kaplan-Meier method and the log-rank test were used. Events at a significance level of P < .05 were analyzed. Statistical analyses were performed using GraphPad Prism (version 7.03 for Windows; GraphPad Software, La Jolla, CA), and EZR (version 1.36; Saitama Medical Center, Jichi Medical University, Saitama, Japan).31
Results
Patient background
Patient background is shown in Table 1. The median age was 56 years. There were 66 males and 77 females. The median follow-up period was 0.95 years (345 days). Cytogenetic test results found normal karyotype in 106 cases, t(8;21) in 4, inv(16) in 1, trisomy 8 in 3, and complex karyotype in 4. Gene mutations other than FLT3-ITD consisted of NPM1 in 83 cases and CEBPA biallelic mutation in 3. Induction therapy consisted in 108 cases of standard chemotherapy in the form of an anthracycline-type drug (idarubicin, daunorubicin, or aclarubicin) combined with cytarabine. Allo-HSCT was carried out in 65 patients, in 31 of whom it took place during CR1.
Clinical background of the AML patients with FLT3-ITD
| All (N = 147) | AR | |||
|---|---|---|---|---|
| <0.5 (n = 59) | ≥0.5 (n = 88) | P | ||
| Age, median (range), y | 56 (18-90) | 54 (21-86) | 54 (18-90) | .853 |
| Sex | .172 | |||
| Male | 66 | 30 | 36 | |
| Female | 77 | 26 | 51 | |
| Unknown | 4 | 3 | 1 | |
| ECOG-PS, 0/1/2/3/4 | 41/46/6/3/3 | 21/17/1/1/0 | 20/29/5/2/3 | |
| WBC count, median (range), ×109/L | 56.1 (1.0-677.0) | 47.2 (1.0-620.0) | 75.6 (1.3-677.0) | .342 |
| Hb, median (range), g/dL | 8.4 (3.3-15.1) | 8.4 (3.3-15.0) | 8.6 (4.1-15.1) | .799 |
| Plt count, median (range), ×109/L | 50.0 (5.0-630.0) | 55.0 (6.0-630.0) | 49.0 (5.0-540.0) | .515 |
| LDH, median (range), IU/L | 719 (151-5930) | 718 (151-5930) | 765 (156-4144) | .437 |
| FAB | ||||
| M0 | 6 | 1 | 5 | .402 |
| M1 | 51 | 17 | 34 | .220 |
| M2 | 37 | 19 | 18 | .108 |
| M4 | 29 | 13 | 16 | .565 |
| M5 | 17 | 4 | 13 | .190 |
| Not determined | 7 | 5 | 2 | .117 |
| Chromosomal aberrations | ||||
| t(8,21) | 4 | 2 | 2 | 1.000 |
| inv(16) | 1 | 1 | 0 | .401 |
| Normal | 106 | 40 | 66 | .354 |
| Trisomy 8 | 3 | 0 | 3 | .274 |
| 11q23 | 0 | 0 | 0 | 1.000 |
| Complex | 4 | 1 | 3 | .649 |
| Unknown | 8 | 4 | 4 | .558 |
| Gene mutation | ||||
| FLT3-TKD | 0 | 0 | 0 | 1.000 |
| NPM1 | 83 | 31 | 52 | .432 |
| CEBPA(sm) | 8 | 5 | 3 | .268 |
| CEBPA(dm) | 3 | 3 | 0 | .063 |
| Induction therapy | ||||
| (IDA/DNR/ACR) + Ara-C | 108 | 41 | 67 | .371 |
| AVVV, BHAC-DM, CAG | 25 | 12 | 13 | .382 |
| Others | 14 | 6 | 8 | .827 |
| Stem cell transplantation | ||||
| All | 65 | 26 | 39 | .976 |
| In CR1 | 31 | 16 | 15 | .142 |
Data are numbers of patients, except as noted. Some data are missing due to the unavailability of certain follow-up data in a retrospective study.
ACR, aclarubicin; Ara-C, cytarabine; AVVV, cytarabine + etoposide + vincristine + vinblastine; BHAC-D, enocitabine + daunorubicin + 6-mercaptopurine; CAG, cytarabine + cytarabine + granulocyte colony-stimulating factor; dm, double mutation; DNR, daunorubicin; ECOG-PS, Eastern Cooperative Oncology Group performance status; FLT3-TKD, fms-like kinase 3-tyrosine kinase domain; IDA, idarubicin; Plt, platelet; sm, single mutation; WBC, white blood cell.
Study of FLT3-ITD AR
The median value for FLT3-ITD AF was 36.98% (range 2.08% to 100%), similar to that of a previous report,12 in which the median value for FLT3-ITD AF was 35% (range 1% to 96%) (supplemental Figure 1A). The characteristic distribution of AF and mutant size in the 124 cases with a single FLT3-ITD mutant is shown in supplemental Figure 1B-C.
RFS and OS were studied with the cutoff values for FLT3-ITD AR set variously at 0.25 (AF 20%), 0.5 (AF 33.3%), and 1.0 (AF 50%). When the cutoff value was set at FLT3-ITD AR 0.25, RFS and OS were found to be significantly more favorable in the low-AR group than in the high-AR group (RFS P = .030; OS P = .037) (supplemental Figure 2A). When the cutoff value was set at FLT3-ITD AR 0.5, RFS and OS were again significantly more favorable in the low-AR group (RFS P = .008; OS P = .015) (Figure 1). In contrast, when the cutoff value was set at FLT3-ITD AR 1.0, no significant difference in RFS or OS was observed between the low-AR group and the high-AR group (RFS P = .174; OS P = .624) (supplemental Figure 2B). These findings indicate that a cutoff value set at FLT3-ITD AR 0.5 was the most appropriate for prognostic stratification.
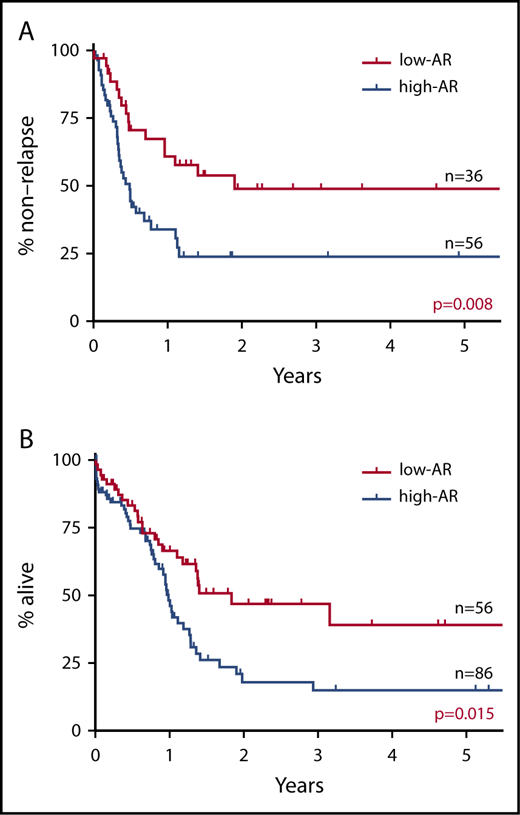
Impact on RFS and OS of FLT3-ITD AR with cutoff value set at 0.5. (A) RFS. (B) OS. RFS and OS were found to be significantly more favorable in the low-AR group than in the high-AR group (RFS at 5 years: low-AR group 48.9% vs high-AR group 23.8%, P = .008; OS at 5 years: low-AR group 39.1% vs high-AR group 15.0%, P = .015).
Impact on RFS and OS of FLT3-ITD AR with cutoff value set at 0.5. (A) RFS. (B) OS. RFS and OS were found to be significantly more favorable in the low-AR group than in the high-AR group (RFS at 5 years: low-AR group 48.9% vs high-AR group 23.8%, P = .008; OS at 5 years: low-AR group 39.1% vs high-AR group 15.0%, P = .015).
Based on the above results, the patients were divided into 2 groups: a low-AR group with AR of <0.5 (low AR) and a high-AR group with AR of ≥0.5 (high AR). The patient background of the 2 groups (Table 1) showed no significant difference in any factors.
Impact of AR on CR1 success rate, relapse rate, and CR2 success rate
The success rate of CR1, the relapse rate, and the success rate of the second complete remission (CR2) in the low-AR and high-AR groups are summarized in Table 2. The overall success rate of CR1 was 68.6% (94/137), with no significant difference found between the low-AR and high-AR groups (low AR 62.7% vs high AR 64.8%, P = .985). The relapse rate was examined with analysis restricted to cases in which allo-HSCT was not performed during CR1. The relapse rate was 84.4% (38/45) overall, with no significant difference noted between the low-AR and high-AR groups (low AR 85.7% vs high AR 83.9%, P = 1.000). Next, we examined the efficacy in these cases of postrelapse second induction therapy. The overall success rate of CR2 was 31.8% (7/22 patients), with no significant difference found between low-AR and high-AR groups (low AR 20.0% vs high AR 35.3%, P = .637). Relapse cases where transplant was not carried out in CR1 were thus associated with poor outcome irrespective of AR, with a probability of achieving second remission of ∼30%.
Outcome data according to FLT3-ITD AR level
| AR | ||||
|---|---|---|---|---|
| <0.5 (n = 59) | ≥0.5 (n = 88) | OR (95% CI) | P | |
| All patients | ||||
| PIF | 17 (28.9) | 26 (29.5) | 0.993 (0.477-2.063) | .985 |
| CR1 | 37 (62.7) | 57 (64.8) | ||
| Excluding patients who received allo-HSCT in CR1 | ||||
| Relapse after CR1 | 12 (20.3) | 26 (29.5) | 0.867 (0.171-4.576) | 1.000 |
| Nonrelapse after CR1 | 2 (3.9) | 5 (5.7) | ||
| Resistant to reinduction | 4 (6.8) | 11 (12.5) | 0.458 (0.058-4.063) | .637 |
| CR2 | 1 (1.7) | 6 (6.8) | ||
Values represent n (%) of patients.
CI, confidence interval; OR, odds ratio; PIF, primary induction failure.
Impact of AR on OS and RFS
Taking all cases of FLT3-ITD–positive AML, the 5-year RFS was 34.3%, and the 5-year OS was 25.8% (supplemental Figure 3). The overall relapse rate was 58.2% (53/91 patients).
In stratified analysis focusing on patients <70 years of age who have intermediate prognosis based on karyotype, the low-AR group was also found to have significantly better outcomes in both RFS and OS than the high-AR group (RFS P = .017; OS P = .049) (Figure 2A).
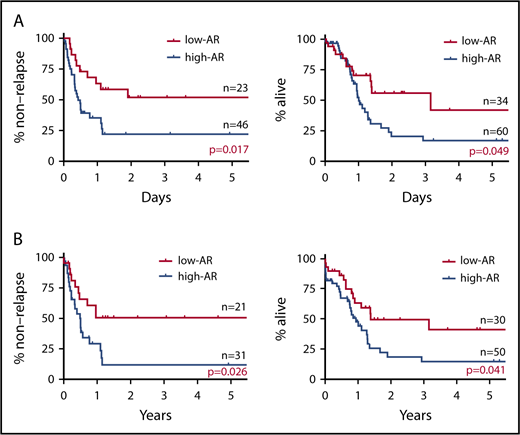
Impact on RFS and OS of FLT3-ITD AR focus on patients younger than 70 years with intermediate prognosis based on karyotype and NPM1 mut. (A) RFS (left) and OS (right) of patients <70 years with intermediate prognosis based on karyotype stratified for FLT3-ITD AR. The low-AR group was found to have significantly better outcomes in both RFS and OS than the high-AR group (RFS at 5 years: low-AR group 51.9% vs high-AR group 22.8%, P = .017; OS at 5 years: low-AR group 41.9% vs high-AR group 17.1%, P = .049). (B) RFS (left) and OS (right) of NPM1 mut–positive cases stratified for FLT3-ITD AR. When analysis was restricted to NPM1 mut–positive cases, RFS and OS were again found to be significantly more favorable in the low-AR group than the high-AR group (RFS at 5 years: low-AR group 50.5% vs high-AR group 11.7%, P = .026; OS at 5 years: low-AR group 41.3% vs high-AR group 14.7%, P = .041). However, in contrast to the classification of the ELN guidelines,25 the low-AR group, with a 5-year survival rate of 41.3%, was found to have not a good but an intermediate prognosis, and the high-AR group, with a 5-year survival rate of 14.7%, was found to have not an intermediate but an unfavorable prognosis.
Impact on RFS and OS of FLT3-ITD AR focus on patients younger than 70 years with intermediate prognosis based on karyotype and NPM1 mut. (A) RFS (left) and OS (right) of patients <70 years with intermediate prognosis based on karyotype stratified for FLT3-ITD AR. The low-AR group was found to have significantly better outcomes in both RFS and OS than the high-AR group (RFS at 5 years: low-AR group 51.9% vs high-AR group 22.8%, P = .017; OS at 5 years: low-AR group 41.9% vs high-AR group 17.1%, P = .049). (B) RFS (left) and OS (right) of NPM1 mut–positive cases stratified for FLT3-ITD AR. When analysis was restricted to NPM1 mut–positive cases, RFS and OS were again found to be significantly more favorable in the low-AR group than the high-AR group (RFS at 5 years: low-AR group 50.5% vs high-AR group 11.7%, P = .026; OS at 5 years: low-AR group 41.3% vs high-AR group 14.7%, P = .041). However, in contrast to the classification of the ELN guidelines,25 the low-AR group, with a 5-year survival rate of 41.3%, was found to have not a good but an intermediate prognosis, and the high-AR group, with a 5-year survival rate of 14.7%, was found to have not an intermediate but an unfavorable prognosis.
When analysis was restricted to NPM1 mut–positive cases, RFS and OS were again found to be significantly more favorable in the low-AR group than the high-AR group (RFS P = .026; OS P = .041) (Figure 2B). Table 3 shows patient background stratified by AR status in cases positive and negative for NPM1 mut. No significant difference in patient background was observed between the low-AR and high-AR groups in the NPM1 mut–positive cases. Thus, although cases with low-AR FLT3-ITD accompanied by NPM1 mut are classified according to the ELN recommendation25 as having favorable prognosis, our results indicate an associated OS of ≤50%, which, far from being favorable, represents an intermediate outcome. Moreover, although high-AR FLT3-ITD cases additionally positive for NPM1 mut are classified by the ELN guidelines25 in the intermediate group, according to our findings, this group has OS of ≤25%, corresponding to an unfavorable outcome.
Clinical background of AML patients with and without NPM1 mut
| All (N = 146) | NPM1+ (n = 83) | NPM1− (n = 63) | |||||
|---|---|---|---|---|---|---|---|
| AR <0.5 (n = 31) | AR ≥0.5 (n = 52) | P | < 0.5 (n = 27) | ≥ 0.5 (n = 36) | P | ||
| Age (y), median (range) | 56 (18-90) | 58 (26-80) | 56 (18-90) | .873 | 52 (21-86) | 55 (20-90) | .673 |
| Sex | |||||||
| Male | 66 | 13 | 15 | .240 | 17 | 21 | .797 |
| Female | 77 | 17 | 36 | .239 | 8 | 15 | .430 |
| Unknown | 4 | 1 | 1 | 1.000 | 2 | 0 | .180 |
| ECOG-PS, 0/1/2/3/4 | 41/45/6/3/3 | 12/9/1/0/0 | 11/19/3/2/2 | 9/7/0/3/0 | 9/10/2/0/1 | ||
| WBC count, median (range), ×109/L | 60.4 (1.0-677.0) | 49.9 (1.0-470.5) | 85.6 (2.1-677.0) | .519 | 36.2 (1.1-620.0) | 48.9 (1.3-450.1) | 0.570 |
| Hb, median (range), g/dL | 8.5 (3.5-15.1) | 8.9 (3.3-14.3) | 8.5 (4.4-14.9) | .756 | 8.0 (4.1-15.0) | 8.7 (4.1-15.1) | .926 |
| Plt count, median (range), ×109/L | 50.0 (5.0-630.0) | 49.0 (11.0-160.0) | 45.0 (5.0-339.0) | .708 | 82.0 (6.0-630.0) | 50.0 (6.0-540.0) | .602 |
| LDH, median (range), IU/L | 718 (151-5930) | 588 (204-3788) | 695 (156-4144) | .093 | 718 (151-5930) | 819 (157-3915) | 0.891 |
| FAB | |||||||
| M0 | 6 | 0 | 2 | .526 | 1 | 3 | 0.629 |
| M1 | 51 | 13 | 22 | 1.000 | 4 | 12 | 0.144 |
| M2 | 36 | 7 | 8 | .556 | 11 | 10 | .296 |
| M4 | 29 | 5 | 8 | 1.000 | 8 | 8 | .566 |
| M5 | 17 | 4 | 10 | .554 | 0 | 3 | .253 |
| Not determined | 7 | 2 | 2 | .627 | 3 | 0 | .073 |
| Chromosomal aberrations | |||||||
| t(8,21) | 4 | 0 | 0 | 1.000 | 2 | 2 | 1.000 |
| inv(16) | 1 | 0 | 0 | 1.000 | 1 | 0 | .429 |
| Normal | 105 | 23 | 46 | .130 | 16 | 20 | .802 |
| Trisomy 8 | 3 | 0 | 0 | 1.000 | 0 | 3 | .253 |
| 11q23 | 0 | 0 | 0 | 1.000 | 0 | 0 | 1.000 |
| Complex | 4 | 0 | 1 | 1.000 | 1 | 2 | 1.000 |
| Unknown | 8 | 2 | 3 | 1.000 | 2 | 1 | .572 |
| Gene mutation | |||||||
| FLT3-TKD | 0 | 0 | 0 | 1.000 | 0 | 0 | 1.000 |
| CEBPA(sm) | 8 | 2 | 1 | .553 | 3 | 2 | 0.643 |
| CEBPA(dm) | 3 | 0 | 0 | 1.000 | 3 | 0 | 0.073 |
| Induction therapy | |||||||
| (IDA/DNR/ACR) + Ara-C | 108 | 24 | 39 | 1.000 | 17 | 28 | .262 |
| AVVV, BHAC-DM, CAG | 24 | 5 | 6 | .739 | 6 | 7 | 1.000 |
| Others | 14 | 2 | 7 | .473 | 4 | 1 | .155 |
| Stem cell transplantation | |||||||
| All | 65 | 12 | 22 | .821 | 14 | 17 | .801 |
| In CR1 | 31 | 8 | 6 | .130 | 8 | 9 | .777 |
Data are numbers of patients, except as noted. Some data are missing due to the unavailability of certain follow-up data in a retrospective study.
HU, hydroxyurea.
Prognostic impact of AR and allo-HSCT
FLT3-ITD–positive AML patients who did not undergo allo-SCT had significantly less favorable outcome (Figure 3A). In the group in which allo-HSCT was performed, cases with low AR had significantly more favorable outcome in RFS and OS than cases with high AR (RFS: low AR vs high AR, P = .012; OS: low AR vs high AR, P = .004) (Figure 3B). In the group in which allo-HSCT was not performed, no significant difference in RFS and OS was found between the low-AR and high-AR groups, both of which had unfavorable outcomes (RFS: low AR vs high AR, P = .812; OS: low AR vs high AR, P = .967) (Figure 3B) (supplemental Table 1A). Cases with FLT3-ITD low AR are classified by the ELN recommendation as having good prognosis, but in our analysis, cases in this group not undergoing allo-HSCT had a very poor outcome.
![Figure 3. Impact on RFS and OS of FLT3-ITD AR and allo-HSCT. (A) Comparison of RFS (left) and OS (right) with and without allo-HSCT. The group in which transplant was carried out had significantly better OS than the nontransplant group. Additionally, although the difference was not significant, RFS showed a superior tendency in the transplant group compared with the nontransplant group (RFS at 3 years: allo-HSCT [+] 47.4% vs allo-HSCT [−] 9.9%, P = .165; OS at 3 years: allo-HSCT [+] 46.1% vs allo-HSCT [−] 10.1%, P < .001). (B) RFS (left) and OS (right) with and without allo-HSCT and stratified for AR. When analysis was restricted to FLT3-ITD low-AR cases, RFS and OS were again found to be significantly more favorable in the allo-HSCT (+) group than the allo-HSCT (−) group (RFS at 2 years: allo-HSCT [+] group 72.6% vs allo-HSCT [−] group 0.0%, P = .012; OS at 2 years: allo-HSCT [+] group 76.5% vs allo-HSCT [−] group 17.4%, P < .001). Among FLT3-ITD high-AR cases, the transplant group had significantly better OS than the nontransplant group. Additionally, although the difference was not significant, RFS showed a superior tendency in the transplant group compared with the nontransplant group (RFS at 5 years: allo-HSCT [+] group 32.4% vs allo-HSCT [−] group 12.7%, P = .784; OS at 2 years: allo-HSCT [+] group 33.7% vs allo-HSCT [−] group 6.4%, P = .002).](https://ash.silverchair-cdn.com/ash/content_public/journal/bloodadvances/2/20/10.1182_bloodadvances.2018020305/4/m_advances020305f3.png?Expires=1769415596&Signature=4viu6RU64tAuNEI0rAXAVr3juOggbvFhwc1IsOz1dbWjsuRi910hqGL6RQ9AKjQaYEpqhyzjqc6Q12hhVJqUls8nRFqsl82ApiRmPekn2VP-t0gEM~71NgKDRh1YlBIgh3qVy7S7LRSkhHrKfKYWaw~BOHypD4K~tOhiedQtngDhQguYo~QkNmpU5dSIFvc6c6XWE0U1QxqgxJPwKa8k~NrEMwo2qw30Qs6nzntepvgq76avTCSrMt9nC8LJZl3GUlZ2OPnP3LWnVtlvqgRQvrl6YXtnXHmSUJ-xhB7Gi4rq0ZI1GZPES3JW04NTyDN2Au79u1PquOqOW7gAZosCOw__&Key-Pair-Id=APKAIE5G5CRDK6RD3PGA)
Impact on RFS and OS of FLT3-ITD AR and allo-HSCT. (A) Comparison of RFS (left) and OS (right) with and without allo-HSCT. The group in which transplant was carried out had significantly better OS than the nontransplant group. Additionally, although the difference was not significant, RFS showed a superior tendency in the transplant group compared with the nontransplant group (RFS at 3 years: allo-HSCT [+] 47.4% vs allo-HSCT [−] 9.9%, P = .165; OS at 3 years: allo-HSCT [+] 46.1% vs allo-HSCT [−] 10.1%, P < .001). (B) RFS (left) and OS (right) with and without allo-HSCT and stratified for AR. When analysis was restricted to FLT3-ITD low-AR cases, RFS and OS were again found to be significantly more favorable in the allo-HSCT (+) group than the allo-HSCT (−) group (RFS at 2 years: allo-HSCT [+] group 72.6% vs allo-HSCT [−] group 0.0%, P = .012; OS at 2 years: allo-HSCT [+] group 76.5% vs allo-HSCT [−] group 17.4%, P < .001). Among FLT3-ITD high-AR cases, the transplant group had significantly better OS than the nontransplant group. Additionally, although the difference was not significant, RFS showed a superior tendency in the transplant group compared with the nontransplant group (RFS at 5 years: allo-HSCT [+] group 32.4% vs allo-HSCT [−] group 12.7%, P = .784; OS at 2 years: allo-HSCT [+] group 33.7% vs allo-HSCT [−] group 6.4%, P = .002).
Impact on RFS and OS of FLT3-ITD AR and allo-HSCT. (A) Comparison of RFS (left) and OS (right) with and without allo-HSCT. The group in which transplant was carried out had significantly better OS than the nontransplant group. Additionally, although the difference was not significant, RFS showed a superior tendency in the transplant group compared with the nontransplant group (RFS at 3 years: allo-HSCT [+] 47.4% vs allo-HSCT [−] 9.9%, P = .165; OS at 3 years: allo-HSCT [+] 46.1% vs allo-HSCT [−] 10.1%, P < .001). (B) RFS (left) and OS (right) with and without allo-HSCT and stratified for AR. When analysis was restricted to FLT3-ITD low-AR cases, RFS and OS were again found to be significantly more favorable in the allo-HSCT (+) group than the allo-HSCT (−) group (RFS at 2 years: allo-HSCT [+] group 72.6% vs allo-HSCT [−] group 0.0%, P = .012; OS at 2 years: allo-HSCT [+] group 76.5% vs allo-HSCT [−] group 17.4%, P < .001). Among FLT3-ITD high-AR cases, the transplant group had significantly better OS than the nontransplant group. Additionally, although the difference was not significant, RFS showed a superior tendency in the transplant group compared with the nontransplant group (RFS at 5 years: allo-HSCT [+] group 32.4% vs allo-HSCT [−] group 12.7%, P = .784; OS at 2 years: allo-HSCT [+] group 33.7% vs allo-HSCT [−] group 6.4%, P = .002).
In the group in which allo-HSCT was performed in CR1, no significant difference in RFS and OS was found between cases with low AR and those with high AR, with both groups having a favorable outcome (RFS: low AR vs high AR, P = .501; OS: low AR vs high AR, P = .266) (Figure 4A) (supplemental Table 1B).
![Figure 4. Impact on RFS and OS of allo-HSCT in CR1 and FLT3-ITD AR. (A) RFS (left) and OS (right) with and without allo-HSCT in CR1 and stratified for FLT3-ITD AR. Among FLT3-ITD low-AR cases, the group in which transplant was carried out in CR1 had significantly more favorable RFS and OS than the group in which transplant was not carried out in CR1 (RFS at 3 years: allo-HSCT in CR1 [+] group 92.9% vs allo-HSCT in CR1 [−] group 12.8%, P < .001; OS at 4 years: allo-HSCT in CR1 [+] group 66.7% vs allo-HSCT in CR1 [−] group 20.4%, P < .001). Similarly, among FLT3-ITD high-AR cases, RFS and OS were significantly more favorable in the group with transplant in CR1 than in the group without transplant in CR1 (RFS at 3 years: allo-HSCT in CR1 [+] group 85.6% vs allo-HSCT in CR1 [−] group 4.1%, P < .001; OS at 4 years: allo-HSCT in CR1 [+] group 59.3% vs allo-HSCT in CR1 [−] group 9.2%, P < .001). (B) RFS (left) and OS (right) in patients positive for both FLT3-ITD and NPM1 mut, showing results with and without allo-HSCT in CR1 and stratified for FLT3-ITD AR. Among FLT3-ITD low-AR cases, RFS and OS were significantly more favorable in the group with transplant in CR1 than in the group without transplant in CR1 (RFS at 3 years: allo-HSCT in CR1 [+] group 85.7% vs allo-HSCT in CR1 [−] group 15.2%, P = .013; OS at 4 years: allo-HSCT in CR1 [+] group 66.7% vs allo-HSCT in CR1 [−] group 15.6%, P = .003). Among FLT3-ITD high-AR cases similarly, RFS and OS were significantly more favorable in the group with transplant in CR1 than in the group without transplant in CR1 (RFS at 3 years: allo-HSCT in CR1 [+] group 66.7% vs allo-HSCT in CR1 [−] group 0.0%, P = .036; OS at 4 years: allo-HSCT in CR1 [+] group 75.0% vs allo-HSCT in CR1 [−] group 9.9%, P = .030). The group without allo-HSCT in CR1 includes cases that did not receive allo-HSCT.](https://ash.silverchair-cdn.com/ash/content_public/journal/bloodadvances/2/20/10.1182_bloodadvances.2018020305/4/m_advances020305f4.png?Expires=1769415596&Signature=di0aqDflCDtK2MljP3xi-NV~NWoxgWCGpi28LCzgokqmtEK8uYpV2AZjgRcU1Y2wBL1LhZE~pci-AJmGwbRmzwmGkhe9PKA6QD4vxWL1xioT3NNFK~SODkpAJsyzc7W4L4uxVRUMMkb33MaGYLR1bQRTTkB3ga0cGAk-WKuxKS9EmLbD05L78tC8BQYsrmLdhRDs6CdiV8Cdxqc80yGFJpzCeeQS48QPvww~-M53pRiLWIQ7T3fGNnkPKru1ftqMx5pwPHKZuce0Zb9pzmPGO2KZB1EvHvCbaA~Pc0fdkMfI8pFwSLJuo0jh55v3pG8HNc1Ar~UzXRnYGrtE5P-SYw__&Key-Pair-Id=APKAIE5G5CRDK6RD3PGA)
Impact on RFS and OS of allo-HSCT in CR1 and FLT3-ITD AR. (A) RFS (left) and OS (right) with and without allo-HSCT in CR1 and stratified for FLT3-ITD AR. Among FLT3-ITD low-AR cases, the group in which transplant was carried out in CR1 had significantly more favorable RFS and OS than the group in which transplant was not carried out in CR1 (RFS at 3 years: allo-HSCT in CR1 [+] group 92.9% vs allo-HSCT in CR1 [−] group 12.8%, P < .001; OS at 4 years: allo-HSCT in CR1 [+] group 66.7% vs allo-HSCT in CR1 [−] group 20.4%, P < .001). Similarly, among FLT3-ITD high-AR cases, RFS and OS were significantly more favorable in the group with transplant in CR1 than in the group without transplant in CR1 (RFS at 3 years: allo-HSCT in CR1 [+] group 85.6% vs allo-HSCT in CR1 [−] group 4.1%, P < .001; OS at 4 years: allo-HSCT in CR1 [+] group 59.3% vs allo-HSCT in CR1 [−] group 9.2%, P < .001). (B) RFS (left) and OS (right) in patients positive for both FLT3-ITD and NPM1 mut, showing results with and without allo-HSCT in CR1 and stratified for FLT3-ITD AR. Among FLT3-ITD low-AR cases, RFS and OS were significantly more favorable in the group with transplant in CR1 than in the group without transplant in CR1 (RFS at 3 years: allo-HSCT in CR1 [+] group 85.7% vs allo-HSCT in CR1 [−] group 15.2%, P = .013; OS at 4 years: allo-HSCT in CR1 [+] group 66.7% vs allo-HSCT in CR1 [−] group 15.6%, P = .003). Among FLT3-ITD high-AR cases similarly, RFS and OS were significantly more favorable in the group with transplant in CR1 than in the group without transplant in CR1 (RFS at 3 years: allo-HSCT in CR1 [+] group 66.7% vs allo-HSCT in CR1 [−] group 0.0%, P = .036; OS at 4 years: allo-HSCT in CR1 [+] group 75.0% vs allo-HSCT in CR1 [−] group 9.9%, P = .030). The group without allo-HSCT in CR1 includes cases that did not receive allo-HSCT.
Impact on RFS and OS of allo-HSCT in CR1 and FLT3-ITD AR. (A) RFS (left) and OS (right) with and without allo-HSCT in CR1 and stratified for FLT3-ITD AR. Among FLT3-ITD low-AR cases, the group in which transplant was carried out in CR1 had significantly more favorable RFS and OS than the group in which transplant was not carried out in CR1 (RFS at 3 years: allo-HSCT in CR1 [+] group 92.9% vs allo-HSCT in CR1 [−] group 12.8%, P < .001; OS at 4 years: allo-HSCT in CR1 [+] group 66.7% vs allo-HSCT in CR1 [−] group 20.4%, P < .001). Similarly, among FLT3-ITD high-AR cases, RFS and OS were significantly more favorable in the group with transplant in CR1 than in the group without transplant in CR1 (RFS at 3 years: allo-HSCT in CR1 [+] group 85.6% vs allo-HSCT in CR1 [−] group 4.1%, P < .001; OS at 4 years: allo-HSCT in CR1 [+] group 59.3% vs allo-HSCT in CR1 [−] group 9.2%, P < .001). (B) RFS (left) and OS (right) in patients positive for both FLT3-ITD and NPM1 mut, showing results with and without allo-HSCT in CR1 and stratified for FLT3-ITD AR. Among FLT3-ITD low-AR cases, RFS and OS were significantly more favorable in the group with transplant in CR1 than in the group without transplant in CR1 (RFS at 3 years: allo-HSCT in CR1 [+] group 85.7% vs allo-HSCT in CR1 [−] group 15.2%, P = .013; OS at 4 years: allo-HSCT in CR1 [+] group 66.7% vs allo-HSCT in CR1 [−] group 15.6%, P = .003). Among FLT3-ITD high-AR cases similarly, RFS and OS were significantly more favorable in the group with transplant in CR1 than in the group without transplant in CR1 (RFS at 3 years: allo-HSCT in CR1 [+] group 66.7% vs allo-HSCT in CR1 [−] group 0.0%, P = .036; OS at 4 years: allo-HSCT in CR1 [+] group 75.0% vs allo-HSCT in CR1 [−] group 9.9%, P = .030). The group without allo-HSCT in CR1 includes cases that did not receive allo-HSCT.
Among NPM1 mut–positive AML cases with FLT3-ITD where allo-HSCT was performed in CR1, no significant difference in RFS and OS was found between cases with low AR and those with high AR, with both groups having a favorable outcome (RFS: low AR vs high AR, P = .372; OS: low AR vs high AR, P = .695) (Figure 4B) (supplemental Table 1C).
Significance of allo-HSCT in CR1 in cases with low-AR FLT3-ITD
Among cases with low-AR FLT3-ITD, those undergoing allo-HSCT in CR1 had a significantly more favorable outcome than those who did not receive allo-HSCT in CR1 (RFS: P < .001; OS: P < .001) (Figure 4A). Moreover, in cases with low-AR FLT3-ITD, even with stratification for NPM1 mut, those who underwent allo-HSCT in CR1 had a significantly more favorable outcome than those that did not have allo-HSCT in CR1 (RFS P = .013; OS P = .003) (Figure 4B). To allow for the possibility that age influenced the decision on whether to carry out transplant in CR1, an analysis stratified by age of <70 years was performed in the low-AR FLT3-ITD group. However, the result of this stratified analysis also showed that performing transplant in CR1 significantly improved outcome, regardless of whether NPM1 mut was also present (low AR, RFS P < .001; OS P < .001) (low AR + NPM1 mut, RFS P = .044; OS P = .028) (supplemental Figure 4; supplemental Tables 2 and 3).
The findings presented above suggest that prognosis in FLT3-ITD–positive AML could be improved by performing allo-HSCT in CR1 irrespective of FLT3-ITD AR and NPM1 mut.
Prognostic factor analysis
The results of prognostic factor analysis carried out using Cox proportional hazard regression analysis are shown in Table 4. Favorable prognostic factors associated with significant difference in RFS in univariate analysis were white blood cell count of ≤20 × 109/L (HR, 0.415; P < .001), AR <0.5 (HR, 0.460; P = .010), and allo-HSCT in CR1 (HR, 0.083; P < .001). In multivariate analysis, the only favorable prognostic factor associated with significant difference was allo-HSCT in CR1 (HR, 0.066; P < .001). Prognostic factors associated with significant difference in OS in univariate analysis were white blood cell count of 20 × 109/L or below (HR, 0.544; P = .024), age (HR, 1.039; P < .001), AR <0.5 (HR, 0.555; P = .017), allo-HSCT (HR, 0.248; P < .001), and allo-HSCT in CR1 (HR, 0.113; P < .001). In multivariate analysis, the prognostic factor associated with significant difference was age (HR, 1.033; P < .001) and allo-HSCT in CR1 (HR, 0.092; P < .001).
Multivariate analysis of prognostic factor
| Univariate analysis | Multivariate analysis | |||||
|---|---|---|---|---|---|---|
| HR | 95% CI | P | HR | 95% CI | P | |
| RFS | ||||||
| WBC count <20 × 109/L | 0.415 | 0.216-0.800 | <.001 | 1.113 | 0.474-2.614 | .805 |
| Age | 1.017 | 0.998-1.036 | .077 | |||
| Not poor cytogenetic prognosis | 1.008 | 0.245-4.148 | .991 | |||
| AR <0.5 | 0.460 | 0.255-0.830 | .010 | 0.578 | 0.284-1.178 | .135 |
| Presence of NPM1 mut | 1.536 | 0.903-2.614 | .114 | |||
| Allo-HSCT at any time | 0.641 | 0.343-1.197 | .163 | NA | NA | NA |
| Allo-HSCT at CR1 | 0.083 | 0.030-0.234 | <.001 | 0.066 | 0.020-0.218 | <.001 |
| OS | ||||||
| WBC count <20 × 109/L | 0.544 | 0.321-0.924 | .024 | 0.754 | 0.376-1.513 | .427 |
| Age | 1.039 | 1.023-1.055 | <.001 | 1.033 | 1.016-1.051 | <.001 |
| Not poor cytogenetic prognosis | 1.037 | 0.379-2.838 | .944 | |||
| AR <0.5 | 0.555 | 0.343-0.898 | .017 | 0.747 | 0.435-1.286 | .293 |
| Presence of NPM1 mut | 1.313 | 0.846-2.038 | .225 | |||
| Allo-HSCT at any stage | 0.248 | 0.150-0.409 | <.001 | NA | NA | NA |
| Allo-HSCT in CR1 | 0.113 | 0.045-0.281 | <.001 | 0.092 | 0.028-0.302 | <.001 |
HR, hazard ratio; NA, not available.
Discussion
We found that FLT3-ITD low AR with NPM1 mut was not associated with favorable outcome and that careful interpretation was required with respect to the ELN recommendation, which classifies such cases as having favorable prognosis. In FLT3-ITD–positive AML, we additionally found that performing allo-HSCT during CR1 irrespective of AR and NPM1 mut significantly improves outcome. Although FLT3-ITD AR is used in the prognostic stratification of FLT3-ITD–positive AML, low AR was not associated with favorable prognosis and was not a factor influencing therapeutic strategy.
AML with low-AR FLT3-ITD accompanied by NPM1 mut is reported in some studies to have intermediate outcome, with 5-year OS of 35% to 47%,12,22,23,32 while elsewhere it is reported to be associated with good outcome, with a 3-year OS of ∼60%.24 However, as the reports quoted include some whose analysis is restricted to cases with intermediate cytogenetic prognosis23,32 or to cases aged 60 years or below,22 and one that excludes cases having undergone allo-HSCT,24 their results need to be interpreted with care. When our data are supplemented with the findings of these reports, AML with low-AR FLT3-ITD and NPM1 mut appears to be of intermediate outcome, rather than belonging in the favorable prognostic classification proposed by the ELN.
So what should we conclude as to whether to perform allo-HSCT in CR1 for the treatment of AML with low-AR FLT3-ITD combined with NPM1 mut? Pratcorona et al reported no usefulness of allo-HSCT in CR1 in patients who were NPM1 mut–positive and had wild-type or low-AR FLT3-ITD; however, as the group that received allo-HSCT in CR1 did show a clear tendency to more favorable outcome than the group that did not receive allo-HSCT in CR1, questions remain regarding the conclusion of the study.22 Meanwhile, Ho et al report that, in a group with FLT3-ITD AR <0.8, patients who received allo-HSCT in CR1 and those that received chemotherapy without allo-HSCT in CR1 had similar therapeutic outcomes, with a 5-year OS of ∼60%.33 However, no stratification for NPM1 mut was carried out, and in the group that received chemotherapy rather than allo-HSCT in CR1, information is lacking as to whether allo-HSCT was performed after first relapse, making the results difficult to interpret. Kim et al analyzed outcome comparing patients with AF <50% and mutant size <70 bp with other cases.34 Focusing only on patients with a normal karyotype, they found that the group with AF <50% and mutant size <70 bp had a 5-year OS of ∼35%, rising to ∼65% if allo-HSCT was performed, which is equivalent to the outcome associated with wild-type FLT3. However, this study also did not stratify for NPM1 mut and did not indicate at which stage allo-HSCT was performed. We carried out stratification for NPM1 mut in cases with FLT3-ITD low AR, and our analysis took account of the stage at which allo-HSCT was performed, the relapse rate in cases not undergoing allo-HSCT in CR1, and the rate of successful second remission following the first relapse. As a result, we found that allo-HSCT in CR1 significantly improved outcomes in this group of patients. Therefore, in contrast to the ELN recommendation against allo-HSCT in CR1 for NPM1 mut–positive AML with FLT3-ITD low AR, we recommend that NPM1 mut–positive AML with FLT3-ITD low AR should be treated with allo-HSCT in CR1 if a suitable donor is available.
One potential problem with the present study lies in the small number of cases of FLT3-ITD low-AR AML in which allo-HSCT was not performed in CR1. In clinical practice since 2010, based on the view that FLT3-ITD–positive AML patients have poor prognosis, allo-HSCT in CR1 is frequently and actively pursued when a suitable donor is available. We therefore included in the present study a retrospective analysis of cases from a period when genetic mutation analysis was not carried out as a prognostic factor. This makes possible a comparison within FLT3-ITD–positive AML cases between those in which allo-HSCT was carried out in CR1 and those in which it was not. Given the above and the improvement in allo-HSCT treatment techniques, it is possible that our results may have been influenced by the period in which treatment was received. As the present study was a retrospective one, a further problem is that we could not perform an analysis of the reasons why transplant was not possible in CR1 (eg, comorbid infectious disease).
The multikinase inhibitor midostaurin has been shown to improve the therapeutic result when administered concomitantly with chemotherapy.35 In the relevant report, allo-HSCT in CR1 was carried out in 28.1% of the midostaurin group and in 22.7% of the placebo group, and the 4-year OS rate was found to show a more favorable tendency in the midostaurin group. However, as no account was taken of AR, the impact of AR and midostaurin remains unclear. Going forward, it would be helpful to undertake a renewed analysis of prognosis based on the inclusion of AR. In the present study, 5-year OS in the low-AR group was 39.1%. If the use of FLT3 inhibitors and other therapies succeeds in raising OS by ∼10% to 15%, then in the future, patients in the low-AR group might be treated as if they belong to the favorable prognosis group. FLT3 inhibitors may thus make it possible to avoid allo-HSCT.
The present study consisted of a prognostic analysis of AR in FLT3-ITD–positive AML before the advent of FLT3 inhibitors. Going forward, the advent of FLT3 inhibitors may bring about major changes in therapeutic methods and outcomes. For example, Döhner et al report that low-AR FLT3-ITD patients with NPM1 mut have a 5-year OS of ∼50% with chemotherapy alone, indicating intermediate prognosis as in our findings, but that chemotherapy supplemented with FLT3 inhibitor treatment may improve 5-year OS to ∼70%, placing these patients in the favorable prognosis group.36
For the present, however, we recommend allo-HSCT in CR1 for FLT3-ITD–positive AML in cases where a suitable donor is available, regardless of whether NPM1 mut is also present.
The full-text version of this article contains a data supplement.
Acknowledgment
The authors thank the physicians who cared for patients and collected clinical data during this study.
Authorship
Contribution: M.S. and H.Y. were the principal investigators and take primary responsibility for the paper; Y.N., K.U., T.U., I. Oh, S.M., E.K., N. Uoshima, Y. Kobayashi, S. Kako, K.T., S.G., K.S., K. Kayamori, M.H., J. Kanda, H.U., J. Kuroda, N. Uchida, Y. Kubota, S. Kimura, S. Kurosawa, K. Kakihana, Y. Kanda, T.F., and. K.O. recruited the cases; M.S., H.Y., N.N., K.A., and T.K. performed the laboratory work for the study; and M.S., H.Y., N.N., A.M., I. Omori, Y.F., S.Y., S.W., and K.I. analyzed the data and wrote the paper.
Conflict-of-interest disclosure: The authors declare no competing financial interests.
Correspondence: Hiroki Yamaguchi, Department of Hematology, Nippon Medical School, 1-1-5 Sendagi, Bunkyo-Ku, Tokyo 113-8603, Japan; e-mail: y-hiroki@fd6.so-net.ne.jp.

