

Key Points
MRTFAOE promotes megakaryocytic maturation.
Both SRF/ternary complex factor and SRF/MRTFA regulatory axes play a role in megakaryopoiesis.

Abstract
Serum response factor (SRF) is a ubiquitously expressed transcription factor that binds DNA at CArG (CC[A/T]6GG) domains in association with myocardin-family proteins (eg, myocardin-related transcription factor A [MRTFA]) or the ternary complex factor family of E26 transformation-specific (ETS) proteins. In primary hematopoietic cells, knockout of either SRF or MRTFA decreases megakaryocyte (Mk) maturation causing thrombocytopenia. The human erythroleukemia (HEL) cell line mimics the effects of MRTFA on Mk maturation, and MRTFA overexpression (MRTFAOE) in HEL cells enhances megakaryopoiesis. To identify the mechanisms underlying these effects, we performed integrated analyses of anti-SRF chromatin immunoprecipitation (ChIP) and RNA-sequencing data from noninduced and phorbol ester (12-O-tetradecanoylphorbol-13-acetate [TPA])–induced HEL cells, with and without MRTFAOE. We found that 11% of genes were upregulated with TPA induction, which was enhanced by MRTFAOE, resulting in an upregulation of 25% of genes. MRTFAOE increased binding of SRF to genomic sites and enhanced TPA-induced expression of SRF target genes. The TPA-induced genes are predicted to be regulated by SRF and ETS factors, whereas those upregulated by TPA plus MRTFAOE lack ETS binding motifs, and MRTFAOE skews SRF binding to genomic regions with CArG sites in regions relatively lacking in ETS binding motifs. Finally, ChIP–polymerase chain reaction using HEL cells and primary human CD34+ cell–derived subpopulations confirms that both SRF and MRTFA have increased binding during megakaryopoiesis at upregulated target genes (eg, CORO1A). We show for the first time that MRTFA increases both the genomic association and activity of SRF and upregulates genes that enhance primary human megakaryopoiesis.
Introduction
Serum response factor (SRF) is a major regulator of immediate early and cytoskeletal genes.1 The specificity of SRF’s transcriptional activity is regulated predominantly through its association with transcription coactivators, including those from the ternary complex factor (TCF) family, such as the E26 transformation-specific (ETS)–like transcription factors ELK1, ELK3, and ELK4,2,3 which are activated downstream of MAPK signaling, and the myocardin family,4-7 which is activated to localize in the nucleus by RhoA signaling and subsequent actin polymerization. The association of SRF and myocardin-related transcription factor A (MRTFA) and MRTFB is critical for megakaryocyte (Mk) maturation, as mice with conditional knockout of SRF in the Mk lineage show abnormal Mk maturation and thrombocytopenia,8 and those with a knockout of MRTFA also exhibit blocked Mk maturation,9 which is exacerbated when both MRTFA and MRTFB are knocked out.10 However, the mechanism by which SRF and MRTFA regulate Mk maturation remains to be elucidated.
The consensus binding sequence for SRF is variably referred to as the SRF response element,5,11-13 or CArG box, for the CC-AT-rich-GG (CC[A/T]6GG) domain. Although not present at all SRF binding domains, “perfect” CArG boxes are greatly enriched at the cytoskeletal genes14-17 that are induced by the SRF/MRTFA regulatory complex in NIH3T3 fibroblasts in response to RhoA activation downstream of serum administration. In contrast, “constitutive” SRF binding sites (where serum stimulation does not alter SRF binding) tend to be non-CArG or “imperfect” CArG sites with 2 or more mismatches.16 When activated by association with TCFs in response to MAPK signaling, SRF promotes the expression of genes associated with signaling and proliferation,18 and the SRF binding domains are enriched for both CArG boxes and ETS binding domains.17
We previously showed that nuclear localization of MRTFA is induced by RhoA activation in primary Mks in response to thrombopoietin, and in HEL cells in response to the phorbol ester TPA (12-O-tetradecanoylphorbol-13-acetate).19 However, the direct and indirect targets of this activation in the context of Mk maturation are not known. Here, for the first time, we examine the genomic binding of the SRF/MRTFA complex and the consequent gene regulation changes during human Mk differentiation. Specifically, we used integrative analysis of chromatin immunoprecipitation (ChIP) and RNA-sequencing (RNA-seq) data from HEL cells with doxycycline-inducible MRTFA overexpression (MRTFAOE) and primary human CD34+ cell–derived Mk populations. We found that MRTFAOE during Mk maturation enhances the SRF/MRTFA regulatory axis and may suppress the normally active SRF/TCF axis. By promoting stronger and prolonged genomic binding of SRF, particularly at perfect CArG sites, MRTFAOE upregulates genes that enhance Mk maturation. Many of the SRF binding sites, both with and without MRTFAOE, were associated with genes whose expression increases in primary human Mks during differentiation.
Methods
Culture of HEL cells and primary human cells
HEL cells were cultured and induced with TPA as described previously.9 Primary human cells were immunomagnetically isolated for CD34 as previously described20 from granulocyte colony-stimulating factor–mobilized peripheral blood mononuclear cells from healthy donors. For RNA-seq, the primary cells were first expanded for 6 days in StemSpan with 1× CC100 cytokine cocktail (Stem Cell Technologies), and then transferred to medium containing 100 ng/mL thrombopoietin (TPO) and 20 ng/mL stem cell factor (SCF) for an additional 9 days to induce Mk maturation. RNA was isolated from total cells on day 6 and from CD41+ cells selected on a FACS Aria system (BD Biosciences) on days 9, 12, and 15. For ChIP–polymerase chain reaction (PCR) analysis, CD34+ cells were expanded for 4 days in StemSpan with 25 ng/mL TPO, 25 ng/mL SCF, and 10 ng/mL interleukin-3 (IL-3) (all from ConnStem, CT), and then differentiated for 3 days in StemSpan with 50 ng/mL TPO, 10 ng/mL SCF, 10 ng/mL IL-6, and 10 ng/mL IL-9 (all from ConnStem). On day 7, cells were fluorescence-activated cell sorted for CD41−CD42− monocytes, CD41+CD42− early Mks, and CD41+CD42+ mature Mks for chromatin preparation.
ChIP and real-time PCR analysis
ChIP was performed in 96-well plates as previously described21 using anti-MRTFA and anti-SRF antibodies; immunoglobulin G control antibody was used for the control immunoprecipitation condition. Precipitated DNA was purified in a 100-μL final volume. Input DNA was purified from 10% of the amount of total DNA used in the immunoprecipitations. ChIP assays were repeated at least 3 times. The 5-μL reaction mixtures for real-time PCR each contained 2.5 μL 2× SYBR green PCR master mix (SensiMix; Quantace), 2 μL DNA template, and 10 μM primers (each) and were added to 384-well plates. PCR reactions were run in triplicates. Standard dilutions of genomic DNA were included in each PCR run. Amplification (3 steps, 40 cycles), data acquisition, and analysis were carried out using the 7900HT real-time PCR system and SDS Enterprise Database software (Applied Biosystems). Transcription factor levels at DNA sites of interest were calculated as detailed in Flanagin et al.21 Primer sequences are available upon request.
RNA-seq
RNA was extracted with Trizol and purified using the RNeasy Mini Kit columns from Qiagen (Hilden, Germany). RNA was eluted in a total of 20 μL Tris-EDTA buffer and quantified using a standard NanoDrop device. The sequencing was carried out on Illumina HiSeq 2000 systems as single-end 50-mer reads. For primary human Mk differentiation, 34-bp single-end HiSeq 2000 Illumina reads were obtained after base calling in the Solexa Pipeline version 0.2.2.6. RNA-seq reads were mapped to the human genome using Illumina’s ELAND software. Levels of gene expression were quantified using the ERANGE package.22 Reads that were uniquely mapped within any exons of University of California, Santa Cruz gene models (hg18) were counted. Reads that fell onto exons were summed up for each locus and normalized by the predicted messenger RNA (mRNA) length reads per kilobase per million reads (RPKM). Reads mapped to >1 genomic location were combined with uniquely mapped reads to produce a final RPKM, using the procedure defined for ERANGE,22 by calculating the probability that a multiread came from a particular known or candidate exon based on the distribution of counts of uniquely mapped reads in each exon. The resulting fractional counts were added to the total count for the gene locus, which was renormalized into a multi RPKM.
Data access
ChIP-seq and RNA-seq data are available under Gene Expression Omnibus accession number GSE112279.
Results
MRTFAOE promotes maturation including polyploidization
MRTFAOE increases Mk maturation and polyploidization in both HEL cells and primary human cells.9 Figure 1A shows doxycycline-induced (Dox+) overexpression of MRTFA in HEL cells, 24 hours after addition of Dox. When HEL cells are TPA induced to mature down the Mk lineage for 4 days in the presence of Dox, they acquire significantly higher 8N and 16N ploidy (P < .001), compared with those without Dox.
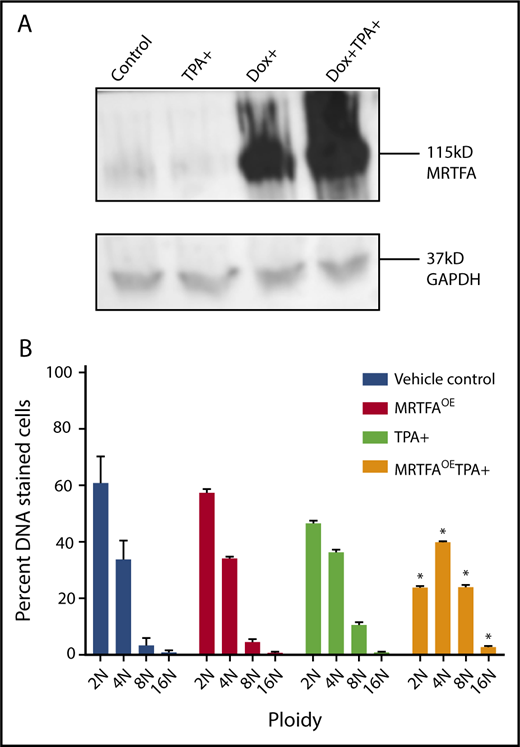
MRTFAOEin HEL cells increases ploidy. (A) Western blot shows Dox-inducible MRTFAOE. Cells were either left untreated (control) or induced for 24 hours with 15 nM TPA, 10 ng/mL Dox, or both Dox and TPA. Glyceraldehyde-3-phosphate dehydrogenase (GAPDH) was used as a loading control. (B) Same cells have significantly higher 8N and 16N ploidy states when treated with Dox and TPA for 4 days (n = 3). Asterisks represent significant differences (P ≤ .001) from TPA-induced cells with no Dox.
MRTFAOEin HEL cells increases ploidy. (A) Western blot shows Dox-inducible MRTFAOE. Cells were either left untreated (control) or induced for 24 hours with 15 nM TPA, 10 ng/mL Dox, or both Dox and TPA. Glyceraldehyde-3-phosphate dehydrogenase (GAPDH) was used as a loading control. (B) Same cells have significantly higher 8N and 16N ploidy states when treated with Dox and TPA for 4 days (n = 3). Asterisks represent significant differences (P ≤ .001) from TPA-induced cells with no Dox.
MRTFAOE increases SRF binding to the genome during Mk maturation
Anti-SRF ChIP-seq was carried out in HEL cells that were untreated or TPA induced in the presence and absence of Dox-induced MRTFAOE. The number of dynamic SRF peaks increases when TPA-induced HEL cells have MRTFAOE. Relative to that in untreated cells, SRF binding is increased at 1422 sites and decreased at 708 sites in the MRTFAOETPA+ group, whereas binding is increased at only 211 sites and decreased at 278 with TPA alone (see absolute numbers and percentages in supplemental Table 1).
We compared the SRF binding sites between the untreated and TPA+ groups and identified sites with changes in SRF binding. The total read counts are shown in Table 1. To compare SRF binding at multiple locations between samples (Figure 2A), we constructed metaprofile graphs showing the normalized per kilobase per million mapped reads within 1500 bp from the centers of the peaks. The intensities of these peaks were then compared with those of equivalent peaks obtained from cells with MRTFAOE and those with MRTFAOE and TPA treatment (MRTFAOETPA+). In the MRTFAOE group without TPA treatment, the intensities of peaks for both binding categories (ie, increased and decreased SRF binding) were similar to those of the untreated control group, consistent with the cytoplasmic localization of MRTFA in the absence of TPA.19 When comparing the peaks from cells treated with TPA, the peak for normalized reads for increased binding was much higher in the MRTFAOETPA+ group, indicating that MRTFAOE enhanced the TPA-induced association of SRF with these genomic regions. For those regions with decreased SRF binding in response to TPA, there was in contrast very little change between untreated and MRTFAOETPA+ groups, indicating that MRTFAOE may prevent SRF from being dislodged.
Read counts and peak counts for anti-SRF ChIP-seq samples
| Sample | Replicate no. | No. of reads, ×106 | No. of common peaks |
|---|---|---|---|
| Untreated | 1 | 16.6 | 2412 |
| 2 | 21.7 | ||
| TPA+ | 1 | 14.9 | 1137 |
| 2 | 21.3 | ||
| MRTFAOE | 1 | 12.9 | 2780 |
| 2 | 29.4 | ||
| MRTFAOETPA+ | 1 | 17.0 | 4842 |
| 2 | 16.8 |
| Sample | Replicate no. | No. of reads, ×106 | No. of common peaks |
|---|---|---|---|
| Untreated | 1 | 16.6 | 2412 |
| 2 | 21.7 | ||
| TPA+ | 1 | 14.9 | 1137 |
| 2 | 21.3 | ||
| MRTFAOE | 1 | 12.9 | 2780 |
| 2 | 29.4 | ||
| MRTFAOETPA+ | 1 | 17.0 | 4842 |
| 2 | 16.8 |
Groups were either untreated or induced for 24 hours with 15 nM phorbol ester TPA (TPA+) or induced for 24 hours with 10 ng/mL Dox (MRTFAOE).
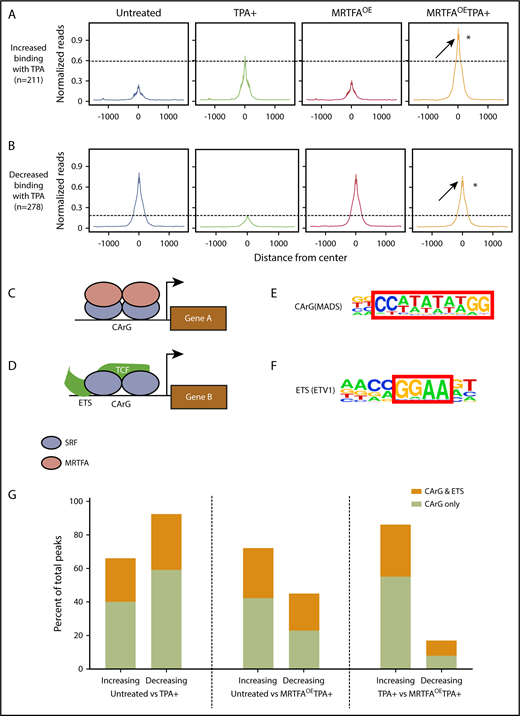
MRTFAOEleads to retention of SRF binding at CArG sites. Metaprofiles of binding sites for all treatment groups for peaks that increase (A; 211 peaks) or decrease (B; 278 peaks) when HEL cells are treated with TPA. Reads were normalized to per kilobase per million mapped reads. Average intensity of SRF binding was calculated from the center of each peak in a ±1500-bp window. Visually, the confidence interval is represented by a ribbon, which includes 95% of the sampled values. In both panels A and B, SRF binding in the MRTFAOETPA+ group is higher than in the TPA+ group, suggesting increased SRF binding to chromatin in the presence of excess MRTFA. *P ≤ 10−8 vs TPA+. (C) Schematic representing the current understanding of the SRF/MRTFA regulatory axis based on studies in fibroblasts. MRTFA dimers bind to SRF dimers, which are positioned at a CArG site in the serum response element, to activate expression of downstream genes. (D) In the SRF/TCF regulatory axis, TCF binds to SRF dimers positioned at a CArG site as well as an upstream ETS motif to activate gene expression. (E-F) CArG and ETS motifs used to query SRF binding sites with HOMER (hypergeometric optimization of motif enrichment). (G) Percentages of SRF binding sites in HEL cells with CArG motifs or cooccurring CArG and ETS motifs that either increase or decrease between 3 different comparison groups. MRTFAOE augments SRF recruitment and abrogates loss of SRF from CArG motifs.
MRTFAOEleads to retention of SRF binding at CArG sites. Metaprofiles of binding sites for all treatment groups for peaks that increase (A; 211 peaks) or decrease (B; 278 peaks) when HEL cells are treated with TPA. Reads were normalized to per kilobase per million mapped reads. Average intensity of SRF binding was calculated from the center of each peak in a ±1500-bp window. Visually, the confidence interval is represented by a ribbon, which includes 95% of the sampled values. In both panels A and B, SRF binding in the MRTFAOETPA+ group is higher than in the TPA+ group, suggesting increased SRF binding to chromatin in the presence of excess MRTFA. *P ≤ 10−8 vs TPA+. (C) Schematic representing the current understanding of the SRF/MRTFA regulatory axis based on studies in fibroblasts. MRTFA dimers bind to SRF dimers, which are positioned at a CArG site in the serum response element, to activate expression of downstream genes. (D) In the SRF/TCF regulatory axis, TCF binds to SRF dimers positioned at a CArG site as well as an upstream ETS motif to activate gene expression. (E-F) CArG and ETS motifs used to query SRF binding sites with HOMER (hypergeometric optimization of motif enrichment). (G) Percentages of SRF binding sites in HEL cells with CArG motifs or cooccurring CArG and ETS motifs that either increase or decrease between 3 different comparison groups. MRTFAOE augments SRF recruitment and abrogates loss of SRF from CArG motifs.
MRTFAOE retains SRF binding at CArG sites
In contrast to SRF/MRTFA, SRF/TCF complexes preferentially bind CArG sites adjacent to ETS consensus binding sites17 (Figure 2C-D). However, MRTFs compete with TCF cofactors for SRF binding at all CArG sites.18,23 To identify which cofactors are likely to partner with SRF during Mk maturation, we investigated the consensus binding motifs present in anti-SRF immunoprecipitated chromatin. HOMER (hypergeometric optimization of motif enrichment)24 identified CArG and ETS motifs with binding to SRF (Figure 2E-F) that either increased, decreased, or remained unchanged by TPA treatment with/without MRTFAOE. As shown in Figure 2G, SRF peaks that increased and decreased in response to TPA were enriched for CArG sites with and without associated ETS consensus motifs, suggesting that both the SRF/TCF and SRF/MRTFA regulatory axes may play roles in TPA-mediated Mk maturation. Increased and decreased binding of SRF to both types of sites was also observed for TPA-treated cells with MRTFAOE (Figure 2G, center). In this MRTFAOETPA+ group, ∼40% of peaks for decreased SRF associations have perfect CArG sites, whereas ∼90% of decreasing peaks from cells treated with TPA alone were enriched for the CArG motif (Figure 2G, left). Additionally, MRTFAOE reduced the proportion of these regions with adjacent ETS sites (33% for TPA+ vs 22% for MRTFAOETPA+), consistent with MRTFAOE retaining SRF binding at CArG sites.
RNA-seq reveals that MRTFA enhances expression of Mk-associated genes during maturation
As the data demonstrate that MRTFAOE enhances the binding of SRF to the genome in HEL cells, RNA-seq was used to identify accompanying gene expression changes during maturation. Unsupervised hierarchical clustering (Figure 3A) revealed that replicates from all treatment groups cluster together and that an MRTFA-induced gene expression pattern underlies the enhanced Mk maturation. See supplemental Figure 2 and supplemental Table 9 for top 50 increasing and decreasing genes for each of the 3 comparison groups. The untreated and MRTFAOE groups cluster together, as do the TPA+ and MRTFAOETPA+ groups. Thus, MRTFAOE by itself does not profoundly affect the pattern of gene expression; analysis of the untreated vs MRTFAOE groups (adjusted P ≤ .05, fold change ≥2) revealed 93 genes that were upregulated and 6 that were downregulated by MRTFAOE (see supplemental Table 7 for a detailed list of the genes). As expected, upregulated genes were enriched for cytoskeletal genes (P = 4.2 × 10⁻²) with predicted regulation by SRF.25
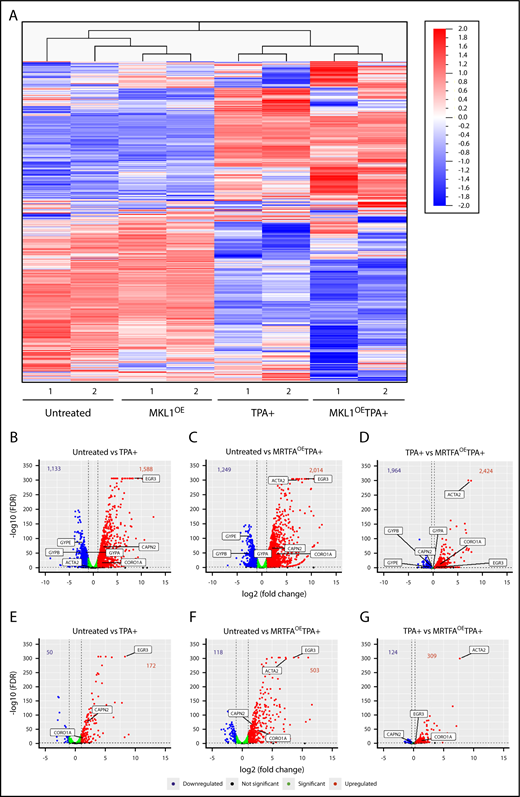
RNA expression and integrated analyses. (A) Heat map for unsupervised hierarchical clustering of all 13 506 genes expressed at least once in 1 of the 8 samples. Untreated and TPA-treated HEL cells clustered together, as expected. Changes in gene expression between the untreated and MRTFAOE cells are also apparent. (B-D) Volcano plots showing significantly upregulated (red) and downregulated (blue) genes for each of the comparison groups. Several significant genes are labeled on each plot. Bold numbers at the top of each plot represent the number of genes upregulated and downregulated. The dotted vertical lines represent thresholds of twofold change (log2 = 1) in panel B and 20% in panel D. The false discovery rate (FDR) thresholds were set at ≤0.05, represented by the dotted horizontal lines. Green dots represent genes that reached statistical significance but changed by less than twofold (B-C) and <20% (D). (E-G) Volcano plots representing the expression of genes that have an associated SRF peak with labeling as in panels B-D.
RNA expression and integrated analyses. (A) Heat map for unsupervised hierarchical clustering of all 13 506 genes expressed at least once in 1 of the 8 samples. Untreated and TPA-treated HEL cells clustered together, as expected. Changes in gene expression between the untreated and MRTFAOE cells are also apparent. (B-D) Volcano plots showing significantly upregulated (red) and downregulated (blue) genes for each of the comparison groups. Several significant genes are labeled on each plot. Bold numbers at the top of each plot represent the number of genes upregulated and downregulated. The dotted vertical lines represent thresholds of twofold change (log2 = 1) in panel B and 20% in panel D. The false discovery rate (FDR) thresholds were set at ≤0.05, represented by the dotted horizontal lines. Green dots represent genes that reached statistical significance but changed by less than twofold (B-C) and <20% (D). (E-G) Volcano plots representing the expression of genes that have an associated SRF peak with labeling as in panels B-D.
Expression of 1588 genes increased and 1133 genes decreased with TPA treatment (Figure 3B) (adjusted P ≤ .05, fold change ≥2; complete gene lists in supplemental Table 7). Consistent with TPA inducing the transition of HEL cells from their quasi-bipotent precursor state toward mature Mk-like cells, the expression of erythroid genes, such as the glycophorins (GYPA, GYPB, and GYPE), significantly decreased. In comparison with untreated cells, the MRTFAOETPA+ group exhibited an increase and decrease in 2014 (27% more than TPA alone) and 1249 genes, respectively, including downregulation of the erythroid genes KLF1, GYPB, and GYPE (Figure 3C; supplemental Table 7). The upregulated genes are enriched for megakaryocytic (eg, VWF) and cytoskeletal (eg, ACTA2 and CORO1A) groups, with highly statistically significant occurrence (Bonferroni = 4.821E-11) in the Gene Ontology (GO) actin binding molecular pathway (Table 2). Most strikingly, the predicted transcription factors for the upregulated genes are ETS factors (including TCFs) and SRF, consistent with the ChIP-seq data showing that MRTFAOE enhances the binding of SRF to CArG sites both with and without associated ETS consensus binding domains.
GO functional analysis of upregulated genes
| Comparison | Molecular function | Cellular component | Predicted regulators or transcription factors |
|---|---|---|---|
| Untreated vs TPA+ (n = 1588) | Receptor binding (3.869E-18) | Cell surface (7.427E-25) | ETS (4. 039E-18) |
| Integrin binding (3.510E-10) | Integral component of plasma membrane (3.186E-23) | AP1 (5.373E-14) | |
| PU1 (1.352E-6) | |||
| BACH1 (2.647E-5) | |||
| Untreated vs MRTFAOETPA+ (n = 2014) | Receptor binding (5.415E-14) | Cell surface (1.076E-22) | ETS (2.646E-20) |
| Actin binding (4.831E-11) | Integral component of plasma membrane (2.313E-21) | AP1 (2.517E-12) | |
| SRF (9.979E-11) | |||
| TPA+ vs MRTFAOETPA+ (n = 2424) | Actin binding (2.135E-5) | Actin cytoskeleton (9.530E-7) | SRF (1.078E-10) |
| Cytoskeletal protein binding (1.065E-3) | Focal adhesion (2.590E-6) |
HEL cell TPA induction upregulates genes likely regulated by TCF factors (ETS, PU1), suggesting potential regulation via the SRF/TCF axis. With MRTFAOE, upregulated genes are significantly related to actin binding, and predicted regulators include both ETS factors (perhaps as part of the SRF/TCF complex) and SRF. When comparing TPA+ and MRTFAOETPA+ groups, actin cytoskeleton becomes the major GO term common to the upregulated genes, and SRF stands out as the only predicted regulatory transcription factor. Numbers in parentheses denote Bonferroni-corrected P values.
The upregulation of cytoskeletal genes via SRF/MRTFA becomes even more evident in the direct comparison of the TPA+ and MRTFAOETPA+ groups (Figure 3D). For this comparison, we decreased the fold change threshold to a 20% increase (log2 fold change ≥0.26) or 20% decrease (log2 fold change ≤−0.32) to include genes that may already be up- or downregulated with TPA but change further with MRTFAOE. This yielded 2424 upregulated and 1964 downregulated genes, including a further decrease in erythroid-associated genes (Figure 3D; supplemental Table 7). GO analysis revealed that the upregulated genes are enriched for SRF-regulated and actin cytoskeleton associated genes (Table 2).
Genes that increase in expression with TPA-induced maturation parallel those induced when primary human cells undergo Mk maturation in vitro. For primary cells, comparison of RNA-seq data from 6 days of expansion and the subsequent 3, 6, and 9 days of differentiation revealed 1692 genes that increased more than twofold from day 6 (before Mk maturation) to day 15. Although some of these genes, such as CD41 and CD61, were already expressed by untreated HEL cells, TPA induction (both with and without MRTFAOE) induced upregulation of ∼200 Mk-associated genes, including VWF, KALRN, GFI1B, MYLK, FYN, GP1BB, GP5, GP9, SELP, and TBXA2R (genes upregulated in both TPA-induced HEL cells and in primary human cells are listed in supplemental Table 4). Promoter motif analysis19 of the these genes indicated that many could be regulated by ETS factors, consistent with published data suggesting that TCFs, including ETS proteins,26 play a role in TPA-induced gene activation in fibroblasts.18 GO revealed enrichment for genes involved in integrin and receptor binding, which are important for Mk maturation and subsequent platelet formation.27
Integrated ChIP- and RNA-seq analysis reveals that MRTFAOE increases SRF-associated gene upregulation
For an integrative analysis of the anti-SRF ChIP-seq and RNA-seq data, we evaluated the differentially expressed genes for associated SRF binding between the untreated and TPA+ (Figure 3E) or MRTFAOETPA+ (Figure 3F) groups and between the TPA+ and MRTFAOETPA+ groups (Figure 3G). We used a broad gate, defining SRF-associated genes as those with a peak located anywhere from 2 Mb upstream to 3 Mb downstream of the transcription start site (supplemental Table 8). With TPA treatment, 10.8% (172 of 1588) of upregulated genes had associated SRF peaks (Figure 3E). GO analysis revealed that both CArG and ETS consensus binding motifs are overrepresented for the upregulated genes (Table 3). With the combination of TPA and MRTFAOE, 25% (503 of 2014) of upregulated genes had associated SRF peaks, and only 9.4% (118 of 1249) of downregulated genes had SRF peaks (Figure 3F; Figure 4 shows percentages of genes with differential gene expression that have SRF peaks). As expected, the upregulated genes are enriched for cytoskeletal and actin GO terms, with SRF as the most likely regulatory transcription factor (only transcription factor in the top 5 terms) (Figure 3F and Table 3). For TPA-treated cells, 13% (309 of 2424) of genes upregulated by MRTFAOE were SRF associated (Figure 3G). Not surprisingly, these strongly correlate with actin and cytoskeleton GO terms and are most likely to be regulated by SRF (only transcription factor in the first 6 terms) (Table 3). Approximately 16% (309/1964) of the downregulated genes also had associated SRF peaks (see Figure 4A).
GO functional analysis of upregulated genes with associated SRF peaks
| Comparison | Molecular function | Cellular component | Predicted regulators or transcription factors |
|---|---|---|---|
| Untreated vs TPA+ (n = 172) | Cytoskeletal protein binding (5.295E-7) | Focal adhesion (6.179E-7) | SRF (3.223E-8) |
| ETS (2.335E-6) | |||
| Untreated vs MRTFAOETPA+ (n = 503) | Cytoskeletal protein binding (4.063E-14) | Focal adhesion (1.493E-17) | SRF (2.045E-14) |
| Actin binding (2.414E-13) | |||
| TPA+ vs MRTFAOETPA+ (n = 309) | Actin binding (1.157E-4) | Actin cytoskeleton (9.147E-7) | SRF (8.993E-14) |
| Actin filament binding (6.680E-3) | Focal adhesion (6.257E-6) |
With MRTFAOE, the SRF/MRTFA regulatory axis takes precedence in HEL cell TPA-induced maturation. Binding site analysis of the genes, with an associated SRF peak, upregulated during TPA induction predicts both SRF and ETS as regulatory transcription factors. When comparing untreated and MRTFAOETPA+ groups, the actin cytoskeleton becomes the predominant molecular function, and SRF is the major transcription factor. When comparing TPA+ and MRTFAOETPA+ groups, actin cytoskeletal pathways become more significant, and SRF is also a more significant predicted transcription factor. Numbers in parentheses denote Bonferroni-corrected P values.
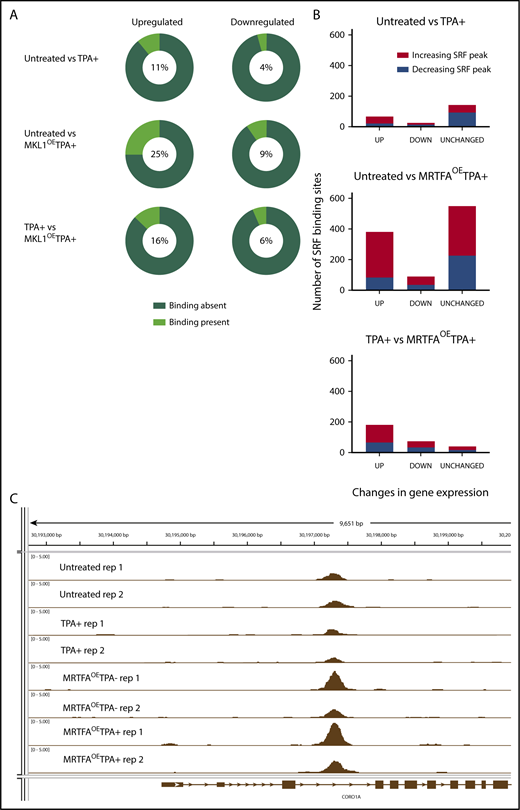
MRTFAOEenhances associations between SRF binding and genes with altered expression. (A) Pie charts illustrating the relationship between dynamic gene expression and SRF binding of those genes. The percentage of genes that have at least 1 associated SRF binding site is shown in the middle of each pie chart and is indicated by the light green wedge. MRTFAOE during megakaryopoiesis increases the probability of SRF binding close to genes that are upregulated by TPA and MRTFAOE. (B) Changes in SRF binding among genes that are upregulated, downregulated, or unchanged for each comparison. MRTFAOE increases not only the number of upregulated genes, but also the SRF binding to these genes during maturation. (C) Integrative Genome Viewer screenshot of SRF binding proximal to the CORO1A locus. MRTFAOE in HEL cells increases the recruitment of SRF. Replicates of each group are shown. All tracks are normalized in bigwig format.
MRTFAOEenhances associations between SRF binding and genes with altered expression. (A) Pie charts illustrating the relationship between dynamic gene expression and SRF binding of those genes. The percentage of genes that have at least 1 associated SRF binding site is shown in the middle of each pie chart and is indicated by the light green wedge. MRTFAOE during megakaryopoiesis increases the probability of SRF binding close to genes that are upregulated by TPA and MRTFAOE. (B) Changes in SRF binding among genes that are upregulated, downregulated, or unchanged for each comparison. MRTFAOE increases not only the number of upregulated genes, but also the SRF binding to these genes during maturation. (C) Integrative Genome Viewer screenshot of SRF binding proximal to the CORO1A locus. MRTFAOE in HEL cells increases the recruitment of SRF. Replicates of each group are shown. All tracks are normalized in bigwig format.
The maximum overlap between the genes and associated SRF peaks is found when comparing the MRTFAOETPA+ and untreated groups, consistent with MRTFA enhancing SRF-mediated transcription. In this comparison, the percentage of upregulated genes with associated SRF binding (25%) is more than double that when comparing the TPA+ only and untreated groups. Some up-/downregulated genes had >1 SRF peak (for example, ACTA2) (supplemental Table 3A-C). As we previously showed that overexpressed MRTFA does not accumulate in the nuclei of HEL cells in the absence of TPA,19 MRTFAOE had a weaker effect than the combined treatment. Of the 93 genes that were upregulated in response to MRTFAOE in the absence of TPA, 62 (66%) had associated SRF binding, and the SRF binding levels did not change significantly.
MRTFAOE during Mk maturation reveals association between SRF binding and gene expression changes
To understand the associations of SRF binding and gene expression changes, we divided the various gene expression changes (supplemental Figure 1) according to those with increased and decreased SRF binding (Figure 4B, red and blue, respectively). The large majority of upregulated genes or genes that remained unchanged were those that showed increased SRF binding. This trend is most pronounced for genes upregulated with MRTFAOE and TPA treatment, compared to untreated cells. (42%; see also supplemental Table 2A-C for detailed values). These data suggest that MRTFAOE enhances SRF-induced transcriptional upregulation in megakaryopoiesis. The same, but less profound, trend was observed when comparing the MRTFAOETPA+ group with the TPA+ group, in which ∼30% of the genes that were up-/downregulated showed increased SRF binding. By comparison, ∼20% of genes that were up-/downregulated by TPA treatment alone had increased SRF binding (supplemental Table 2A), suggesting that the MRTFAOE-driven upregulation of cytoskeletal genes may be under both direct and indirect control of SRF. Of note, a substantial proportion of the genes analyzed (40% to 66%), including those that are up-/downregulated, or unchanged in the various group comparisons, show unaltered SRF binding (supplemental Figure 1; supplemental Table 2C), which is consistent with the fibroblast model,16 where SRF is poised at regulatory regions prior to activation by cofactors.
Binding of MRTFA to the genome is augmented during TPA-induced Mk maturation
To assess MRTFA association with the genome, we performed a preliminary anti-MRTFA and anti-SRF ChIP-seq experiment in HEL cells with and without TPA treatment of 0.5, 6, and 24 hours (supplemental Table 5). Although there were 2 replicates each for HEL cells treated with TPA for 0, 0.5, 6, and 24 hours, no time-dependent analysis was performed on these data because of high background levels, but the presence of MRTFA peaks was used for further validation and quantification using anti-MRTFA ChIP-PCR. Peak calling by model-based analysis of ChIP-seq identified a total of 156 genomic sites where MRTFA and SRF peaks overlap (supplemental Materials and methods), many of which were genes important in Mk maturation, such as KALRN, ARHGEF2, and FLNA.
To identify genomic regions important for MRTFA-induced Mk maturation, we identified sites where (1) SRF binding increases in the MRTFAOETPA+ group compared with untreated cells, (2) MRTFA is bound on the basis of anti-MRTFA ChIP-seq, and (3) the associated gene is upregulated during maturation, and we performed confirmatory anti-SRF and anti-MRTFA ChIP-PCR for all 4 HEL treatment groups. SRF binding at predicted sites changed more dramatically between MRTFAOE and MRTFAOETPA+ groups than between untreated and TPA+ groups (Figure 5A; supplemental Figure 4). EGR3 and FLNA were used as controls for regions where SRF binding was strong but did not change in response to TPA with MRTFAOE, and the last exon of NANOG was used as the negative control. Another control was NOP14, a region where SRF binding decreased with TPA treatment according to both anti-SRF ChIP-seq and ChIP-PCR. Significant changes in SRF binding between TPA+ and MRTFAOETPA+ groups were observed at LRP12, RASSF2, WWC1, CORO1A, ANKDD1A, and ACTA2 sites (P ≤ .07).
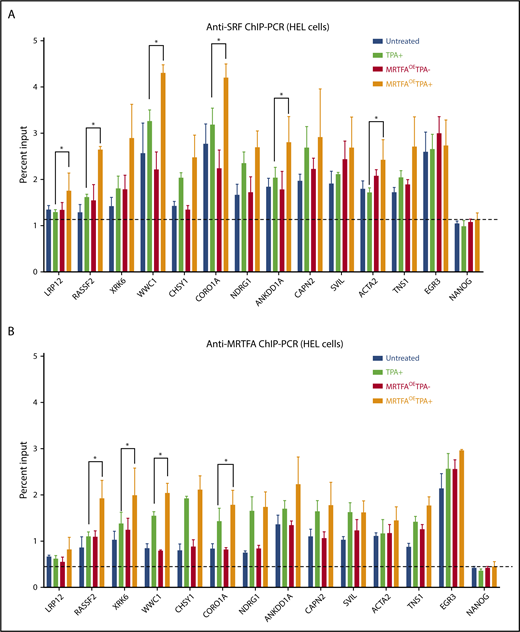
ChIP-PCR for MRTFA/SRF-regulated genes. Anti-SRF (A) and anti-MRTFA (B) binding at the indicated genes. On the basis of ChIP-seq results, the first 8 genes on the x-axes were predicted to have stronger SRF binding in the MRTFAOETPA+ group compared with the untreated group. The next 4 cytoskeletal genes were predicted to have SRF and MRTFA binding in multiple cell types. EGR3 (positive control) was predicted to have equal amounts of SRF binding under all conditions, and NANOG served as a negative control. (n = 3). Mean ± standard deviations. Asterisks represent significance with P ≤ .07.
ChIP-PCR for MRTFA/SRF-regulated genes. Anti-SRF (A) and anti-MRTFA (B) binding at the indicated genes. On the basis of ChIP-seq results, the first 8 genes on the x-axes were predicted to have stronger SRF binding in the MRTFAOETPA+ group compared with the untreated group. The next 4 cytoskeletal genes were predicted to have SRF and MRTFA binding in multiple cell types. EGR3 (positive control) was predicted to have equal amounts of SRF binding under all conditions, and NANOG served as a negative control. (n = 3). Mean ± standard deviations. Asterisks represent significance with P ≤ .07.
MRTFA binding at these same sites mirrored the pattern observed with SRF binding, with subtle differences (Figure 5B). For many of the sites shown (eg, RASSF2, XRK6, WWC1, and CORO1A), MRTFA binding increased with TPA treatment and was augmented by MRTFAOE (P ≤ .07). Similar patterns were observed for SRF (Figure 5A) suggesting that MRTFA at these sites stabilizes SRF binding. In addition, we found that MRTFA binding increased with TPA treatment and MRTFAOE at sites close to EGR3 and FLNA (supplemental Figure 4), whereas the MRTFA binding pattern at NOP14 mimicked that for SRF. Although CAPN2, SVIL, ACTA2, and TNS1 genes showed upregulated expression and increased proximal SRF binding in the MRTFAOETPA+ group, MRTFA was recruited equally in the TPA+ and MRTFAOETPA+ groups, suggesting that MRTFA is already maximally recruited to these genes.
SRF is associated with genes upregulated in primary human CD34+ cells during Mk maturation
In order to assess potential changes in SRF binding at critical genes during primary megakaryopoiesis, we first assessed gene expression changes during in vitro primary Mk maturation. We then determined which of the genes with upregulated mRNA expression had significant SRF binding in either the TPA+ or MRTFAOETPA+ group (supplemental Table 6). The genes with upregulation in primary Mk maturation with SRF binding in HEL cells included Mk-associated genes such as TPM1, KALRN, CORO1C, and FHL2, and this group was significantly enriched for pathways related to the actin cytoskeleton (eg, CALD1 and ACTR3) and platelet activation (eg, GP5 and GNAQ) (supplemental Table 6). SRF-associated sites for many critical genes, such as MYLK, MYL6, ARHGAP6, GP9, and VWF, were only identified with MRTFAOE.
ChIP-PCR for SRF and MRTFA in primary human megakaryopoiesis
To validate that SRF and MRTFA bind to and regulate these critical target genes in primary human megakaryopoiesis, we performed anti-SRF and anti-MRTFA ChIP-PCR on human CD34+-derived immature Mks (CD41+CD42−), late Mks (CD41+CD42+), and monocytes (CD41−CD42−). As shown in Figure 6A, compared with the non-Mk lineage monocytes, both early and mature Mks had significantly increased SRF binding at 10 of the 12 targets tested (P ≤ .07). Of these, LRP12, WWC1, CORO1A, SVIL, and ANKDD1A binding sites had significantly more SRF in mature Mks compared with early Mks (P ≤ .07). Similarly, 9 of the 12 target sites had increased MRTFA recruitment in early and mature Mks compared with monocytes (P ≤ .07) (Figure 6B). Of these, XRK6, WWC1, NDRG1, and EGR3 had significantly higher MRTFA binding in mature Mks compared with immature Mks (P ≤ .07). These results strongly suggest that for XRK6, NDRG1, and EGR3, gene upregulation is induced by increased MRTFA binding, whereas SRF is already maximally bound.
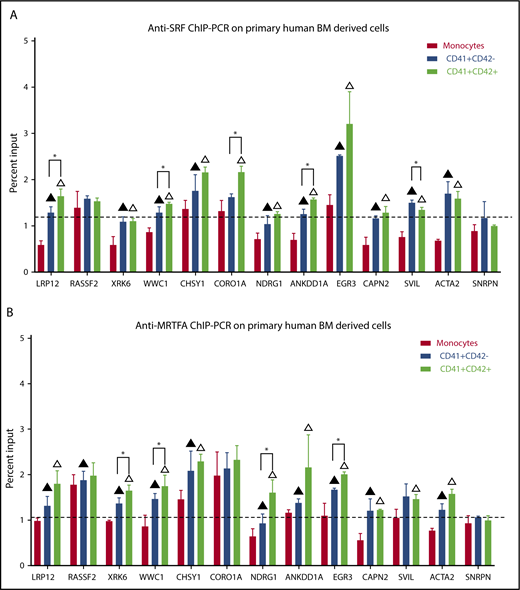
Increased SRF and MRTFA binding at predicted sites during primary human megakaryopoiesis. Anti-SRF (A) and anti-MRTFA (B) ChIP-PCR results are shown as percentages of input, for the same sites as in Figure 5. Exon 4 of SNRPN was used as a negative control (n = 3). Mean ± standard deviations. Filled triangles represent significant difference between monocytes and early Mks, empty triangles represent significant difference between monocytes and mature Mks, and asterisks represent significant difference between early (CD41+CD42−) and mature (CD41+CD42+) Mks. Significance assessed via 1-tailed paired Student t tests (P ≤ .07).
Increased SRF and MRTFA binding at predicted sites during primary human megakaryopoiesis. Anti-SRF (A) and anti-MRTFA (B) ChIP-PCR results are shown as percentages of input, for the same sites as in Figure 5. Exon 4 of SNRPN was used as a negative control (n = 3). Mean ± standard deviations. Filled triangles represent significant difference between monocytes and early Mks, empty triangles represent significant difference between monocytes and mature Mks, and asterisks represent significant difference between early (CD41+CD42−) and mature (CD41+CD42+) Mks. Significance assessed via 1-tailed paired Student t tests (P ≤ .07).
Discussion
Our findings shed light on regulation by the SRF/MRTFA complex during Mk maturation. Murine megakaryopoiesis is adversely affected by Mrtfa and Srf knockouts. In HEL cells, which mimic critical aspects of Mk maturation, MRTFAOE enhances Mk maturation, promotes SRF’s association at genomic CArG domains, colocalizes with SRF, and enhances expression of both direct and indirect SRF targets. We confirm that domains with SRF/MRTFA binding in TPA-induced HEL cell maturation are nearly identical during megakaryopoiesis of primary human cells, with significant increases in MRTFA/SRF binding during late stages of Mk maturation.
During normal Mk maturation (Figure 7, left), the SRF/MRTFA and SRF/TCF axes are in balance and concurrently regulate gene expression to promote megakaryopoiesis. Upregulated genes with SRF binding are both cytoskeletal and MRTFA dependent (FLNA, CORO1A, and VCL), as well as proliferation associated and TCF dependent (FOS, DUSP6, and NR4A1).18 This balance is weighted toward the SRF/MRTFA axis under conditions of MRTFAOE (Figure 7, right), resulting in increased binding of SRF/MRTFA complex at many sites. A greater number of cytoskeletal genes are upregulated, most of which are MRTFA-dependent (TPM2, MICAL2, and CAPN2). As the influence of the axis may decrease because of increased associations between MRTFA and SRF, some of the sites regulated by the SRF/TCF complex may become dissociated from SRF/TCF complexes, thus reducing the extent of upregulation of associated genes. Genes that are downregulated are related to proliferation (eg, TCF dependent, such as MYC, BARD1, and HSPA8), as the cells are induced to undergo enhanced maturation.

Proposed model for enhanced Mk maturation based on HEL cell data. MRTFAOE promotes more robust Mk maturation by enhancing cytoskeleton-associated gene expression. Left: Normal Mk maturation with TPA promotes the binding of TCF factors (eg, ETS factors) to SRF dimers poised on chromatin and the binding of SRF to upregulate genes. Right: With MRTFAOE- and TPA-induced Mk maturation, more MRTFA is bound to poised dimers of SRF that both promotes SRF binding and upregulates cytoskeletal genes. At the same time, it also reduces regulation by the SRF/TCF axis. Dotted arrow on the lower right indicates variable effects on mRNA levels. CArG, CCWWWWWWGG; ETS, ETS binding site, GGAA.
Proposed model for enhanced Mk maturation based on HEL cell data. MRTFAOE promotes more robust Mk maturation by enhancing cytoskeleton-associated gene expression. Left: Normal Mk maturation with TPA promotes the binding of TCF factors (eg, ETS factors) to SRF dimers poised on chromatin and the binding of SRF to upregulate genes. Right: With MRTFAOE- and TPA-induced Mk maturation, more MRTFA is bound to poised dimers of SRF that both promotes SRF binding and upregulates cytoskeletal genes. At the same time, it also reduces regulation by the SRF/TCF axis. Dotted arrow on the lower right indicates variable effects on mRNA levels. CArG, CCWWWWWWGG; ETS, ETS binding site, GGAA.
Our data show that MRTFAOE promotes megakaryopoiesis by enhancing/maintaining more robust associations between SRF and its relevant genomic sites. This knowledge may aid in growing Mks and platelets in vitro for patient use. MRTFAOE promotes Mk maturation and may also strengthen the cytoskeleton, improving Mk survival in bioreactors and enabling efficient production of functional platelets.
Also, MRTFA is a partner of the oncogenic fusion protein RBM15-MRTFA, associated with the recurrent t(1;22) translocation in non–Down Syndrome acute megakaryoblastic leukemia.28 This translocation conserves all the functional domains of MRTFA protein, and its function in acute megakaryoblastic leukemia is unknown. Our findings imply that the fusion protein may acts as a dominant negative to block Mk maturation, perhaps because of new functions provided by RBM15.
This article addresses previously unknown roles of SRF and MRTFA in megakaryopoiesis and opens doors for additional investigations. It will be important to assess for similar trends in SRF binding in primary human Mks matured with MRTFAOE. It would be also informative to study whether a knockdown of MRTFA followed by TPA induction shifts the gene regulatory balance toward the SRF/TCF axis.
The data reported in this article have been deposited in the Gene Expression Omnibus database (accession number GSE112279).
The full-text version of this article contains a data supplement.
Acknowledgments
The authors thank Richard Treisman for support and helpful discussion; Topher Carroll for the kind gift of anti-MRTFA antibody; and the Yale Stem Cell Center Genomics Core for library preparation and Illumina sequencing.
This work was supported by grants from the National Institute of Diabetes and Digestive and Kidney Diseases, National Institutes of Health (DK094934, DK114031, and DK086267) (D.S.K.); the CT Stem Cell Fund to the Yale Stem Cell Center; and the Yale Cooperative Center of Excellence in Hematology (under National Institute of Diabetes and Digestive and Kidney Diseases grant 1U54DK106857). The Yale Stem Cell Center Genomics Core is supported by the Connecticut Regenerative Medicine Research Fund and the Li Ka Shing Foundation. C.E. and F.G. were funded by Cancer Research UK core funding to the Treisman Group at its London Research Institute, and by ERC Advanced grant 268690 ACTINonSRF to Richard Treisman.
Authorship
Contribution: N.-T.R. designed and performed experiments, analyzed data, and wrote the manuscript; L.W. performed experiments; O.D., C.E., and F.G. performed experiments and data analysis; V.P.S. and P.G.G. helped analyze and interpret data and wrote the manuscript; and D.S.K. oversaw the project, provided intellectual input, and wrote the manuscript.
Conflict-of-interest disclosure: C.E. and F.G. are members of the Treisman Group at the Cancer Research UK London Research Institute. The remaining authors declare no competing financial interests.
Correspondence: Diane S. Krause, Yale University School of Medicine, 333 Cedar St., P.O. Box 208035, New Haven, CT 06520-8035; e-mail: diane.krause@yale.edu.

