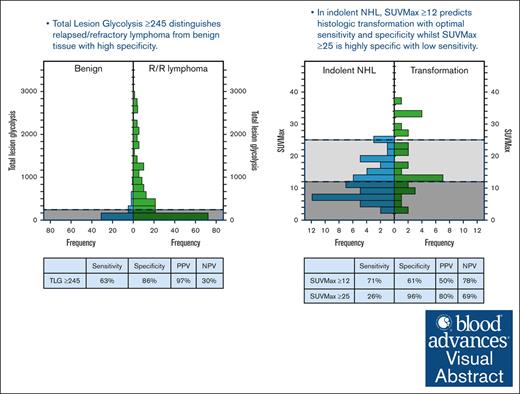
In suspected relapsed/refractory lymphoma, TLG ≥245 distinguished the presence of lymphoma from benign tissue.
In indolent NHL, SUVMax ≥12 is associated with transformation, and biopsy of the most FDG-avid disease site is recommended.
Visual Abstract
18F-fluorodeoxyglucose-positron emission tomography (FDG-PET) is a valuable prognostic tool in modern lymphoma care. In this study, we explored the use of quantitative FDG-PET parameters in predicting the histology of suspected relapsed or refractory (R/R) lymphoma. We retrospectively analyzed 290 FDG-PET scans performed for suspected R/R lymphoma. FDG-PET parameters measured were maximum and mean standardized uptake value (SUVMax and SUVMean), total metabolic tumor volume, and total lesion glycolysis (TLG). Receiver operating characteristic curve analysis was used to obtain the optimal thresholds that best discriminate (1) benign vs R/R lymphoma, (2) indolent vs aggressive non-Hodgkin lymphoma (NHL), and (3) aggressive transformation of indolent NHL. We found that although all 4 FDG-PET parameters discriminated R/R lymphoma from benign histology, TLG was the best performing parameter (optimal cut-off ≥245, sensitivity 63%, specificity 86%, positive predictive value [PPV] 97%, negative predictive value [NPV] 30%, area under the curve [AUC] 0.798, and P < .001). SUVMax discriminated aggressive from indolent NHL with modest accuracy (optimal threshold ≥15, sensitivity 46%, specificity 79%, PPV 82%, NPV 38%, AUC 0.638, and P < .001). In patients with a prior diagnosis of indolent NHL, SUVMax was a modest predictor of transformation (optimal cut-off ≥12, sensitivity 71%, specificity 61%, PPV 50%, NPV 78%, AUC 0.676, and P .006). Additionally, SUVMax ≥25 and an increase in SUVMax (ΔSUVMax) from baseline ≥150% were highly specific (96% and 94%, respectively). These FDG-PET thresholds can aid in identification of suspected R/R lymphoma cases with higher likelihood of R/R disease and aggressive transformation of indolent NHL, guiding the necessity and urgency of biopsy.
Introduction
In aggressive lymphomas, such as Hodgkin lymphoma (HL) and high-grade non-Hodgkin lymphoma subtypes (aNHL), modern therapeutic approaches achieve complete remission rates between 70% and 90% after first-line therapy. However, approximately a quarter of those achieving remission will experience relapse.1,2 Most patients who relapse do so with the same histological subtype of lymphoma; however, nonlymphomatous, discordant, or transformed disease histology is not uncommon. Many nonlymphomatous conditions, such as solid tumors, infection, and autoimmune diseases can mimic lymphoma in clinical and radiological presentation; excluding these is therefore essential. Furthermore, determining lymphoma subtype is imperative, owing to the divergent treatment paradigms. There is a need for urgent therapy in aggressive lymphomas, whereas for indolent non-Hodgkin lymphoma (iNHL), therapy may not be immediately required, except in symptomatic cases or in the setting of transformation to aggressive lymphoma. In follicular lymphoma (FL), the risk of transformation is highest, up to 10% over 5 years.3 Therefore, in the event of a clinically suspected relapse or progression of lymphoma, repeat biopsy of an abnormal lesion is the gold standard to confirm the presence of lymphoma vs other histologies, and the lymphoma subtype manifesting at this time point.
Molecular imaging plays a crucial role in modern lymphoma care, with 18F-fluorodeoxyglucose-positron emission tomography (FDG-PET) being a standard tool for lymphoma staging, treatment response evaluation, and relapse assessment. Contemporary approaches to lymphoma prognostication increasingly emphasize the complementary role of quantitative FDG-PET parameters. The maximum standardized uptake value (SUVMax) and mean standardized uptake value (SUVMean) measure maximum and average glucose accumulation respectively, to reflect the tumor’s metabolic phenotype. In contrast, total metabolic tumor volume (TMTV) and total lesion glycolysis (TLG) are volumetric parameters obtained from software-defined regions of interest, offering assessments of disease burden. TMTV quantifies metabolically active disease mass, whereas TLG combines tumor volume and glycolytic activity to assess the overall metabolic tumor load. The prognostic significance of quantitative FDG-PET parameters varies based on specific lymphoma subtype and timing of disease assessment.4-11
Our study aims to explore the diagnostic use of these 4 FDG-PET parameters in the evaluation of suspected relapsed or refractory (R/R) lymphoma; specifically, whether they can discriminate between common histological scenarios, such as benign pathology compared with the presence of R/R lymphoma, and indolent vs aggressive NHL. We also explored whether any FDG-PET parameter at the time of relapse predicted histologic transformation for patients whose initial diagnosis was iNHL.
Methods
Patient cohort
The study was approved by the local institutional review board (LNR/17/Austin/186). The institution’s lymphoma multidisciplinary meeting records between 2008 and 2020 were retrospectively screened to identify all patients with biopsy-proven lymphoma diagnosis. The histology records of these patients were reviewed to identify those with at least 1 repeat biopsy (rebiopsy) for suspected progression, R/R disease (R/R lymphoma) by the data cut-off date (31 July 2021). Multiple biopsy attempts obtained at the same clinical time point of suspected R/R lymphoma were analyzed as a single rebiopsy episode, whereas subsequent rebiopsy after a period of monitoring or rebiopsy for a different time point of suspected R/R disease were analyzed as separate rebiopsy episodes.
Histological data
Rebiopsy histology was categorized as (1) R/R lymphoma, (2) benign tissue, (3) nonhematological malignancy, or (4) nondiagnostic. To classify the lymphoma subtype among R/R lymphoma diagnoses, biopsies were reviewed by the local expert hematopathologists and reported as per the World Health Organization classification fourth edition.12 R/R lymphoma histology was then categorized as either concordant or discordant with the patient’s initial lymphoma diagnosis. For patients with prior transformation or multiple previous lymphoma histologies, the rebiopsy histology was compared with the most recent lymphoma histology.
Clinicopathological data
Records of hematology medical notes, request forms, dates, and finalized reports of pathology and radiology investigations were reviewed to obtain clinical factors at rebiopsy time point, including the presence of palpable lymph nodes, B symptoms, elevated lactate dehydrogenase (LDH), >1 site of suspected disease, new disease site compared with previous imaging, extranodal disease, time from diagnosis to rebiopsy > 5 years, prior treatment history, last treatment to rebiopsy >6 months, and most recent treatment response. In iNHL, we also assessed baseline clinicopathological risk factors associated with aggressive transformation, such as Ann-Arbor stage III to IV, elevated LDH and nodal sites >4.11,13-17 For patients with grade 1 to 3A FL, Follicular Lymphoma International Prognostic Index (FLIPI) score was also calculated.
PET analysis
We recorded whether rebiopsy time point FDG-PET (r-PET) was performed. If performed, the dates and interval between rebiopsy and r-PET were determined. Based on documented clinical notes and pathology request forms, we assessed whether the clinician reviewed and used r-PET report to guide rebiopsy site. To obtain PET parameters, including Deauville score (DS), available r-PET as well as baseline FDG-PET (b-PET) were analyzed by a nuclear medicine physician, blinded to the medical charts and rebiopsy histology results. All abnormal FDG-avid lesions were identified by visual assessment and region of interest was placed around all abnormal lesions using MIMEncore program (MIM Software Inc, Cleveland, OH).7 From this contour, the SUVMax, SUVMean, TMTV, and TLG were generated. A separate region of interest contour was drawn for the rebiopsy site by the trained investigators (S.H.W., M.B., and J.L.) and SUVMax at rebiopsy site was derived from this contour.
Statistical analysis
Mann-Whitney U test and Pearson χ2 test were used to identify FDG-PET factors and clinical factors that correlated with rebiopsy histology groups, such as (1) benign pathology vs presence of R/R lymphoma and (2) iNHL vs aNHL. We also explored if any FDG-PET parameter, including change in SUVMax from b-PET to r-PET (ΔSUVMax), predicted transformation when initial diagnosis was iNHL. Receiver operating characteristic (ROC) curve analysis was used to obtain the optimal thresholds for the PET parameters. The sensitivity, specificity, positive predictive value (PPV), and negative predictive value (NPV) for these thresholds were assessed. P value <.05 was used to identify a statistically significant result. Correlating factors found on univariate analysis were further analyzed on multivariate analysis.
Results
Patient cohort, histology, and clinical factors at rebiopsy
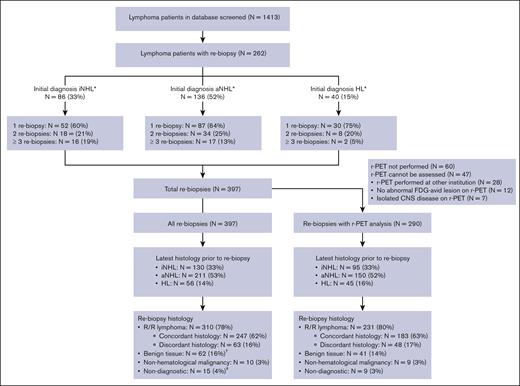
We screened >1400 patients with lymphoma and identified 262 patients with at least 1 rebiopsy (Figure 1). Ninety-three patients (35%) had ≥2 separate rebiopsies; those with NHL, in particular iNHL, had higher rates of multiple rebiopsy episodes compared with those with HL. The median time interval between rebiopsy episodes was 16 months (range, 1.3-124.0 months) and the interval was 3 months in only 8 of 135 (6%) episodes. A total of 397 separate rebiopsy episodes were identified. In 60 out of 397 rebiopsy episodes (15%), >1 biopsy attempt was required for the same clinical indication time point.
Histological diagnosis of all rebiopsy cases and 290 cases with r-PET analysis. The flow chart demonstrates the initial histology, the most recent histology before rebiopsy, and the histology at rebiopsy of all cases and separately demonstrates the most recent histology before rebiopsy and the histology at rebiopsy in 290 cases with r-PET analysis. ∗iNHL includes grade 1 to 3A FL (N = 54, 21%), marginal zone lymphoma (N = 14, 5%), chronic lymphocytic leukemia or small lymphocytic lymphoma (N = 14, 5%), and other low grade NHL (N = 4, 15%). aNHL includes large B-cell lymphoma (N = 92, 35%), grade 3B FL (N = 9, 3%), mantle cell lymphoma (N = 19, 7%), T-cell lymphomas (N = 11, 4%), and other high grade NHL (N = 5, 4%). HL includes 2 cases with nodular lymphocyte predominant HL. †Two patients received salvage therapy for presumed R/R disease, based on clinical and radiological findings without subsequent rebiopsy. After a period of observation, an additional 3 patients had subsequent rebiopsy within 3 months at different sites; 2 demonstrated R/R marginal zone lymphoma, and 1 demonstrated nonspecific inflammatory changes. ‡Subsequent rebiopsy occurred in 5 cases with nondiagnostic histology, and none were within 3 months.
Histological diagnosis of all rebiopsy cases and 290 cases with r-PET analysis. The flow chart demonstrates the initial histology, the most recent histology before rebiopsy, and the histology at rebiopsy of all cases and separately demonstrates the most recent histology before rebiopsy and the histology at rebiopsy in 290 cases with r-PET analysis. ∗iNHL includes grade 1 to 3A FL (N = 54, 21%), marginal zone lymphoma (N = 14, 5%), chronic lymphocytic leukemia or small lymphocytic lymphoma (N = 14, 5%), and other low grade NHL (N = 4, 15%). aNHL includes large B-cell lymphoma (N = 92, 35%), grade 3B FL (N = 9, 3%), mantle cell lymphoma (N = 19, 7%), T-cell lymphomas (N = 11, 4%), and other high grade NHL (N = 5, 4%). HL includes 2 cases with nodular lymphocyte predominant HL. †Two patients received salvage therapy for presumed R/R disease, based on clinical and radiological findings without subsequent rebiopsy. After a period of observation, an additional 3 patients had subsequent rebiopsy within 3 months at different sites; 2 demonstrated R/R marginal zone lymphoma, and 1 demonstrated nonspecific inflammatory changes. ‡Subsequent rebiopsy occurred in 5 cases with nondiagnostic histology, and none were within 3 months.
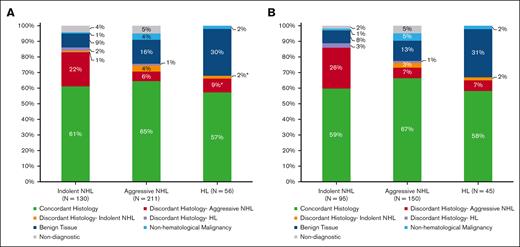
Indications for rebiopsy were suspected relapse after initial complete remission (61%), suspected refractory disease during or at the end of therapy (30%), and progression of treatment naïve iNHL (9%). Clinical factors are further summarized in Table 1, and the rebiopsy histologies are shown in Figure 1. Rebiopsy histology was benign in 16% and nondiagnostic in 4% of cases. The rate of multiple rebiopsy episodes was not higher after benign or nondiagnostic results. Compared to 93 of 262 (35%) patients with >1 rebiopsy episode in the whole group, 18 of 62 (29%) had subsequent rebiopsy after benign histology, and 5 of 15 (33%) had subsequent rebiopsy after nondiagnostic histology. Seventy-eight percent of rebiopsy cases showed R/R lymphoma, and discordant lymphoma histology subtype was seen in 16%. Rebiopsy histology is further delineated according to previous lymphoma subtype in Figure 2A.
Rebiopsy histology according to the previous histological diagnosis. (A) All rebiopsy cases and (B) 290 cases with r-PET analysis. The rebiopsy histology type is represented in this bar chart according to the previous histological subtype: iNHL, aNHL, and HL. ∗Out of 6 patients (11%) with discordant histology, 2 patients had nodular lymphocyte predominant HL subtype, and 2 patients had history of iNHL before diagnosis of classical Hodgkin lymphoma.
Rebiopsy histology according to the previous histological diagnosis. (A) All rebiopsy cases and (B) 290 cases with r-PET analysis. The rebiopsy histology type is represented in this bar chart according to the previous histological subtype: iNHL, aNHL, and HL. ∗Out of 6 patients (11%) with discordant histology, 2 patients had nodular lymphocyte predominant HL subtype, and 2 patients had history of iNHL before diagnosis of classical Hodgkin lymphoma.
r-PET was not performed in 15% (N = 60) of rebiopsy episodes, performed after rebiopsy in 19% (N = 76) and before rebiopsy in 66% (N = 261). r-PET was documented to have been reviewed by a clinician and used to guide rebiopsy site in 59% (N = 234) of episodes. Seventy three percent of rebiopsy episodes (N = 290) had r-PET images available for analysis of quantitative parameters. Clinical and histological characteristics of the cohort with r-PET analysis is outlined in Table 1 and Figures 1 and 2B. Rebiopsy site was the most FDG-avid disease site in 54%, and we found that the rebiopsy histology was not affected by whether the rebiopsy site was the most FDG-avid site. The rate of R/R lymphoma was 81% when rebiopsy was taken at the most avid site and 88% when re-biopsy was not obtained at the most avid disease site (P = .124). In the subgroup of initial patients with iNHL, the rate of transformation was also not different whether or not rebiopsy occurred at the most FDG avid site (29% vs 42%, P = .254). Rebiopsy site was at least 80% of the overall SUVMax in the majority of cases (71%).
Use of r-PET to distinguish the presence of R/R lymphoma from benign tissue
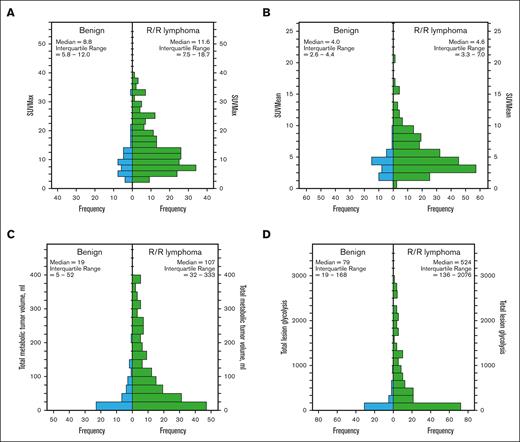
r-PET was available for analysis in 41 rebiopsies showing benign histology and 231 rebiopsies showing R/R lymphoma. Compared with those with benign histology at rebiopsy, the presence of R/R lymphoma was associated with higher r-PET SUVmax, SUVmean, TMTV, and TLG (P < .001; Figure 3; Table 2). ROC curve analysis showed that all 4 r-PET parameters could distinguish the presence of R/R lymphoma, though with different accuracy (Table 2). In particular, TLG ≥245 had the best performance with 63% sensitivity, 86% specificity, 97% PPV, 30% NPV, and an odds ratio (OR) of 12.1 (P < .001).
Histograms demonstrating the distribution of r-PET parameters in benign vs R/R lymphoma at rebiopsy. (A) SUVMax, (B) SUVMean, (C) TMTV, and (D) TLG.
Histograms demonstrating the distribution of r-PET parameters in benign vs R/R lymphoma at rebiopsy. (A) SUVMax, (B) SUVMean, (C) TMTV, and (D) TLG.
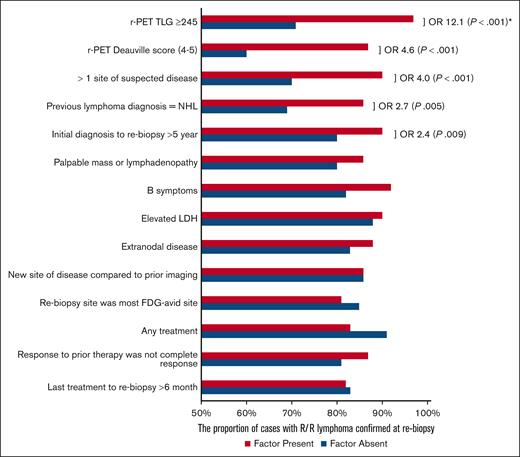
Out of all the clinicopathological factors assessed, only 4 were associated with the presence of lymphoma on rebiopsy (Figure 4). They were (1) r-PET DS ≥4 (OR, 4.6; P < .001), (2) >1 site of abnormality on PET (OR, 4.0; P < .001), (3) most recent prior diagnosis was NHL (OR, 2.7; P = .005), and (4) time from diagnosis to rebiopsy >5 years (OR, 2.4; P = .009). On multivariate analysis with these factors and TLG ≥245, only TLG ≥245 was found to be an independent predictor of lymphoma histology (adjusted OR, 9.7; P < .001; supplemental Table 1). Similar to the correlation seen with DS 4 to 5, DS 5 was associated with R/R lymphoma in univariate analysis (OR, 3.2; P = .002). In multivariate analysis with TLG ≥245 and DS 5, it was found that DS 5 was not an independent predictor of R/R lymphoma (P = .168).
The presence of R/R lymphoma at rebiopsy depending on the presence of various clinical and radiological factors. ORs and P values are not shown for factors that did not demonstrate association on univariate analysis. ∗Only r-PET TLG ≥ 245 is an independent risk factor on multivariate analysis.
The presence of R/R lymphoma at rebiopsy depending on the presence of various clinical and radiological factors. ORs and P values are not shown for factors that did not demonstrate association on univariate analysis. ∗Only r-PET TLG ≥ 245 is an independent risk factor on multivariate analysis.
The performance of TLG ≥245 was highest in the subgroup of patients with an initial diagnosis of large B-cell lymphoma and lower in those with iNHL and HL. When the optimal TLG cut-off for an individual subgroup was used, PPV and NPV were only marginally improved (Table 3). Furthermore, in large B-cell lymphoma, r-PET SUVMax and TMTV were also able to distinguish between lymphoma and benign histology reliably with AUC 0.807 and 0.898, respectively (P < .001). The optimal thresholds were r-PET SUVMax ≥10 (sensitivity 71%, specificity 85%, PPV 91%, and NPV 44%) and TMTV ≥30 (sensitivity 82%, specificity 85%, PPV 89%, and NPV 52%).
Use of r-PET to distinguish indolent NHL and aggressive NHL rebiopsy histology
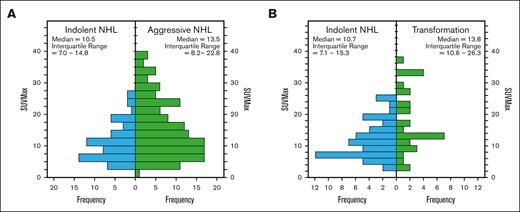
PET parameters of iNHL rebiopsy histology and aNHL rebiopsy histologies are summarized in Table 4 and Figure 5A. r-PET SUVmax and SUVmean were lower in iNHL compared with aNHL rebiopsy histology (P < .05). The optimal r-PET SUVMax threshold ≥15 was modestly reliable in distinguishing aNHL from iNHL (AUC 0.638, sensitivity 46%, specificity 79%, PPV 82%, NPV 38%, and P < .001).
Histograms demonstrating the distribution of r-PET SUVMax in iNHL vs aNHL at rebiopsy. (A) All cases with NHL at rebiopsy and (B) subgroup of cases with initial iNHL diagnosis.
Histograms demonstrating the distribution of r-PET SUVMax in iNHL vs aNHL at rebiopsy. (A) All cases with NHL at rebiopsy and (B) subgroup of cases with initial iNHL diagnosis.
Use of r-PET to identify transformation of indolent NHL
Of 139 rebiopsies with initial iNHL diagnosis, 77 showed persistent iNHL (55%), 38 (27%) showed transformation to aNHL, and only 3 cases showed transformation to classical HL. r-PET was available in 54 cases with iNHL at rebiopsy and 31 cases with aNHL transformation. Compared with those with iNHL at rebiopsy, only r-PET SUVMax was higher in those with transformation to aNHL (median SUVMax 13.8 vs 10.7, P = .007; Figure 5B; Table 4). On ROC analysis, optimal SUVMax ≥12, predicted aNHL transformation with modest performance (AUC 0.676, sensitivity 71%, specificity 61%, PPV 70%, NPV 65%, and P = .006; Table 4). Alternatively, SUVMax was ≥25 in 10 out of 84 patients, and this threshold had high specificity (96%) and PPV (80%), but lower sensitivity (26%) and NPV (69%) (Table 5).
Baseline PET parameters, including SUVMax were similar between those with and without transformation; median b-PET SUVMax were 9.5 and 8.9, respectively (P = .217). In 33 cases, both b-PET and r-PET were available to obtain ΔSUVMax, and this showed a trend toward correlation with aNHL transformation (median ΔSUVMax was +67% in transformation vs +9% without transformation, P = .057), limited by sample size. On ROC analysis, optimal ΔSUVMax threshold was ≥+70% (AUC 0.696, sensitivity 47%, specificity 83%, PPV 70%, NPV 65%, and P = .036; Table 5). In 5 out of 33 patients with both b-PET and r-PET, ΔSUVMax was ≥+150% and this threshold had high specificity of 94%, PPV 80% with a corresponding decrease in sensitivity of 27% and NPV 61%.
We found that out of the 77 rebiopsies with persistent iNHL histology, 5 subsequently showed transformation at a separate, second episode of rebiopsy. In 3 cases, the second rebiopsies were for persistent or progressive disease after 4, 6, and 10 months of salvage therapy for iNHL and in the other 2 cases, the second rebiopsies were for progressive disease after multiple years of watch and wait approach. All 5 patients had SUVMax ≥12 at the second rebiopsy showing transformation. r-PET was available at both rebiopsy time points in 3 of the 5 patients, and all 3 cases had increases of SUVMax between the first rebiopsy and their second rebiopsy as follows: case 1: 5 to 14, case 2: 15 to 23, and case 3: 25 to 32.
In terms of clinical factors on univariate analysis, Ann-Arbor stage I/II at initial diagnosis was associated with subsequent transformed disease (OR, 4.4; 24% vs 58%; P = .005). No other clinicopathological factors were associated with transformation, including >4 nodal sites or bone marrow involvement at diagnosis, previous treatment, time from previous treatment >6 months, elevated LDH or B symptoms at diagnosis and at rebiopsy (P > .05; supplemental Table 2). On multivariate analysis with Ann-Arbor stage and SUVMax ≥12, only SUVMax ≥12 was a statistically significant predictor of histologic transformation (adjusted OR, 3.6; P = .031; supplemental Table 2).
On univariate analysis of patients with FL grade 1 to 3A, 2 additional clinical factors were associated with transformation; FLIPI score ≥3 at rebiopsy (OR, 3.2; P = .040) and elevated LDH at rebiopsy (OR, 3.8; P = .037). On multivariate analysis with SUVMax ≥12 and FLIPI score ≥3 at rebiopsy, r-PET SUVMax was the only independent predictor of transformation (adjusted OR, 5.9; P = .022; supplemental Table 2). r-PET SUVMax ≥12 was also an independent predictor of transformation in multivariate analysis with elevated LDH (adjusted OR, 6.0; P = .041).
Discussion
To our knowledge, this study is the first to investigate the use of quantitative PET parameters in predicting the results of rebiopsy among patients with suspected R/R lymphoma. At our institution, r-PET was commonly performed in suspected R/R lymphoma (85% of rebiopsy cases), although in 19% of cases, r-PET was performed only after rebiopsy. We found that r-PET parameters distinguished rebiopsy histology with modest performance, and the accuracy of each r-PET parameter varied depending on the clinical question. TLG ≥245 was useful in distinguishing R/R lymphoma from benign tissue, and in indolent NHL, SUVMax ≥12 was a predictor of transformation to aggressive NHL.
To differentiate the presence of R/R lymphoma from benign pathology, volumetric PET parameters (TMTV and TLG) had better performance on ROC curve analysis compared with exclusively metabolic indices (SUVMax and SUVMean). TLG, which represents both tumor volume and metabolic activity, had the best performance out of the 4 r-PET parameters, and TLG ≥245 was highly specific at 86% and moderately sensitive at 63%. r-PET parameters demonstrated the highest specificity and PPV in the subgroup of patients initially diagnosed with large B-cell lymphoma and HL. This finding offers significant implications for clinical practice, particularly in the context of a potentially cured patient presenting with an abnormal PET scan.
Our data indicate that PET parameters can help differentiate lesions that are more likely to represent R/R lymphoma and thus help triage the need for urgent rebiopsy and planning of salvage treatment. The sensitivity and the corresponding NPV of TLG ≥245 is relatively low and as such, it is less useful as a “rule-out” test. We did not find any correlating clinical factors on multivariate analysis although some clinical factors, such as >1 site of disease and NHL rather than HL initial diagnosis were associated with R/R lymphoma on univariate analysis. In clinical practice, the pretest probability and clinical factors could aid the clinician decision to discern between clinical monitoring vs rebiopsy in patients with TLG <245. For example, a patient with history of sarcoidosis with small inflammatory lesions and HL remission for over 5 years, TLG <245 may favor a strategy to clinically monitor rather than undergo rebiopsy. Because of the retrospective nature of the study, we were unable to robustly assess how the pretest probability influences the rebiopsy histology.
SUVMax appeared most informative in differentiating aggressive NHL from indolent NHL, however with only modest sensitivity, specificity, PPV, and NPV. There are no comparable studies at R/R time points reporting this finding. Limited smaller studies at time of diagnosis reported that SUVMax threshold ≥10 had higher sensitivity and specificity for determining aNHL vs iNHL. For example, Ngeow et al18 (N = 122) reported that SUVMax ≥10 was 91% sensitive and 62% specific whereas Schöder et al19 (N = 97, of which 29 patients were R/R NHL) reported SUVMax ≥10 was 71% sensitive and 81% specific. In our analysis at the R/R time point, SUVMax ≥10 had reduced sensitivity and specificity compared with these studies and the optimal SUVMax threshold was ≥15 with high specificity of 79% but limited sensitivity (46%). We postulate that the reduced predictive use of r-PET SUVMax is a reflection of the patient heterogeneity which ranged from clinically progressive iNHL to R/R aNHL. The majority of our cohort had also received previous treatment which influences tumor biology and its metabolic pattern.
A previous smaller study of 38 patients with iNHL reported SUVMax ≥14 to be highly sensitive (94%) and specific (95%) in detecting transformation.20 In contrast, in our subgroup analysis of initial patients with iNHL, the optimal r-PET SUVMax threshold ≥12 still had limited sensitivity and specificity (71% and 61%, respectively). As demonstrated in Table 5, at higher SUVMax and ΔSUVMax thresholds, specificity and PPV increase, though at the expense of reduced sensitivity and NPV. Given the modest accuracy of r-PET parameters and higher proportion of discordant lymphoma histology in patients with iNHL, rebiopsy remains crucial when there is clinical suspicion of aggressive transformation.
We propose that r-PET parameters can help clinical decision making in the following manners: firstly, r-PET TLG can be used when there is clinical equipoise regarding R/R disease vs a benign or inflammatory lesion; those with TLG ≥245 are highly likely to have R/R lymphoma and require rebiopsy to confirm R/R disease histology. TLG <245 cannot be used to rule out R/R disease and the decision to rebiopsy vs monitor clinically or with serial imaging would need to be determined based on clinical factors and pretest probability.
Secondly, r-PET SUVMax can still be informative in the management of progressive or suspected transformation of iNHL. Given the lower sensitivity, SUVMax <12 cannot rule out transformation, and rebiopsy is required if there is clinical concern. However, SUVMax ≥12 is highly associated with transformation, and it is crucial to perform rebiopsy and target the most FDG avid disease site. In our study, the rebiopsy site was at least 80% of the overall SUVMax in a high proportion (71%), and we only had a small number of patients (N = 2) who had iNHL at rebiopsy but transformed within 6 months. If it is technically difficult to biopsy the site of most FDG avid disease, it may be reasonable to consider treatment for aNHL in the small percentage of patients with r-PET SUVMax ≥25 and/or ΔSUVMax +150%, because these are highly specific (96% and 94%, respectively) for histologic transformation.
Although it is standard practice in our center to perform rebiopsy in the work-up of suspected R/R lymphoma, this study did not capture cases in which rebiopsy was not performed after initial work-up with restaging PET. For instance, iNHL cases with low avidity or low tumor burden on r-PET may had been determined to not require therapy and monitored without rebiopsy. This selection bias could affect the optimal threshold coordinates, sensitivities, specificities on ROC curve analysis, and subsequently the PPV and NPV. Prospective studies are needed to further validate the predictive value of r-PET parameters.
Authorship
Contribution: S.H.W., E.A.H., and G.C. conceived and designed the project, obtained ethics approvals, interpreted and analyzed the data, and wrote the manuscript; S.T.L. contributed to data acquisition, performed the PET analysis, and interpreted the data; and E.R.S.C., M.B., and J.L. contributed to data acquisition, interpretation of data, and revision of the manuscript.
Conflict-of-interest disclosure: The authors declare no competing financial interests.
Correspondence: Geoffrey Chong, Department of Oncology, Olivia Newton-John Cancer Research Institute, Heidelberg, VIC 3084, Australia; email: geoff.chong@onjcri.org.au.
References
Author notes
∗E.A.H. and G.C. contributed equally to this work as senior authors.
Data are available upon reasonable request from the corresponding author, Geoffrey Chong (geoff.chong@onjcri.org.au).
The full-text version of this article contains a data supplement.

