TO THE EDITOR:
Aberrations in transcription and epigenetic factors lead to neoplastic transformation such as acute myeloid leukemia (AML), which is characterized by accumulation of hyperproliferative blasts originating from leukemic stem cells. The use of therapeutic agents designed to lift the differentiation block and reinforce terminal cellular differentiation and growth arrest is 1 way to manage AML pathophysiology. Therefore, understanding these critical regulatory switches is essential for designing selective and effective drug targets for AML. The ATP-dependent SWItch/sucrose non-fermentable (SWI/SNF) chromatin remodeling complex has been implicated in 20% cancers, including AML.1 The catalytic subunit, SMARCA4, drives leukemogenesis by facilitating constitutive Myc expression via enhancer remodeling.2,3 The loss of auxiliary subunits such as ACTL6A leads to proliferation defects in stem cells and bone marrow failure, whereas defects in SMARCD2 affect neutrophil development.4-6 This prompted us to investigate the differential expression of SWI/SNF complex subunits across different stages of blood cell development.
We mined several sequencing datasets for the expression of 21 subunits of SWI/SNF complex in various hematopoietic cells and found several of them to be differentially expressed in a cell type–specific manner (supplemental Figure 1). Interestingly, we found that the SMARCD isoforms showed distinct and opposing cell type–specific enrichment. SMARCD1 and SMARCD2 expression was high in CD34+ hematopoietic stem/progenitors (HSPCs), whereas SMARCD3 was specifically enriched in monocytes (Figure 1A; supplemental Figures 1 and 2). The role of SMARCD1 in myeloid differentiation and leukemia has not been investigated thus far, and hence, we validated the above findings using both ex vivo and in vitro hematopoietic models. SMARCD1 expression was high in cord blood–derived CD34+ HSPCs and was significantly reduced in macrophage colony stimulating factor–differentiated HSPCs (Figure 1B). Similarly, SMARCD1 expression was reduced in vitamin D3–differentiated HL-60 cells (Figure 1C). Interestingly, we observed concomitant increase in SMARCD3 expression in differentiated cord blood and promyelocytic human leukemia-60 (HL60) cells, indicating interplay of SMARCD isoforms in hematopoietic differentiation (Figure 1B-C). Next, we investigated the expression of SMARCD1 in patients with AML. Compared with the CD34− compartment, similar enrichment profiles of SMARCD1, SMARD2, and SMARCD3 were observed in the CD34+ AML HSPCs (Figure 1D). The French-American-British (FAB) system classifies AML based on their maturity, and as SMARCD1 expression is enriched in the HSPCs, we assessed its expression across subtypes. Interestingly, we found higher expression of SMARCD1 in undifferentiated AML (M0, M1, M2 subtypes) than in the more differentiated AML FAB subtypes (M3, M4, M5; Figure 1E). These observations indicate a strong correlation between SMARCD1 expression and undifferentiated cell state (both normal and leukemic). Furthermore, the leukemic cell lines show significant dependency on SMARCD1, highlighting its potential role in leukemic cells (supplemental Figure 2G-I). The preferential expression of SMARCD1 in normal and leukemic stem/progenitor cells is attributed to a high promoter accessibility of SMARCD1 in those cell types (supplemental Figure 2E-F).
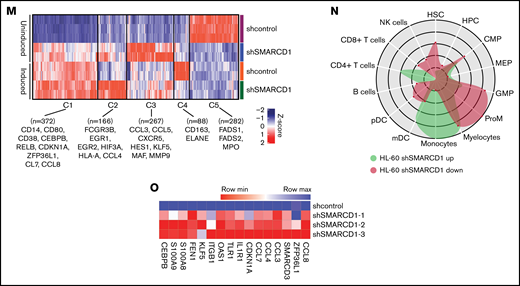

SMARCD1, enriched in hematopoietic progenitors, impedes myeloid differentiation genes by maintaining a repressive chromatin state. (A) Tags per million (TPM) count of SMARCD1 expression from cap analysis gene expression (CAGE)-sequencing data of CD34+ HSPCs and mature myeloid cells with indicated surface markers. (B) Relative log2 fold change in expression of SMARCD1 normalized to ACTB expression in CD34+ HSPCs isolated from cord blood and differentiated to monocytes/macrophages using macrophage-colony stimulating factor (M-CSF) for 10 days. Log2 fold changes were plotted from CD34+ cells isolated from 3 biological replicates. (C) Relative log2 fold change in expression of SMARCD isoforms in uninduced HL-60 cells compared with that after 48 hours of vitamin D3 (50 nM)–induced cells from 3 biological replicates. (D) Relative log2 fold change of SMARCD isoforms in CD34+ AML cells compared with that in the CD34− population. (E) SMARCD1 expression profile across FAB-classified patients with AML from the TCGA database. (F-L) HL-60 cells were transduced with lentiviruses expressing either empty vector (shcontrol) or short hairpin RNA targeting SMARCD1 (shSMARCD1), and all experiments were conducted 96 hours after selection in puromycin-containing media. (F) Total protein cell lysate (50 µg) from wild type, shcontrol, and shSMARCD1 was used for immunoblotting with SMARCD1 antibody. Representative immune blot images for HL-60 cells; ACTB was used as the loading control. (G-J) Flow cytometry analysis of shcontrol or shSMARCD1 HL-60 cells for myeloid differentiation markers CD11b and CD14. (G-J) Representative contour plots with grids, showing percent negative and positive population for single- and double-stained CD14-allophycocyanin-H7 (APC-H7) and CD11b-FITC (fluorescein) populations. (I) Mean fluorescent intensity (MFI) plots of shcontrol and shSMARCD1 HL-60. (H-J) Same analysis as panels G-I after induction with 10 nM vitamin D3 for 48 hours. (K-L) Representative May Grünwald Giemsa–stained images of shcontrol and shSMARCD1 HL-60 in uninduced cells (K) and after 48 hours of vitamin D3 induction (L) using a Zeiss Apotome 2 (63×, NA 1.4). All statistical parameters used in this figure are for n = 3 independent experiments; error bars indicate means ± standard deviation. *P = .05; **P = .005; ***P < .001; ****P < .0001: 2-tailed Student t test. (M-R) Transcriptomic analysis of SMARCD1 knockdown in HL-60 cells. (M) K-means clustering heat map of RNA-sequencing representing 1175 significantly differentially expressed genes (log2 fold change ≥ 2 and FDR ≤ 0.05; log2 fold change ≤ 2 and FDR ≤ 0.05) annexed from pairwise comparison of shcontrol vs shSMARCD1 under uninduced and induced (vitamin D3, 10 nM) conditions. (N) CellRadar analysis of differentially expressed genes after SMARCd1 knockdown in HL60 cells (https://karlssong.github.io/cellradar/). (O) Heat map representing delta cycle threshold values of indicated genes with respect to ACTB in shcontrol (mean of 3) and shSMARCD1 (n = 3). (P-S). Epigenetic regulation of SWI/SNF complex bound myeloid differentiation genes. (P) Co-immunoprepitation in HL-60 cells using SMARCA4 and SMARCD1 antibodies. Immunoglobulin G (IgG) was used as the negative control. Single representative blot from 2 independent experiment confirming BRG1 and SMARCD1 interaction using pull down and reverse pull down experiments. (Q) Chromatin immunoprecipitation (ChIP)-qPCR for SMARCA4 enrichment and control IgG in the promoter regions for indicated genes in HL-60 cells. (R-S) ChIP-qPCR for H3K4me3 (R) and H3K27me3 (S) marks normalized to the respective input control. IgG pull down was used as the control. Enrichment is plotted as percent input. P values (Student t test) for individual genes are shown in adjacent tables. All ChIP data are from 3 independent experiments. (T) Gene regulatory model for SMARCD1.
SMARCD1, enriched in hematopoietic progenitors, impedes myeloid differentiation genes by maintaining a repressive chromatin state. (A) Tags per million (TPM) count of SMARCD1 expression from cap analysis gene expression (CAGE)-sequencing data of CD34+ HSPCs and mature myeloid cells with indicated surface markers. (B) Relative log2 fold change in expression of SMARCD1 normalized to ACTB expression in CD34+ HSPCs isolated from cord blood and differentiated to monocytes/macrophages using macrophage-colony stimulating factor (M-CSF) for 10 days. Log2 fold changes were plotted from CD34+ cells isolated from 3 biological replicates. (C) Relative log2 fold change in expression of SMARCD isoforms in uninduced HL-60 cells compared with that after 48 hours of vitamin D3 (50 nM)–induced cells from 3 biological replicates. (D) Relative log2 fold change of SMARCD isoforms in CD34+ AML cells compared with that in the CD34− population. (E) SMARCD1 expression profile across FAB-classified patients with AML from the TCGA database. (F-L) HL-60 cells were transduced with lentiviruses expressing either empty vector (shcontrol) or short hairpin RNA targeting SMARCD1 (shSMARCD1), and all experiments were conducted 96 hours after selection in puromycin-containing media. (F) Total protein cell lysate (50 µg) from wild type, shcontrol, and shSMARCD1 was used for immunoblotting with SMARCD1 antibody. Representative immune blot images for HL-60 cells; ACTB was used as the loading control. (G-J) Flow cytometry analysis of shcontrol or shSMARCD1 HL-60 cells for myeloid differentiation markers CD11b and CD14. (G-J) Representative contour plots with grids, showing percent negative and positive population for single- and double-stained CD14-allophycocyanin-H7 (APC-H7) and CD11b-FITC (fluorescein) populations. (I) Mean fluorescent intensity (MFI) plots of shcontrol and shSMARCD1 HL-60. (H-J) Same analysis as panels G-I after induction with 10 nM vitamin D3 for 48 hours. (K-L) Representative May Grünwald Giemsa–stained images of shcontrol and shSMARCD1 HL-60 in uninduced cells (K) and after 48 hours of vitamin D3 induction (L) using a Zeiss Apotome 2 (63×, NA 1.4). All statistical parameters used in this figure are for n = 3 independent experiments; error bars indicate means ± standard deviation. *P = .05; **P = .005; ***P < .001; ****P < .0001: 2-tailed Student t test. (M-R) Transcriptomic analysis of SMARCD1 knockdown in HL-60 cells. (M) K-means clustering heat map of RNA-sequencing representing 1175 significantly differentially expressed genes (log2 fold change ≥ 2 and FDR ≤ 0.05; log2 fold change ≤ 2 and FDR ≤ 0.05) annexed from pairwise comparison of shcontrol vs shSMARCD1 under uninduced and induced (vitamin D3, 10 nM) conditions. (N) CellRadar analysis of differentially expressed genes after SMARCd1 knockdown in HL60 cells (https://karlssong.github.io/cellradar/). (O) Heat map representing delta cycle threshold values of indicated genes with respect to ACTB in shcontrol (mean of 3) and shSMARCD1 (n = 3). (P-S). Epigenetic regulation of SWI/SNF complex bound myeloid differentiation genes. (P) Co-immunoprepitation in HL-60 cells using SMARCA4 and SMARCD1 antibodies. Immunoglobulin G (IgG) was used as the negative control. Single representative blot from 2 independent experiment confirming BRG1 and SMARCD1 interaction using pull down and reverse pull down experiments. (Q) Chromatin immunoprecipitation (ChIP)-qPCR for SMARCA4 enrichment and control IgG in the promoter regions for indicated genes in HL-60 cells. (R-S) ChIP-qPCR for H3K4me3 (R) and H3K27me3 (S) marks normalized to the respective input control. IgG pull down was used as the control. Enrichment is plotted as percent input. P values (Student t test) for individual genes are shown in adjacent tables. All ChIP data are from 3 independent experiments. (T) Gene regulatory model for SMARCD1.
These observations prompted us to investigate the functional relevance of SMARCD1 in myeloid differentiation and leukemia maintenance. Hence, we knocked down SMARCD1 in promyelocytic HL-60 and pro-monocytic U937 cell lines and confirmed its absence at both RNA and protein levels (Figure 1F; supplemental Figure 3C-D). Flow cytometry was performed to assess myeloid differentiation defects in non-target/control shRNA (shcontrol) and short-hairpin RNA targeting SMARCD1 (shSMARCD1) groups, results of which showed a sevenfold increase in the number of CD11b and CD14 double-positive (DP) HL-60 cells (Figure 2G,I), whereas U937 cells showed a fivefold increase in the CD11b-positive population in the absence of SMARCD1 (supplemental Figure 3B-C), indicative of enhanced myeloid differentiation capabilities. Next, we assessed the responsiveness of shSMARCD1 leukemic cells toward external differentiating agents by treating them with vitamin D3. Interestingly, SMARCD1 depletion resulted in considerable enhancement of the DP population compared with that of the shcontrol in HL-60 (1.5-fold; P < .0001) and U937 cells (2.5-fold; P < .05; Figure 1H,J; supplemental Figure 3E-F). May Grünwald Giemsa staining showed clear cellular morphologic changes in uninduced and vitamin D3–induced shSMARCD1 HL-60 and U937 cells (nucleo-cytoplasmic ratio, bean shaped nuclei, and accumulation of vacuoles) compared with those in the respective controls, which corroborated the results of flow cytometry, thereby confirming enhancement of myeloid differentiation (Figure 1K-L; supplemental Figure 3G-H). This suggested that SMARCD1 knockdown predisposed the leukemic cells toward myeloid differentiation.


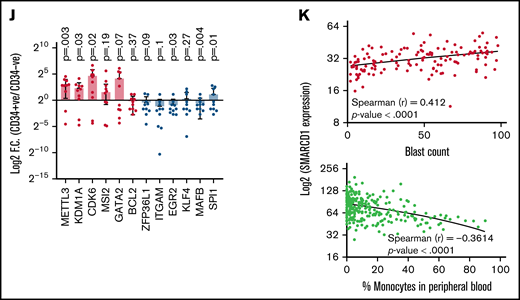
Patients with AML with high SMARCD1 levels harbor transcriptomic signatures of leukemic stem cells and show poor prognosis. (A-E) SMARCD1 regulates myeloid differentiation in patient-derived CD34+ HSPCs. (A) Log2 fold change of SMARCD1 expression calculated with respect to shcontrol cells using RT-PCR and (B) Western blot showing reduction in SMARCD1 levels on lentiviral transduction and after 96 hours of puromycin selection. ACTB mRNA was used for normalizing SMARCD1 expression in RT-PCR, and ACTB was used as the protein loading control. (C-D) Contour plots showing percentage of double-positive CD11b and CD14 cells and MFI plots of shcontrol and shSMARCD1-transduced CD34+ HSPCs. (E-F) Bright field images of shcontrol and shSMARCD1 cells in culture (E) and May Grünwald Giemsa (F) staining showing nucleo-cytoplasmic morphologic features. Error bars indicate means ± standard deviation. *P = .05; **P = .005: 2-tailed Student t test. (F-K) Transcriptomic signatures of AML patients with high and low SMARCD1 gene expression. Patients with AML from the TCGA cohort were stratified in the top and bottom 10th percentile as SMARCD1high and SMARCD1low groups. (F) Principal component analysis plots of SMARCD1high and SMARCD1low groups depicting clear segregation of the samples from TCGA. (G) Gene set enrichment analysis of transcriptomic signatures in SMARCD1high and SMARCD1low groups from AML TCGA cohorts. Normalized enrichment score (NES). (H) Z-score–normalized heat map representation of bona fide differentiation- and stemness-related genes in SMARCD1high and SMARCD1low groups from AML TCGA cohort. (I) Relative log2 fold change of indicated genes in CD34+ AML cells compared with that in the CD34− population. Error bars indicate means ± standard deviation; 2-tailed Student t test. (K) Correlation analysis showing positive correlation of AML patients in TCGA cohort with different levels of blast percentage (i) and negative correlation of SMARCD1 expression with percentage of monocytes present in peripheral blood of patients with AML in the BEAT AML cohort (ii).
Patients with AML with high SMARCD1 levels harbor transcriptomic signatures of leukemic stem cells and show poor prognosis. (A-E) SMARCD1 regulates myeloid differentiation in patient-derived CD34+ HSPCs. (A) Log2 fold change of SMARCD1 expression calculated with respect to shcontrol cells using RT-PCR and (B) Western blot showing reduction in SMARCD1 levels on lentiviral transduction and after 96 hours of puromycin selection. ACTB mRNA was used for normalizing SMARCD1 expression in RT-PCR, and ACTB was used as the protein loading control. (C-D) Contour plots showing percentage of double-positive CD11b and CD14 cells and MFI plots of shcontrol and shSMARCD1-transduced CD34+ HSPCs. (E-F) Bright field images of shcontrol and shSMARCD1 cells in culture (E) and May Grünwald Giemsa (F) staining showing nucleo-cytoplasmic morphologic features. Error bars indicate means ± standard deviation. *P = .05; **P = .005: 2-tailed Student t test. (F-K) Transcriptomic signatures of AML patients with high and low SMARCD1 gene expression. Patients with AML from the TCGA cohort were stratified in the top and bottom 10th percentile as SMARCD1high and SMARCD1low groups. (F) Principal component analysis plots of SMARCD1high and SMARCD1low groups depicting clear segregation of the samples from TCGA. (G) Gene set enrichment analysis of transcriptomic signatures in SMARCD1high and SMARCD1low groups from AML TCGA cohorts. Normalized enrichment score (NES). (H) Z-score–normalized heat map representation of bona fide differentiation- and stemness-related genes in SMARCD1high and SMARCD1low groups from AML TCGA cohort. (I) Relative log2 fold change of indicated genes in CD34+ AML cells compared with that in the CD34− population. Error bars indicate means ± standard deviation; 2-tailed Student t test. (K) Correlation analysis showing positive correlation of AML patients in TCGA cohort with different levels of blast percentage (i) and negative correlation of SMARCD1 expression with percentage of monocytes present in peripheral blood of patients with AML in the BEAT AML cohort (ii).
To delineate the global transcriptomic changes associated with SMARCD1, we performed RNA sequencing for shSMARCD1 and shcontrol for HL-60 and U937 cells with and without vitamin D3 induction. After comparing with the uninduced control HL-60 cells (shSMARCD1/shcontrol), we found 687 upregulated genes (log2 fold change ≥ 2 and false discovery rate [FDR] ≤ 0.05) and 273 downregulated genes (log2 fold change ≤ 2 and FDR ≤ 0.05). After vitamin D3 induction, 342 genes (log2 fold change ≥ 1.2 and FDR ≤ 0.05) were upregulated and 259 were downregulated (log2 fold change ≤ 1.2 and FDR ≤ 0.05; supplemental Table 4; supplemental Figure 4C-D). Next, we clustered gene expression data using K-means to segregate the data with unique gene expression signatures and identified 5 clusters (C1-C5) in HL-60 cells (Figure 1M). Clusters 1 to 4 represented genes that were downregulated in uninduced shcontrol cells compared with that in induced shcontrol or shSMARCD1 (uninduced/induced conditions) with distinct gene expression patterns across sample sets (supplemental Figure 5A). To understand the biological significance of the clusters, we conducted pathway analysis using cluster-specific genes. Clusters C1 to C3 were enriched with de-repressed genes specific for myeloid differentiation Gene Ontology terms (supplemental Figure 5B-D). Further data curation revealed upregulation of genes encoding monocyte-associated markers, immune genes, and transcriptional regulators (supplemental Figure 3E-F). Finally, we used CellRadar analysis and found that the genes upregulated on SMARCD1 knockdown in HL-60 cells were enriched for gene signatures of monocytes, whereas the downregulated genes were enriched for guanosine monophosphate and promyelocytic cell signatures (Figure 1N). We also validated the transcriptomic data for several upregulated genes using reverse transcriptase-quantitative polymerase chain reaction (RT-qPCR; Figure 1O). The transcriptomic features of the SMARCD1 knocked down U937 cells commensurate with our findings in HL-60 cells and are explained in supplemental Results and supplemental Figure 6. Thus, using 2 different cell lines, we identified a set of myeloid differentiation-related genes and pathways regulated by SMARCD1.
These global changes in gene expression prompted us to investigate SMARCD1’s interaction at upstream regulatory elements of key myeloid differentiation genes. Co-immunoprecipitation with SMARCA4 or SMARCD1 in HL-60 cells confirmed that SMARCD1 associates with the SWI/SNF complex (Figure 1P). Chromatin immunoprecipitation (ChIP) followed by RT-qPCR with SMARCA4-specific antibody showed SWI/SNF complex enrichment in the promoter regions of myeloid differentiation genes encoding surface markers (CD11B and CD14), transcriptional regulators (CDKN1A, ZFP36L1), chemotactic proteins (S100A8, and S100A9), and chemokines (CCL3, CLL4, CCL7, and CCL8) that were upregulated on SMARCD1 depletion (Figure 1Q). These results confirmed that SMARCD1 associates with the SWI/SNF complex and is recruited to the promoter regions of the myeloid differentiation-specific genes for transcriptional regulation. Furthermore, we investigated the enrichment of histone active (H3K4me3) and repressive (H3K27me3) marks at the promoter regions of these genes in the shcontrol and shSMARCD1 HL-60 cells. We found significant increase in H3K4me3 activation marks, with concomitant decrease in H3K27me3 repressive marks at the promoter regions of the abovementioned genes (Figure 1R-S). These findings are in agreement with those of a previous study showing that SMARCD1 regulated bivalent histone marks to maintain pluripotency in embryonic stem cells.7
Next, we determined whether the role of SMARCD1 in cell lines was in agreement with that in AML patient-derived CD34+ cells (ie, whether it promoted myeloid differentiation). We used RNAi to knockdown SMARCD1 in bone marrow or peripheral blood–derived CD34+ HSPCs from patients with AML and found both short hairpin/small interfering RNA (siRNA) knockdown reduced SMARCD1 expression levels (Figure 2A-B; supplemental Figure 7A). Flow cytometry analysis showed elevated levels of myeloid differentiation markers, CD11b and CD14, after SMARCD1 depletion (Figure 2C-D; supplemental Figure 7B-C). The nuclear morphology and macrophage-like features (adherence and radiating elongated processes) were consistent with the differentiated cellular morphology observed in shSMARCD1 cell lines (Figure 2E-F). Similar observations were found for siRNA-mediated knockdown of SMARCD1 in 3 AML patient–derived CD34+ HSPCs (supplemental Figure 7D). Thus, in vitro and ex vivo data confirmed SMARCD1 as a crucial switch required for repressing myeloid differentiation. To further strengthen our findings, we analyzed the RNA-sequencing data from a larger cohort of patients with AML from The Cancer Genome Atlas (TCGA) and Beat AML programme (BEAT).8 We stratified the transcriptome data into SMARCD1high (TCGA, n = 17; BEAT, n = 51) and SMARCD1low groups (TCGA n = 18; BEAT n = 49) to identify genes associated with differential SMARCD1 expression.8 Principal component analysis clearly segregated the SMARCD1high and SMARCD1low groups, reflecting differential transcriptomic profiles (Figure 2G). Gene set enrichment analysis showed that, compared with the SMARCD1low samples, the SMARCD1high samples were enriched for leukemic stem cell and other stemness-related pathways (Figure 2H). Heat map of selected genes from SMARCD1high and SMARCD1low samples showed contrasting expression of differentiation (down in SMARCD1high samples) and stemness-related genes and transcriptional regulators (up in SMARCD1high samples; Figure 2I). The transcriptomic signatures of the BEAT-AML cohort of SMARCD1high and SMARCD1low groups were in congruence with the TCGA cohort (supplemental Figure 8). We found higher expression of stemness-related (METTL3, KDM1A, CDK6, MSI2, and GATA2) and concomitant lower expression of myeloid differentiation-related genes (BCL2, ZFP36L1, ITGAM, EGR2, KLF4, MAFB, and SPI1) in AML patient–derived CD34+ cells using RT-qPCR, validating our findings from big data (Figure 2J). Finally, we observed that SMARCD1 expression in these patient cohorts correlated positively with leukemic blast percentage and negatively with peripheral monocyte counts (Figure 2K). Moreover, known oncogenes that drive the AML phenotype also associated with SMARCD1high cohort (supplemental Figure 8D). These results and existing evidence suggest that the SWI/SNF complex drives oncogenic transformation in AML in 2 ways: (1) by sustaining the expression of stemness/proliferation-related genes and (2) by repressing myeloid differentiation-related genes. Overall, the transcriptome profiles of patients with AML suggest a strong association, and possible coactivation, of gene expression program that drives stemness with SMARCD1 levels.
Previous studies have reported activating roles of the SWI/SNF complex in driving leukemogenesis. SMARCA4 and BRD9 activate the transcription of Myc in leukemic cells.3,9 In contrast, we report that SMARCD1, an auxiliary subunit of the SWI/SNF complex, acts as a global repressor of genes involved in myeloid differentiation. Krasteva et al4 reported that ACT6A, another auxiliary subunit of the SWI/SNF complex, is essential for maintaining murine HSCs and for promoting progenitor survival. Possibly both auxiliary subunits function for a common regulatory role in hematopoiesis. These studies indicate a context-dependent role of the SWI/SNF complex where it activates transcription of genes essential for HSPC maintenance and proliferation and simultaneously represses genes involved in differentiation. Our study strongly supports the role of SMARCD1 as a crucial switch both in maintaining HSPCs and preventing myeloid differentiation. Multiple studies have highlighted that the SWI/SNF complex plays a repressive role in mammalian systems via its interaction with LSD1, CoREST, and PRC2 complexes.10-12 Curation of the InnateDB (https://www.innatedb.com/) database revealed that the SMARCD1 isoform specifically interacts with NCOR1, HDAC1, HDAC3, PRMT6, and KDM1A in humans. Differentiation therapy is rapidly gaining momentum in AML treatment. Understanding the regulatory circuitry lead by SMARCD1 containing SWI/SNF complex in enforcing the undifferentiated state of leukemic blasts is crucial for selective targeting and attaining favorable therapeutic responses.
Our results highlight an essential role of SMARCD1 in sensitizing leukemic cells to external differentiation agents such as vitamin D3 and retinoic acid. Presently, inhibitors of SMARCD1 are not known, and hence, identification of small molecule inhibitors of SMARCD1 is essential for developing a combination therapy involving differentiating agents that can lower the levels of SMARCD1 and induce differentiation with standard chemotherapeutic drugs for AML. Moreover, our results highlight SMARCD1 as a novel single-gene based indicator of the transcriptomic identity of AML cells, which can be leveraged for developing treatment options in clinical settings. In future, detailed functional assessment of SMARCD1 in normal hematopoiesis and the composition of SWI/SNF in leukemic stem/progenitor cells will be necessary to completely understand the SMARCD1-mediated molecular mechanisms regulating distinct cell states in leukemia and its impact on chemotherapy and relapse.
Acknowledgments: The authors thank the members of the Laboratory Hematology, Division of Clinical Hematology, IMS & Sum Hospital, S 'O' A, for blood sample aspirations and clinical data; Moumita Biswas for professional scientific editing of the manuscript; all the parents who shared cord blood samples of their newborn children; and all the patients with AML who kindly shared their clinical samples for research purposes.
The authors acknowledge funding from a Department of Biotechnology (DBT)-Ramalingaswami Re-entry fellowship (BT/RLF/Re-entry/25/2015), a Science and Engineering Research Board (SERB) core research grant (CRG/2018/002052) to P.P., and intramural funding support from the Institute of Life Sciences. They also acknowledge institutional central core facilities for DNA sequencing, flow cytometry, qPCR, and the BSL-2 laboratory. S.S. and K.C.M. received institutional fellowships from ILS. S.M. received a fellowship under the Department of Science and Technology-Innovation in Science Pursuit for Inspired Research (DST-INSPIRE) scheme, Department of Science and Technology, Government of India. J.B. received a CSIR-UGC (Council of Scientific & Industrial Research-University Grants Commission) fellowship, Government of India.
Contribution: P.P. conceptualized the study, secured funding, directed overall flow, interpreted the data, and performed troubleshooting; S.S. initiated the work with SMARCD1; designed, standardized, and performed most experiments, and interpreted the data; P.S. supplied AML patient samples and clinical information; S.M., J.B., and S.B. performed wet laboratory experiments; K.C.M. and S. Chakraborty performed bioinformatics analysis; S. Chauhan and K.K.J. helped with the co-IP experiments; A.D. supplied cord blood samples; and P.P. and S.S. prepared the manuscript.
Conflict-of-interest disclosure: The authors declare no competing financial interests.
Correspondence: Punit Prasad, Institute of Life Sciences, Nalco Square, Chandrasekharpur, Bhubaneswar, Odisha 751023, India; e-mail: punit@ils.res.in.