

Key Points
Tet2 and Tet3 three-allele–deficient mice developed AML at longer latencies compared with four-allele–deficient mice.
Genetic abnormalities in the residual Tet2 or Tet3 wild-type allele were found in all the AMLs developed in the 3-allele deficient mice.

Abstract
Loss-of-function mutations in ten-eleven translocation-2 (TET2) are recurrent events in acute myeloid leukemia (AML) as well as in preleukemic hematopoietic stem cells (HSCs) of age-related clonal hematopoiesis. TET3 mutations are infrequent in AML, but the level of TET3 expression in HSCs has been found to decline with age. We examined the impact of gradual decrease of TET function in AML development by generating mice with Tet deficiency at various degrees. Tet2f/f and Tet3f/f mice were crossed with mice expressing Mx1-Cre to generate Tet2f/wtTet3f/fMx-Cre+ (T2ΔT3), Tet2f/fTet3f/wtMx-Cre+ (ΔT2T3), and Tet2f/fTet3f/fMx-Cre+ (ΔT2ΔT3) mice. All ΔT2ΔT3 mice died of aggressive AML at a median survival of 10.7 weeks. By comparison, T2ΔT3 and ΔT2T3 mice developed AML at longer latencies, with a median survival of ∼27 weeks. Remarkably, all 9 T2ΔT3 and 8 ΔT2T3 mice with AML showed inactivation of the remaining nontargeted Tet2 or Tet3 allele, respectively, owing to exonic loss in either gene or stop-gain mutations in Tet3. Recurrent mutations other than Tet3 were not noted in any mice by whole-exome sequencing. Spontaneous inactivation of residual Tet2 or Tet3 alleles is a recurrent genetic event during the development of AML with Tet insufficiency.
Introduction
The family of ten-eleven translocation (TET) methylcytosine dioxygenases, TET1, TET2, and TET3, convert 5-methylcytosine to 5-hydroxymethylcytosine, formylcytosine, and carboxylcytosine.1-4 In humans, TET2 loss-of-function mutations have been frequently found in myeloid malignancies such as acute myeloid leukemia (AML; 7.3%-23%), myelodysplastic syndromes (18%-33%), chronic myelomonocytic leukemia (22%-42%), and myeloproliferative neoplasms (7%-16%).5-13 In addition, TET2 is the second-most frequently mutated gene in age-related clonal hematopoiesis.14-16 Therefore, TET2 mutations clearly act as strong drivers for myeloid neoplasms but do not induce any disease by themselves, implying that concurrence of additional genetic events is necessary for the development of full-blown myeloid malignancies.
TET3 mutations, in contrast, were found in myeloid malignancies but only infrequently. mRNA expression of Tet3, however, declines with age in mouse hematopoietic stem cells (HSCs),17 as well as in human peripheral blood T cells.17,18 Therefore, the age-dependent impairment of TET enzymatic activity through TET2 mutations and decreased TET3 expression in HSCs may contribute to the development of myeloid neoplasms, most of which occur in the aging population. This notion is in line with the observation that induced deficiency of Tet2 and Tet3 led to aggressive development of AML in mice,19 whereas inactivation of either Tet2 or Tet3 alone did not.20,21 Deficiency of Tet2 alone in mice led to chronic myelomonocytic leukemia–like diseases20,22,23 and T-cell24 and B-cell malignancies25,26 depending on the type of strains. Tet3 deficiency alone did not significantly disturb hematopoiesis.21
To understand the mechanisms of leukemic transformation from age-related clonal hematopoiesis through impairment of TET function, we established mice with various degrees of three- and four-allele disruption of Tet2 and Tet3. Double homozygous disruption of Tet2 and Tet3 led to rapid development of AML, as previously described.19 Here, we show that mice deficient in three alleles of Tet2 and Tet3, in contrast, progressed to AML after longer latencies. Notably, the residual nontargeted Tet2 or Tet3 allele was genetically inactivated in all of the AMLs that developed in three-allele–deficient mice. Our data emphasize the roles of TET enzymes as gatekeepers to leukemic transformation.
Materials and methods
Mice
Tet2-floxed (Tet2f/f) mice were established as previously described.20 Tet3-floxed (Tet3f/f) mice were created by inserting loxP sites into introns 7 and 9 to delete the cysteine-rich Fe-binding domain (supplemental Figure 1A). C57BL/6 (CD45.1) recipients were purchased from CLEA Japan. Tet2f/f and Tet3f/f mice were crossed with mice expressing Cre recombinase under control of the type I interferon-inducible Mx1 murine promoter (Mx-Cre)27 to obtain Tet2f/wtTet3f/fMx-Cre+ (T2ΔT3), Tet2f/fTet3f/wtMx-Cre+ (ΔT2T3), and Tet2f/fTet3f/fMx-Cre+ (ΔT2ΔT3) mice. Neonatal mice received 3 intraperitoneal injections of polyinosinic:polycytidylic acid at a dose of 300 μg every other day from 2 days following birth. Tet2, Tet3, and Mx1-Cre alleles were genotyped by using tail DNA, and the 3 genotypes were distinguished according to multiplex polymerase chain reaction (PCR) (supplemental Methods; supplemental Table 1). The mice were housed at the Animal Center for Biomedical Research, University of Tsukuba, following institutional guidelines.
Cell lines
Bone marrow (BM) cells from leukemic T2ΔT3, ΔT2T3, and ΔT2ΔT3 mice were cultured in RPMI 1640 (MilliporeSigma) supplemented with 10% fetal bovine serum, 1% penicillin/streptomycin, and 10 ng/mL of murine interleukin-3 (Wako) at 37°C and 5% carbon dioxide for at least 1 month, resulting in the establishment of respective cell lines.
Quantitative real-time PCR
RNA was isolated by using the RNeasy Mini Kit (Qiagen) and transcribed with random hexamers using SuperScript III Reverse Transcriptase (Thermo Fisher Scientific) following the manufacturers’ protocols. Quantitative real-time PCR was performed by using FastStart SYBR Green Master mix or FastStart TaqMan Probe Master mix (Roche) on a 7500 Fast Real-Time PCR system (Applied Biosystems). Relative expression was determined by using the relative standard curve method. Each sample was analyzed in triplicate and normalized to 18S RNA. The samples, primers, and probes used for this experiment are shown in supplemental Tables 2 and 3.
BM transplantation
BM cells were isolated and flushed with phosphate-buffered saline supplemented with 1% bovine serum albumin by use of a syringe. For whole BM transplantation, 1 × 10⁶ total cells from T2ΔT3, ΔT2T3, and ΔT2ΔT3 mice with 2 × 10⁵ BM cells from wild-type CD45.1 mice were transplanted via the tail vein or orbital sinus into lethally irradiated (4.5 Gy × 2) CD45.1 recipients. At least 2 independent experiments were performed.
Cell viability assay
The cell lines established from T2ΔT3, ΔT2T3, and ΔT2ΔT3 cells were treated with decitabine at various concentrations for 48 hours. The cell viability was measured by means of a 2-(2-methoxy-4-nitrophenyl)-3-(4-nitrophenyl)-5-(2,4-disulfophenyl)-2H-tetrazolium (WST-8) assay using Cell Counting Kit-8 (Dojindo) following the manufacturer’s protocol on a microplate reader (Varioskan LUX; Thermo Fisher Scientific).
Whole-exome sequencing
Genomic DNA was extracted from leukemic BM and the corresponding tail from each T2ΔT3, ΔT2T3, and ΔT2ΔT3 leukemic mouse by use of a DNeasy Blood & Tissue kit (Qiagen). Whole-exome sequencing (WES) was performed as previously described with minor modifications.28 Briefly, the DNA integrity number of the genomic DNA of each sample was checked by using the Agilent TapeStation 2200. Libraries were prepared with SureSelectXT Mouse All Exon V2 using SureSelect Low Input Reagent Kit (Agilent Technologies) and 200 ng of genomic DNA. The sequencing reads were mapped on GRCm38/mm10 by use of a Burrows-Wheeler Aligner.29 Candidate variants were called by the Genomon2 Pipeline (https://github.com/Genomon-Project/GenomonPipeline). Somatic mutations with a Fisher exact test value >4 and an empirical Bayesian call >4 were adopted and filtered by excluding the following: (1) synonymous single nucleotide variants (SNVs); (2) variants only present in unidirectional reads; (3) variants located in intergenic, intronic, untranslated regions, and noncoding RNA regions; and (4) variants occurring in repetitive genomic regions. Candidate mutations were examined by manual inspection with an Integrative Genomics Viewer (IGV) and confirmed by Sanger sequencing using the primer sets listed in supplemental Table 4. We also applied CopywriteR (version 2.16.0) to data from WES for detection of copy number variation.30
Expression analysis in patients with AML
Normalized RNA expression data derived from primary de novo AML samples were obtained as indicated by expectation-maximization values from The Cancer Genome Atlas (TCGA).9
Statistical analysis
Results are expressed as mean ± standard error of the mean. Significant differences between the results were assessed by using an analysis of variance on Prism (GraphPad Software, version 6). Probability values <.05 were considered significant. A log rank test was used for survival curve analysis. Correlations of messenger RNA (mRNA) expression levels were evaluated by calculating the Pearson correlation coefficient.
Results
Both T2ΔT3 and ΔT2T3 mice develop AML with longer latencies than those of ΔT2ΔT3 mice
To investigate whether and how insufficient levels of TET enzymes affect the development of leukemia, we generated mice with Tet2 and Tet3 deficiency to various degrees: Tet2f/fTet3wt/wtMx-Cre+ (ΔT2), Tet2wt/wtTet3f/fMx-Cre+(ΔT3), Tet2f/wtTet3f/wtMx-Cre+(T2T3), Tet2f/wtTet3f/fMx-Cre+ (T2ΔT3), Tet2f/fTet3f/wtMx-Cre+ (ΔT2T3), and Tet2f/fTet3f/fMx-Cre+ (ΔT2ΔT3) mice. Sufficient excision of floxed alleles after injection of polyinosinic:polycytidylic acid was observed in BM cells (supplemental Figure 1B). ΔT2ΔT3 mice died after a median survival of 10.7 weeks (range, 5.42-15.42 weeks; n = 41) (Figure 1), an observation very similar to the one previously reported.19 In contrast, both T2ΔT3 and ΔT2T3 mice died after a longer median survival (27.2 and 28.0 weeks; range, 8.8-45.7 and 17.8-45.5 weeks; n = 51 and n = 47, respectively; P = .0001 for both). Approximately one-half of the ΔT2 mice died at 80 weeks of chronic myelomonocytic leukemia–like disease (data not shown), as previously described in these mice20 ; much smaller fractions of ΔT3 (7%) and T2T3 mice (12%) died at similar observation periods.

Survival curves of mice with Tet insufficiency. Kaplan-Meier survival curves of ΔT2ΔT3 (Mx1-Cre+Tet2f/fTet3f/f; n = 41); T2ΔT3 (Mx1-Cre+Tet2f/wTet3f/f; n = 51); ΔT2T3 (Mx1-Cre+Tet2f/fTet3f/w; n = 47); T2T3 (Mx1-Cre+Tet2f/wTet3f/w; n = 38); ΔT2 (Mx1-Cre+Tet2f/fTet3wt/wt, n = 61); and ΔT3 (Mx1-Cre+Tet2wt/wtTet3f/f, n = 73) mice. ****P < .0001.
Survival curves of mice with Tet insufficiency. Kaplan-Meier survival curves of ΔT2ΔT3 (Mx1-Cre+Tet2f/fTet3f/f; n = 41); T2ΔT3 (Mx1-Cre+Tet2f/wTet3f/f; n = 51); ΔT2T3 (Mx1-Cre+Tet2f/fTet3f/w; n = 47); T2T3 (Mx1-Cre+Tet2f/wTet3f/w; n = 38); ΔT2 (Mx1-Cre+Tet2f/fTet3wt/wt, n = 61); and ΔT3 (Mx1-Cre+Tet2wt/wtTet3f/f, n = 73) mice. ****P < .0001.
Marked peripheral blood leukocytosis, thrombocytopenia, and anemia accompanied by massive splenomegaly were observed in all euthanized T2ΔT3, ΔT2T3, and ΔT2ΔT3 mice. These findings and the blast-like morphology on microscopic observation suggested development of acute leukemia (Figure 2). Leukemic BM in all 18 T2ΔT3, 10 ΔT2T3, and 18 ΔT2ΔT3 mice showed c-Kit+ cells positive for CD16/32 and CD34 (Figure 3), although there was also an increase in cells of unknown origins expressing CD3 in 3 of the 18 T2ΔT3 mice and 2 of the 10 ΔT2T3 mice. Therefore, despite the difference in latency, the majority of the T2ΔT3 and ΔT2T3 mice developed AML with a similar phenotype as that in all the ΔT2ΔT3 mice.
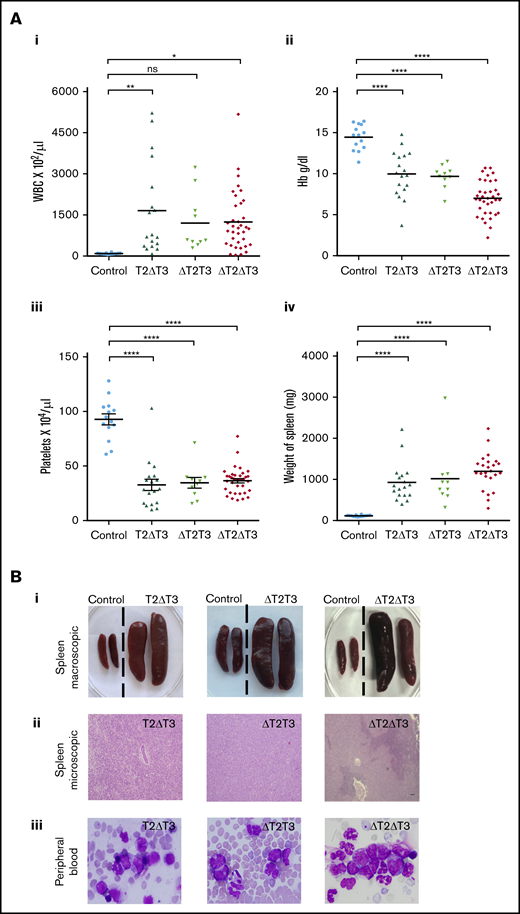
Characteristics of leukemia in T2ΔT3, ΔT2T3, and ΔT2ΔT3 mice. (A) WBC counts (i), hemoglobin levels (ii), and platelet counts (iii) of T2ΔT3 (n = 18), ΔT2T3 (n = 10), and ΔT2ΔT3 (n = 36) mice and of Mx1-Cre–Tet2f/fTet3f/w, Tet2f/wTet3f/f, or Tet2f/fTet3f/f mice (Control; n = 14), and spleen weights (iv) of T2ΔT3 (n = 18), ΔT2T3 (n = 10), and ΔT2ΔT3 (n = 24) mice and of control mice (n = 14). (Bi) Representative macroscopic photographs of spleen from leukemic T2ΔT3, ΔT2T3, and ΔT2ΔT3 mice. (Bii) Representative microscopic photographs showing obliteration of the normal spleen architecture in T2ΔT3, ΔT2T3, and ΔT2ΔT3 mice (hematoxylin and eosin stain; original magnification ×10). (Biii) Peripheral blood smear showing blast-like morphology from representative T2ΔT3, ΔT2T3, and ΔT2ΔT3 mice (Wright Giemsa stain; original magnification ×40). *P < .05, **P < .01, ****P < .0001. ns, not significant.
Characteristics of leukemia in T2ΔT3, ΔT2T3, and ΔT2ΔT3 mice. (A) WBC counts (i), hemoglobin levels (ii), and platelet counts (iii) of T2ΔT3 (n = 18), ΔT2T3 (n = 10), and ΔT2ΔT3 (n = 36) mice and of Mx1-Cre–Tet2f/fTet3f/w, Tet2f/wTet3f/f, or Tet2f/fTet3f/f mice (Control; n = 14), and spleen weights (iv) of T2ΔT3 (n = 18), ΔT2T3 (n = 10), and ΔT2ΔT3 (n = 24) mice and of control mice (n = 14). (Bi) Representative macroscopic photographs of spleen from leukemic T2ΔT3, ΔT2T3, and ΔT2ΔT3 mice. (Bii) Representative microscopic photographs showing obliteration of the normal spleen architecture in T2ΔT3, ΔT2T3, and ΔT2ΔT3 mice (hematoxylin and eosin stain; original magnification ×10). (Biii) Peripheral blood smear showing blast-like morphology from representative T2ΔT3, ΔT2T3, and ΔT2ΔT3 mice (Wright Giemsa stain; original magnification ×40). *P < .05, **P < .01, ****P < .0001. ns, not significant.
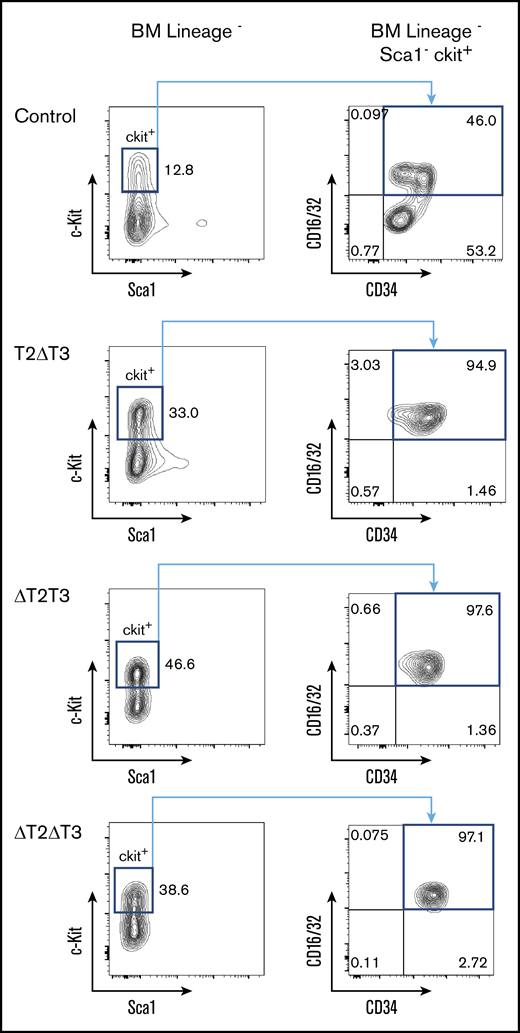
Representative flow cytometric analysis of BM from control, T2ΔT3, ΔT2T3, and ΔT2ΔT3 mice. Flow cytometry analysis of BM from representative leukemic ΔT2ΔT3, T2ΔT3, and ΔT2T3 mice for c-Kit, Sca1, CD16/32, and CD34.
Representative flow cytometric analysis of BM from control, T2ΔT3, ΔT2T3, and ΔT2ΔT3 mice. Flow cytometry analysis of BM from representative leukemic ΔT2ΔT3, T2ΔT3, and ΔT2T3 mice for c-Kit, Sca1, CD16/32, and CD34.
We confirmed the penetrance of AML via transplantation of BM cells of leukemic T2ΔT3, ΔT2T3, and ΔT2ΔT3 mice to irradiated congenic mice (supplemental Figure 2A-B). Whole BM cells from T2ΔT3, ΔT2T3, and ΔT2ΔT3 mice with AML were easily propagated in liquid culture supplemented with interleukin-3 for at least 3 months (data not shown). The cell lines showed c-Kit+ cells partially positive for CD16/32 and CD34 that were similar in characteristics to the primary leukemic BM cells (supplemental Figure 3). When treated with the hypomethylating agent (HMA) decitabine, cell growth was dose dependently inhibited in all AML cell lines examined (supplementary Figure 4). The sensitivity was similar irrespective of the genotype of the mice from which the cell lines were derived.
In summary, T2ΔT3 and ΔT2T3 mice with three-allele disruption in Tet2 and Tet3 developed AML, with significantly longer latencies than those with four-allele disruption. AML cells arising from the three-allele disrupted T2ΔT3 and ΔT2T3 mice presented an indistinguishable phenotype similar to the phenotype that developed in the four-allele–disrupted ΔT2ΔT3 mice.
Inactivation of the Tet2 or Tet3 nontargeted allele is a recurrent clonal event
Quantitative real-time PCR for the leukemic BM cells of all the T2ΔT3 mice (n = 7) exhibited very low levels of Tet2 (exon 10-11 region) expression, similar to those in the leukemic BM cells of the ΔT2ΔT3 mice (Figure 4A). The leukemic BM cells from 2 of the 4 ΔT2T3 mice exhibited very low levels of Tet3 (exon 7-8 region) expression, similar to those in the leukemic BM cells of the ΔT2ΔT3 mice. Two samples from the ΔT2T3 mice (#47 and #60) showed expression of Tet3 at a level comparable to that from the control mice (Figure 4B).
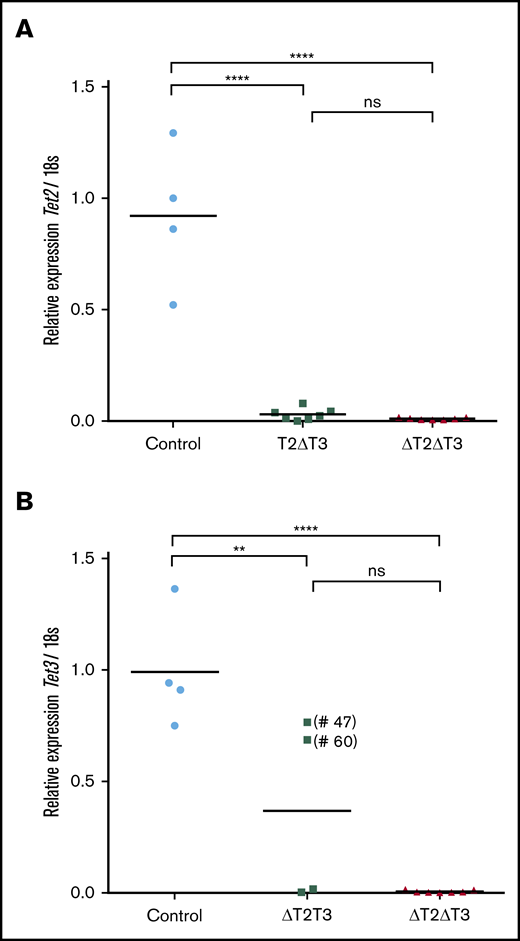
Quantitative real-time PCR analysis. This analysis of Tet2 (A) and Tet3 (B) transcript levels in leukemic BM cells from T2ΔT3 (n = 7), ΔT2T3 (n = 4), and ΔT2ΔT3 (n = 7) mice and in whole BM cells from Mx1-Cre–Tet2f/fTet3f/w, Tet2f/wTet3f/f, or Tet2f/fTet3f/f mice (Control; n = 4). The results are normalized to 18S ribosomal RNA and shown relative to the levels seen in the control samples. The samples with presence of residual Tet3 (exon 7-8 region) transcript is denoted within parentheses (#47 and #60). **P < .01, ****P < .0001.
Quantitative real-time PCR analysis. This analysis of Tet2 (A) and Tet3 (B) transcript levels in leukemic BM cells from T2ΔT3 (n = 7), ΔT2T3 (n = 4), and ΔT2ΔT3 (n = 7) mice and in whole BM cells from Mx1-Cre–Tet2f/fTet3f/w, Tet2f/wTet3f/f, or Tet2f/fTet3f/f mice (Control; n = 4). The results are normalized to 18S ribosomal RNA and shown relative to the levels seen in the control samples. The samples with presence of residual Tet3 (exon 7-8 region) transcript is denoted within parentheses (#47 and #60). **P < .01, ****P < .0001.
DNA prepared from the leukemic BM of the T2ΔT3 and ΔT2T3 mice and those from their respective tails were applied to multiplex PCR to analyze the status of the Tet2 and Tet3 alleles. The AML samples from all 9 T2ΔT3 and 6 of the 8 ΔT2T3 mice analyzed showed lack of amplification of the sequences corresponding to the loxP-targeted regions: exon 11 of Tet2 and exons 8 and 9 of Tet3, respectively. These exons were amplified in the tail DNA (Figure 5). Exons 8 and 9 of Tet3 were amplified in 2 AML samples (#47 and #60).
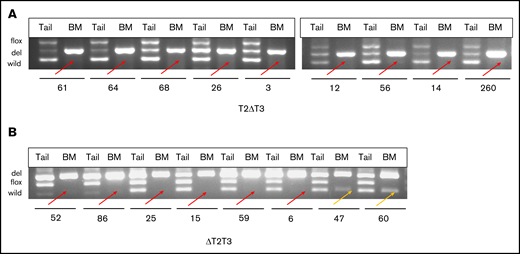
Multiplex PCR of leukemic BM with respective tails from T2ΔT3 and ΔT2T3 mice. Multiplex PCR was performed for the regions spanning the loxP sites on Tet2 (exon 11) and Tet3 (exons 8 and 9) in the BM and tail DNA of T2ΔT3 (n = 9) (A) and ΔT2T3 (n = 8) (B) mice, respectively. Lack of amplification of the Tet2 and Tet3 wild-type allele in BM from T2ΔT3 (n = 9) and ΔT2T3 (n = 6) mice is highlighted with red arrows. Amplification of the Tet3 wild-type allele in BM from ΔT2T3 mice (n = 2; #47 and #60) is highlighted with yellow arrows. flox, del, and wild: PCR products representing floxed, deleted, and wild-type alleles.
Multiplex PCR of leukemic BM with respective tails from T2ΔT3 and ΔT2T3 mice. Multiplex PCR was performed for the regions spanning the loxP sites on Tet2 (exon 11) and Tet3 (exons 8 and 9) in the BM and tail DNA of T2ΔT3 (n = 9) (A) and ΔT2T3 (n = 8) (B) mice, respectively. Lack of amplification of the Tet2 and Tet3 wild-type allele in BM from T2ΔT3 (n = 9) and ΔT2T3 (n = 6) mice is highlighted with red arrows. Amplification of the Tet3 wild-type allele in BM from ΔT2T3 mice (n = 2; #47 and #60) is highlighted with yellow arrows. flox, del, and wild: PCR products representing floxed, deleted, and wild-type alleles.
We next performed WES for DNA from leukemic BM cells with their respective tail DNA from T2ΔT3 (n = 6), ΔT2T3 (n = 8), and ΔT2ΔT3 (n = 4) mice (Table 1). The mean sequence depth for all samples was 90× (supplemental Figure 5). After application of the Burrows-Wheeler Aligner and Genomon2 pipeline, 10 nonsilent somatic mutations in 9 genes were identified in 9 leukemic BM samples from three-allele–disrupted mice with AML (n = 14) (supplemental Table 5). Seven of 10 mutations were analyzed and confirmed by Sanger sequencing (Figure 6B; supplemental Figure 6). Using the same protocol aforementioned, we did not identify any somatic SNVs in the leukemic BM samples from 4-allele–disrupted mice (n = 4) (Figure 6A). Interestingly, recurrent mutations were found only in the Tet3 gene in leukemic BM samples from ΔT2T3 mice (n = 2; #47 and #60). These were stop-gain SNVs at exons 5 (#47) and 6 (#60). Both of these nonsense mutations resulted in loss of the catalytic domain of Tet3 (Figure 6C).
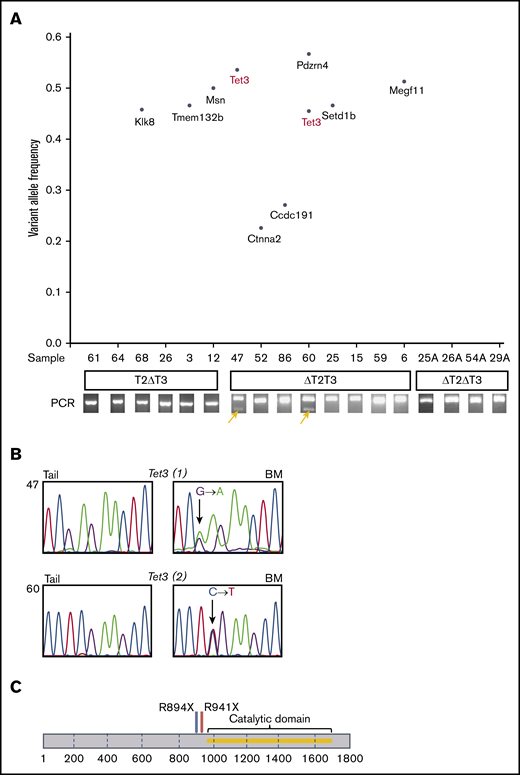
WES of T2ΔT3, ΔT2T3, and ΔT2ΔT3 mice. (A) Variant allele frequency plot of mutations revealed by WES of paired tail and BM samples from T2ΔT3, ΔT2T3, and ΔT2ΔT3 mice. Amplification of the Tet3 wild-type allele in BM from ΔT2T3 mice (n = 2; #47 and #60) is highlighted with yellow arrows as shown in Figure 5. (B) Validation of Tet3 mutations identified in WES by Sanger sequencing. (C) Position of Tet3 mutations revealed by exome sequencing in samples #47 (R894X) and #60 (R941X) are shown in the Tet3 gene.
WES of T2ΔT3, ΔT2T3, and ΔT2ΔT3 mice. (A) Variant allele frequency plot of mutations revealed by WES of paired tail and BM samples from T2ΔT3, ΔT2T3, and ΔT2ΔT3 mice. Amplification of the Tet3 wild-type allele in BM from ΔT2T3 mice (n = 2; #47 and #60) is highlighted with yellow arrows as shown in Figure 5. (B) Validation of Tet3 mutations identified in WES by Sanger sequencing. (C) Position of Tet3 mutations revealed by exome sequencing in samples #47 (R894X) and #60 (R941X) are shown in the Tet3 gene.
Manual inspection on IGV of WES data showed an absence of reads on exon 11 of Tet2 in all the T2ΔT3 mice-derived AML samples (n = 6) (Figure 7A), which corresponded to the absence of amplification in PCR (Figure 5A). Similarly, the sequencing reads of exons 8 and 9 of Tet3 were absent in 6 of the 8 AML samples from ΔT2T3 mice (n = 6) (Figure 7B), which also corresponded to their absence of amplification in PCR (Figure 5B). As expected, IGV inspection revealed reads of exons 8 and 9 of Tet3 in 2 samples from ΔT2T3 mice, in which somatic Tet3 nonsense SNVs were identified (#47 and #60). Copy number analysis of the WES data did not detect deletion involving either Tet2 or Tet3 (supplemental Figure 7). In conclusion, inactivation of residual nontargeted alleles of Tet2 or Tet3 is an extremely recurrent event that leads to AML development. Inactivation was due to loss of exon(s) corresponding to the loxP-targeted regions in the nontargeted allele (in most of the three allele–disrupted mice-derived AML) or due to loss-of-function Tet3 mutations (in 2 ΔT2T3 mice).
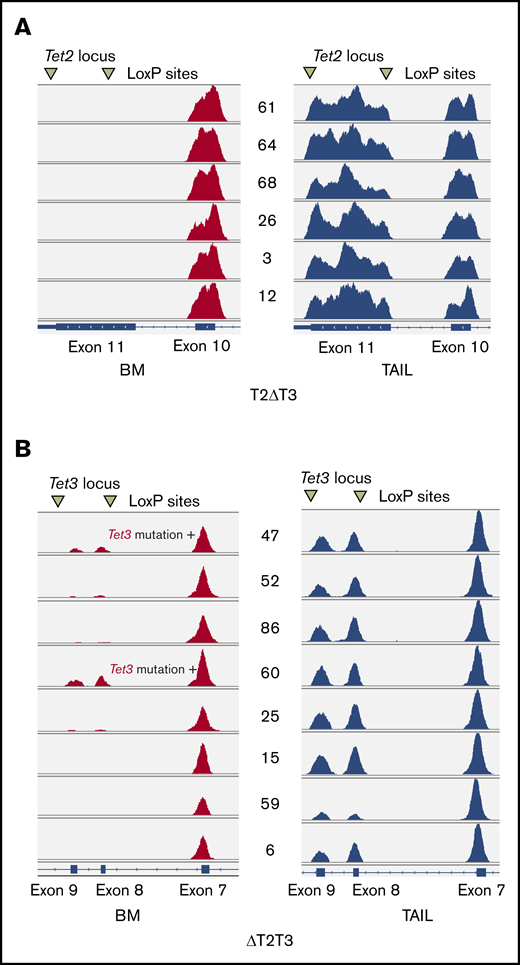
Graphical representation of exome sequencing of T2ΔT3 and ΔT2T3 mice on IGV. IGV-inspected sequence reads of Tet2 locus in T2ΔT3 mice (A) and on Tet3 locus in ΔT2T3 mice (B) are shown for BM (red) and tail (blue) DNA. Note that the absence of reads is shown for exon 11 of Tet2 in leukemic BM of T2ΔT3 mice (n = 6; panel A) and for exons 8 and 9 of Tet3 in leukemic BM of T2ΔT3 mice (n = 6; panel B). Reads were present in the BM of 2 T2ΔT3 mice (#47 and #60).
Graphical representation of exome sequencing of T2ΔT3 and ΔT2T3 mice on IGV. IGV-inspected sequence reads of Tet2 locus in T2ΔT3 mice (A) and on Tet3 locus in ΔT2T3 mice (B) are shown for BM (red) and tail (blue) DNA. Note that the absence of reads is shown for exon 11 of Tet2 in leukemic BM of T2ΔT3 mice (n = 6; panel A) and for exons 8 and 9 of Tet3 in leukemic BM of T2ΔT3 mice (n = 6; panel B). Reads were present in the BM of 2 T2ΔT3 mice (#47 and #60).
Loss of wild-type Tet2 allele occurs before onset of full-blown AML development
We tried to examine the deletion status of residual alleles during the time course of leukemia development. Initially, we performed multiplex PCR of myeloid, B cells, and T cells sorted from peripheral blood of T2ΔT3 mice (n = 2) at 10 weeks. We continued to observe the PCR results at regular intervals of 8 weeks (supplemental Figure 8A). We also performed flow cytometry for peripheral blood cells of these mice simultaneously and observed a gradual increase in of CD11b/Gr1+ fraction (supplemental Figure 8B). At the age of ∼35 weeks, the wild-type Tet2 band became invisible in the myeloid cells in these mice. Mouse #10 showed a white blood cell (WBC) count of 125 × 102/μL and hemoglobin of 10.7 g/dL, and mouse #12 showed a WBC count of 282 × 102/μL and hemoglobin of 11.9 g/dL (supplemental Figure 8C). Although the blood parameters did not fulfill our definition of leukemia (WBC count >200 × 102/μL and hemoglobin <10 g/dL), the data indicated progression toward leukemia in these mice. Hence, we think that loss of the remaining Tet2 and Tet3 allele is a relatively early event that eventually leads to leukemia.
TET3 transcript levels are positively correlated with TET2 transcript levels in patients with AML
We sought to examine TET gene expression profiles in AML samples. RNA-sequencing profiles of 166 de novo AML samples from the TCGA dataset were assessed.9 TET2 and TET3 mRNA expression levels positively correlated with each other (supplemental Figure 9A). In contrast, expression of TET1 and TET2 (supplemental Figure 9B) or TET1 and TET3 did not seem to vary in parallel (supplemental Figure 9C).
Discussion
We report here the phenotypic and genotypic characterization of AML that developed in mice with three-allele disruption of Tet2 and Tet3. The AML cell phenotype that developed in these mice was reminiscent of those with four-allele disruption in terms of cell surface antigen expression, penetrance of the diseases in the transplanted mice, and response to an HMA in vitro. However, the latencies were significantly longer in the three-allele–deficient mice, indicating the requirement of additional genetic events for disease development. Using PCR and WES, we showed that inactivation of the functional Tet2 or Tet3 allele was an extremely frequent event, as well as the only recurrent event, identified in AML cells. Thus, the AML genotype that developed in the three-allele–disrupted mice closely resembles that developed in the four-allele–disrupted mice. This finding could explain why the phenotypes of AML were very similar in both the three-allele– and the four-allele–deficient mice. Considering that deletion of Tet2 or Tet3 was not detected by copy number analysis with the WES data, uniparental disomy may cause duplication of the region deleted by the loxP system, exon 11 of Tet2, and exons 8 and 9 of Tet3. TET2 abnormalities in patients with hematologic malignancies are often biallelic, due to uniparental disomy, microdeletion plus SNV, and heterozygous SNVs.5,7,10,31-34 In this regard, it is not surprising that loss of the Tet2 allele frequently occurred in our mouse model. In patients, TET2 mutations often accompany mutations in other genes. However, concurrent identification of TET2 and TET3 mutations was reported only in limited cases.35 TET3 mRNA level has been shown to decrease in aged hematopoietic stem cells.17 Our findings of development of AML in three-allele knockout mice and the positive correlation between mRNA expression of TET2 and TET3 from the TCGA dataset could suggest an interesting relation between TET3 expression and leukemia. Whether downregulation of TET3 contributes to AML development in elderly individuals needs to be further clarified in future studies.
TET enzymes regulate the methylation status at the cytosine guanine dinucleotide sites of genomic DNA, mainly at the gene body.36 In line with this, cytosine hypermethylation is seen in BM cells of patients with myeloid malignancies harboring TET2 mutations.37 HSCs/progenitor cells of mice with a four-allele deficiency of Tet2 and Tet3 genes also reportedly exhibit hypermethylation status.19 The current observations indicate that the profound hypermethylation status induced by severe reduction of the enzymatic function of TET2 and TET3 could be sufficient per se for the promotion of full-blown AML. This hypothesis is also supported by the fact that no additional gene mutations were identified in four-allele–deficient AML cells by WES. Some nonrecurrent mutations in three-allele–deficient mice, such as Set domain containing the 1b (Setd1b), Catenin α 1 (Ctnna1), Olfactory receptor (Olfr152), membrane organizing extension spike protein (Msn), and multiple epidermal growth-factor like domains (Megf11), have been identified in human AML cells and, thus, might have made some contribution.28,38-44
In conclusion, our findings emphasize that the remaining intact Tet2 or Tet3 allele may act as a gatekeeper to prevent HSC from AML progression. Some AML cells may indeed depend on the hypermethylation status induced by severely reduced TET enzymatic activity. These conditions could be explored as potential therapeutic targets by HMAs.
Acknowledgments
The authors thank Flaminia Miyamasu, Medical English Communications Center, University of Tsukuba, for her professional editorial assistance.
This work was supported by Grants-in-Aid for Scientific Research (KAKENHI: 18H02834 [M.S.-Y.], 16H02660 [S.C.], and JP15H05909 and JP19H05656 [S.O.]) from the Ministry of Education, Culture, Sports, and Science of Japan, AMED (JP19lm0203010 [M.S.-Y. and S.C.] and JP19ck0106250h0003 [S.O.]), and P-CREATE from AMED (0106505h) (S.C.). R. Shrestha is a scholarship recipient of the Otsuka Toshimi Scholarship Foundation (Osaka, Japan).
Authorship
Contribution: R. Shrestha, K.M., and M.I. performed the experiments and data analysis; O.A.B. and E.M. provided the Tet2f/f mice; H.K. provided the Tet3f/f mice; M.O., Y. Suehara, K.F., Y.N.-T., H. Matsui, T.K., H. Muto, T.S., M.K., Y.N., H. Makishima, H.U., R. Saiki, S.O., K.C., Y. Shiraishi, S.M., E.M., T.I., and A.I. were actively involved in discussion; R. Shrestha, M.S.-Y. and S.C. generated the figures and tables and wrote the manuscript; S.C. led the entire project; and all the authors participated in discussions and interpretation of the data and results.
Conflict-of-interest disclosure: The authors declare no competing financial interests.
Correspondence: Shigeru Chiba, Department of Hematology, Faculty of Medicine, University of Tsukuba, 1-1-1 Tennodai, Tsukuba, Ibaraki 305-8575, Japan; e-mail: schiba-tky@umin.net; or Mamiko Sakata-Yanagimoto, Department of Hematology, Faculty of Medicine, University of Tsukuba, 1-1-1 Tennodai, Tsukuba, Ibaraki 305-8575, Japan; e-mail: sakatama-tky@umin.net.


