Key Points
Ring sideroblasts in AML are associated with complex karyotypes and TP53 mutations.
Gene expression studies in CD34+ AML cells suggest an altered erythroid differentiation program in AML with ring sideroblasts.
Abstract
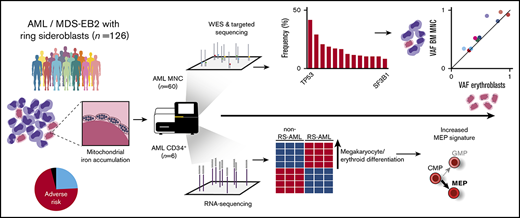
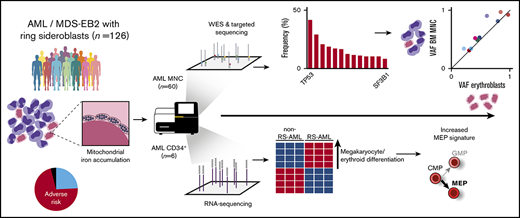
Ring sideroblasts (RS) emerge as result of aberrant erythroid differentiation leading to excessive mitochondrial iron accumulation, a characteristic feature for myelodysplastic syndromes (MDS) with mutations in the spliceosome gene SF3B1. However, RS can also be observed in patients diagnosed with acute myeloid leukemia (AML). The objective of this study was to characterize RS in patients with AML. Clinically, RS-AML is enriched for ELN adverse risk (55%). In line with this finding, 35% of all cases had complex cytogenetic aberrancies, and TP53 was most recurrently mutated in this cohort (37%), followed by DNMT3A (26%), RUNX1 (25%), TET2 (20%), and ASXL1 (19%). In contrast to RS-MDS, the incidence of SF3B1 mutations was low (8%). Whole-exome sequencing and SNP array analysis on a subset of patients did not uncover a single genetic defect underlying the RS phenotype. Shared genetic defects between erythroblasts and total mononuclear cell fraction indicate common ancestry for the erythroid lineage and the myeloid blast cells in patients with RS-AML. RNA sequencing analysis on CD34+ AML cells revealed differential gene expression between RS-AML and non RS-AML cases, including genes involved in megakaryocyte and erythroid differentiation. Furthermore, several heme metabolism-related genes were found to be upregulated in RS- CD34+ AML cells, as was observed in SF3B1mut MDS. These results demonstrate that although the genetic background of RS-AML differs from that of RS-MDS, they have certain downstream effector pathways in common.
Introduction
Ring sideroblasts (RS) are erythroid precursor cells that accumulate excessive mitochondrial iron and can be observed in bone marrow (BM) smears associated with multiple medical conditions.1 Presence of RS is a characteristic feature in myelodysplastic syndrome (MDS) subtypes, including MDS with single lineage dysplasia (MDS-RS-SLD), multilineage dysplasia (MDS-RS-MLD), and in combination with the presence of thrombocytosis (MDS/MPN-RS-T).2 Nonmalignant causes of RS include several drugs, toxins, alcohol, copper deficiency, and congenital sideroblastic anemia.3 This latter group comprises conditions caused by inborn defects in genes that operate in several mitochondrial pathways, including ALAS2, ABCB7, SLC25A38, and HSPA9.4-7
In MDS, the RS phenotype is strongly correlated with mutations in splicing factor 3B subunit 1 (SF3B1), with an incidence higher than 80%.8-12 SF3B1 mutations are usually observed in low-risk MDS, which is characterized by a stable clinical course and a low risk for leukemic transformation.8,13 As a core component of the U2 small nuclear ribonucleoprotein particle (snRNP), SF3B1 is essential for pre-RNA splicing.14 The molecular mechanism by which SF3B1 mutations result in RS formation is not yet fully understood. A proposed mechanism is that specific patterns of missplicing result in altered expression of genes that are essential for correct programming of erythropoiesis.15-17
The relationship between genetic defects in SF3B1 and the RS phenotype is not 1-to-1; in 10% to 20% of the patients with MDS-RS, no mutation in the SF3B1 gene is detected.8-12 Moreover, RS can also be present in a subset of patients with acute myeloid leukemia (AML), whereas SF3B1 mutations are infrequent in this disease.10,18,19 In addition to SF3B1, the only other correlation between a gene defect and the RS phenotype was described for PRPF8, for which mutations are reported in ∼3% of myeloid neoplasms, including MDS, MDS/MPN, and (s)AML.20
In the present study, we determined the prevalence of RS in various ontogenic AML subtypes and the association of the RS phenotype in AML with adverse risk characteristics. To identify the landscape of genomic defects that underlies the RS phenotype in AML, we performed whole-exome sequencing (WES), targeted sequencing, and SNP array analysis. Finally, to identify differential expression of genes associated with the RS phenotype in AML, we performed RNA sequencing on CD34+-selected AML cells.
Materials and methods
Patients and data collection
For this study, we collected data from 126 patients with AML and high-risk MDS (≥10% BM blasts) who were diagnosed between January 2000 and April 2018 at the University Medical Center Groningen. The inclusion criterion was the presence of RS in the diagnostic BM smear. Patients with previously reported MDS-RS were excluded. Diagnosis and risk classification was revised on the basis of World Health Organization classification (2016)2 and European Leukemia Net (ELN) recommendations (2017).21 BM and/or peripheral blood (PB) from patients were biobanked after informed consent for investigational use. The study was conducted in accordance with the Declaration of Helsinki and institutional guidelines and regulations. Morphological and cytogenetic analyses were based on standard procedures. On iron-stained aspirate smears, 400 red blood cell precursors were counted. RS were defined by at least 5 iron granules encircling one third or more of the nucleus. The RS percentage was determined as percentage of the total red blood cell precursor cells.
Sorting of cell fractions
The mononuclear cell (MNC) fraction from BM and/or PB was obtained by density gradient centrifugation, using Lymphoprep (PAA, Cölbe, Germany) according to standard procedures. Analysis and sorting of various cell fractions was performed on MoFlo XDP or Astrios (Beckman Coulter). A list of antibodies can be found in the supplemental Methods.
DNA isolation and amplification
Genomic DNA from various cell fractions was extracted with the NucleoSpin Tissue kit (Macherey-Nagel, Düren, Germany) according to the manufacturer’s instructions. In case of insufficient yield, a maximum of 70 ng DNA was amplified using the Qiagen REPLI-g kit (Qiagen, Venlo, The Netherlands), according to the manufacturer’s protocol.
Targeted deep sequencing, using a myeloid gene panel
Targeted sequencing of DNA derived from BM or PB samples obtained at diagnosis was carried out using the myeloid TruSight sequencing panel (Illumina, San Diego, CA) or by an in-house sequencing panel containing 27 genes (supplemental Table 1). Library preparation was performed according to the manufacturer’s protocol (Illumina). Aligning and filtering of sequencing data were performed using NextGENe version 2.3.4.2 (SoftGenetics). Cartagenia Bench Laboratory NGS (Agilent, Santa Clara, CA) was used for analysis of the resulting vcf files. Sequencing artifacts were excluded using a threshold of 5%. A minimal variant read depth of 20 reads was set as criterion. Variants that frequently occur in the general healthy population (>2% 1000 Genome phase 1, ESP6500, and dbSNP, and >5% Genome of the Netherlands) were excluded from further analysis.
Microarray-based genomic profiling
Microarray-based genomic profiling on MNC and erythroblast fractions was performed on a CytoScan HD array platform (Affymetrix, Inc., Santa Clara, CA) in agreement with the manufacturer’s reference. Data analysis was performed using Chromosome Analysis Suite software package (Affymetrix), using annotations of reference genome build GRCh37 (hg19). Comprehensive analysis and interpretation of the obtained microarray genomic profiling data were performed using a previously described filtering pipeline and criteria.22 Aberrations meeting these criteria were included for genomic profiling and described in accordance with the standardized ISCN 2016 nomenclature system.23 Visualization of the resultant genomic profiles was performed using NEXUS software (Nexus Copy Number 8.0; BioDiscovery, El Segundo, CA).
WES and confirmation of mutations in erythroblasts
WES to an average depth of 143× was performed on DNA isolated from diagnostic BM-MNC (n = 13) or PB-MNC (n = 3) samples. The procedure is described in more detail in the supplemental Methods. For a subset of patients, the presence of somatic variants in TP53 and SRSF2 identified by WES was validated and quantified in the erythroblast fraction, as described in the supplemental Methods.
RNA extraction and Illumina high-throughput sequencing
RNA was isolated by separation of the aqueous phase by TRIzol Reagent (Thermo Fisher) according to the manufacturer’s protocol. The aqueous phase was subsequently mixed 1:1 with 70% ethanol, and isolation was continued using the RNeasy mini kit (Qiagen), including performing on-column DNaseI treatment. Library preparation, Illumina high-throughput sequencing, and RNA-seq data analysis are described in detail in the supplemental Methods.
Statistical analysis
Bivariate correlations were made using a Pearson correlation (continuous variables) or Spearman correlation (categorical variables). P < .05 was used to define statistical significance. Statistical calculations were performed using Prism version 6.0.
Results
Clinical characteristics
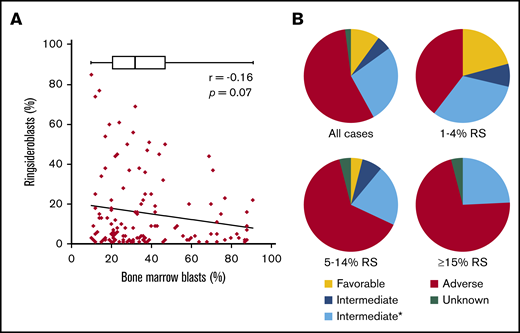
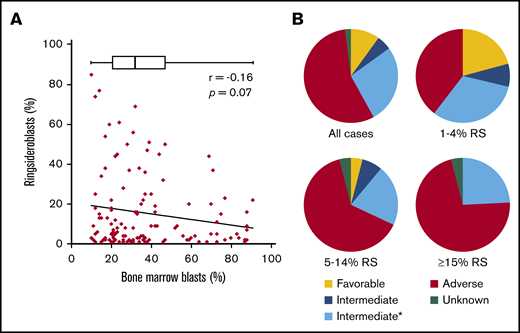
To study the RS phenotype in more detail in a comprehensive group of myeloid neoplasms (MNs), we collected clinical data on a cohort of patients (n = 126) consisting of patients with AML and high-risk MDS (≥10% BM blasts), hereafter also indicated as patients with AML. These include patients with RS (≥1%) in the diagnostic BM smear, excluding those with a documented prior clinical history of MDS-RS. The median blast percentage in this cohort was 32% (range, 10%-91%), two-thirds of the patients were male, and the median age at diagnosis was 67 years (range, 32-87 years). The majority of patients were diagnosed with de novo AML (55.6%), and AML with myelodysplasia-related changes was the most common World Health Organization (2016) subtype (37.3%; Table 1). Although highest RS percentages were observed in cases with lower blast counts, blast count did not significantly correlate with RS percentage (Pearson r = 0.16; P = .07; Figure 1A). Patients were placed into 3 subgroups on the basis of their RS percentage: 1% to 4% RS, 5% to 14% RS, and ≥15% RS (Table 1). These groups were comparable regarding erythroblast percentage and age. The group AML Patients with an RS phenotype was enriched with patients in the ELN adverse risk category (55%; Figure 1B). The proportion of adverse risk patients increased with increasing RS percentage (Table 1; Figure 1B). The subgroup with at least 15% RS, which represents the minimum required percentage for World Health Organization MDS-RS diagnosis in absence of SF3B1 mutations,2 had no patients in the ELN favorable risk category (Figure 1B).
Clinical data. (A) Correlation between blast percentage and RS percentage, both determined in diagnostic BM smear. Box plot represents median and range of blast percentage in the RS cohort. (B) Pie charts representing risk classification (ELN 2017) for total RS cohort (all cases) and 3 subgroups based on RS percentage (Table 1). *Mutational status of ASXL1, RUNX1, and TP53 unknown.
Clinical data. (A) Correlation between blast percentage and RS percentage, both determined in diagnostic BM smear. Box plot represents median and range of blast percentage in the RS cohort. (B) Pie charts representing risk classification (ELN 2017) for total RS cohort (all cases) and 3 subgroups based on RS percentage (Table 1). *Mutational status of ASXL1, RUNX1, and TP53 unknown.
Mutational and chromosomal defects observed in association with RS phenotype
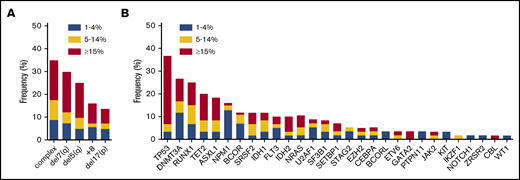
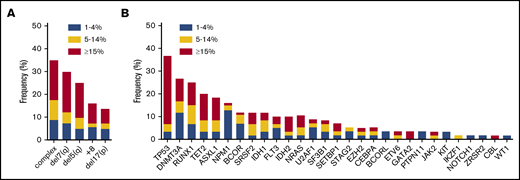
Complex cytogenetic aberrancies (defined as 3 or more chromosomal abnormalities) detected by conventional karyotyping were observed in 35% of all RS cases (n = 126; Figure 2A). Increasing incidences of chromosomal abnormalities were associated with increasing RS percentages in the 3 subgroups (21%, 39%, and 49%, respectively; data not shown). Screening for mutations in CEBPA, FLT3, and NPM1 was conducted by conventional reverse transcription polymerase chain reaction. In addition, a subset of 60 patients (de novo AML, n = 36; sAML, n = 11; t-MN, n = 6; MDS-excess blasts type 2 [< 10%], n = 7) was analyzed for mutations in a panel of genes that are recurrently mutated in MNs using next generation sequencing (NGS) methods (either panel-based [supplemental Table 1] or WES). In this subset, 27 patients had at least 15% RS, 15 patients had 5% to 14% RS, and 18 patients had 1% to 4% RS. In addition, in accordance with cytogenetic findings, mutations in the TP53 gene (37%), which frequently coincide with genetic instability, were the most recurrent in this subset (Figure 2B). Other frequently mutated genes included RUNX1 (25%), NPM1 (16%), and the epigenetic modifiers DNMT3A (26%), ASXL1 (19%), and TET2 (20%). SF3B1 mutations were detected in 6 cases: 4 with de novo AML, 1 with t-MN, and 1 with sAML. In 2 patients, no mutations in genes frequently affected in myeloid neoplasms were identified. The incidence of certain mutations tended to segregate with RS percentages: NPM1 mutations were mainly observed in cases with low RS percentages (30% in the 1%-4% RS group vs 3% in the ≥15% RS group; Figure 2B). In contrast, TP53 and GATA2 mutations were detected especially in patients with higher RS percentages (73% in the ≥15% RS group vs 12% in the 1%-4% RS group; Figure 2B).
Chromosomal and molecular defects observed in association with RS phenotype. (A) Frequency of commonly observed cytogenetic defects in MNs in the RS cohort, subdivided by RS percentage at diagnosis, n = 126. (B) Frequency of mutations in genes commonly mutated in MNs as detected by NGS, subdivided by RS percentage. ASXL1, CALR, CBL, DNMT3A, EZH2, IDH1, IDH2, JAK2, KIT, NRAS, RUNX1, SF3B1, SRSF2, TET2, TP53, and WT1, n = 60; BCOR, BCORL, ETV6, GATA2, GNAS, IKZF1, NOTCH1, PTPN11, SETBP1, STAG2, U2AF1, and ZRSR2, n = 45. For CEBPA (n = 83), FLT3 (n = 103), and NPM1 (n = 93) results of polymerase chain reaction, followed by Sanger sequencing (CEBPA) or Capillary electrophoresis (FLT3 and NPM1) are shown.
Chromosomal and molecular defects observed in association with RS phenotype. (A) Frequency of commonly observed cytogenetic defects in MNs in the RS cohort, subdivided by RS percentage at diagnosis, n = 126. (B) Frequency of mutations in genes commonly mutated in MNs as detected by NGS, subdivided by RS percentage. ASXL1, CALR, CBL, DNMT3A, EZH2, IDH1, IDH2, JAK2, KIT, NRAS, RUNX1, SF3B1, SRSF2, TET2, TP53, and WT1, n = 60; BCOR, BCORL, ETV6, GATA2, GNAS, IKZF1, NOTCH1, PTPN11, SETBP1, STAG2, U2AF1, and ZRSR2, n = 45. For CEBPA (n = 83), FLT3 (n = 103), and NPM1 (n = 93) results of polymerase chain reaction, followed by Sanger sequencing (CEBPA) or Capillary electrophoresis (FLT3 and NPM1) are shown.
Genome-wide screening for genetic defects
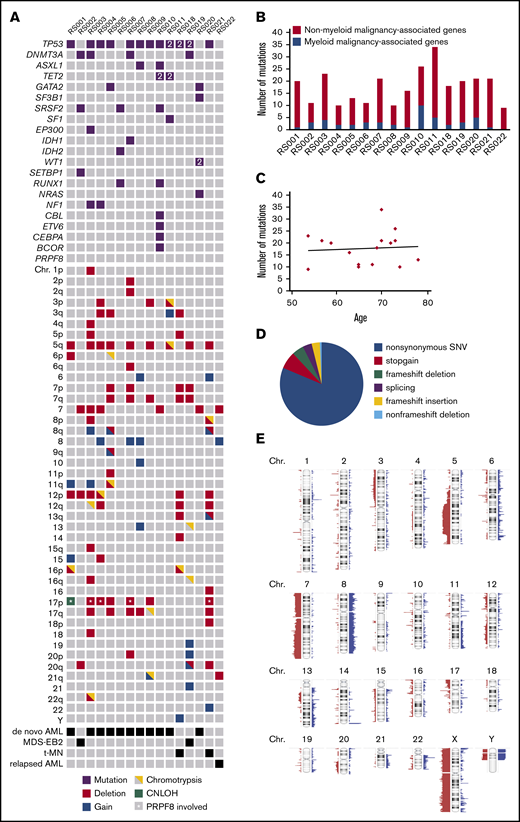
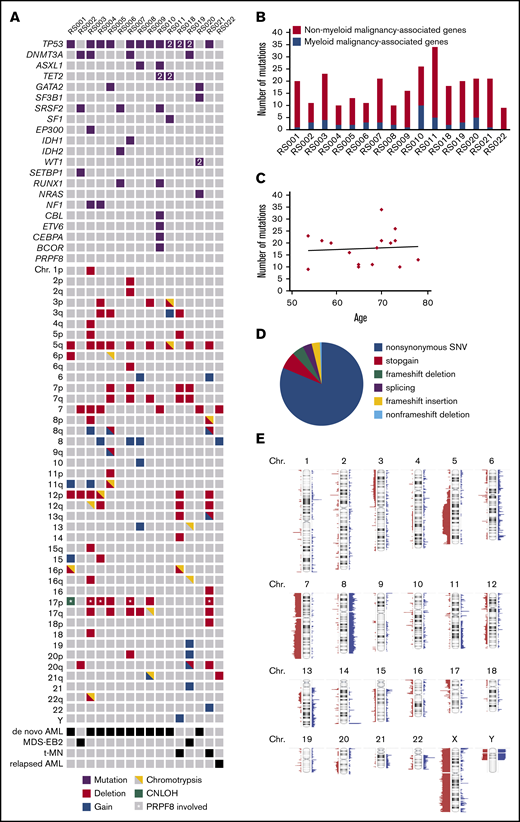
To identify genetic defects underlying the RS phenotype that are not covered by panel-based sequencing, 15 patients of the RS cohort were selected for genome-wide analysis on the basis of high RS percentage (≥13%) and material availability. This group was supplemented with 1 patient (RS022) who had 15% RS at AML relapse after autologous stem cell transplantation, whereas no RS were observed at initial AML diagnosis. All 16 patients belonged to the adverse risk group according to ELN criteria.21 Using WES, samples were first analyzed for the occurrence of germline mutations in genes associated with congenital sideroblastic anemia (supplemental Table 2). However, no such mutations were detected. On the basis of WES, a median of 19 (range, 9-34) somatically acquired mutations were found per patient, of which a median 2.5 (range, 0-10) were observed in genes recurrently mutated in myeloid malignancies19 (Figure 3A-B; supplemental Table 3). The total number of mutations did not correlate with age (Pearson r = 0.07; P = .78; Figure 3C). The vast majority of observed mutations concerned nonsynonymous point mutations (Figure 3D). TP53 was most frequently affected in this cohort (in 12/16 patients), followed by DNMT3A (4/16) and SRSF2 (3/16; Figure 3A). In this cohort, 1 mutation was detected in SF3B1 and no mutations were observed in PRPF8. For patient RS022, who had 15% RS and several cytogenetic abnormalities in the relapse sample, whereas both were absent at initial presentation, no mutations were detected in known leukemia-associated genes (Figure 3A). However, the observed mutation in BUB1, a key player in the mitotic spindle checkpoint, most likely explains the chromosomal aberrancies observed in this relapse sample (supplemental Table 3). In addition to WES, SNP array analysis was used to identify chromosomal defects (supplemental Figure 1). Scattering of 1 or more chromosomes (chromothripsis) was detected in 9/16 cases. Deletions of chromosomes 5q, (parts of) chromosome 7, chromosome 12p, chromosome 17p, and (partial) gain of chromosome 8 were frequently observed chromosomal aberrancies (Figure 3A; Figure 3E). In 6/16 cases, the 17p deletion involved the TP53 locus, and for 4/16 cases, this deletion involved the locus of PRPF8 (marked by asterisks in Figure 3A). Together, these data indicate that no single-gene defect underlies the RS phenotype in this cohort: RS in AML is associated with a variety of adverse risk genetic defects.
Genetic defects detected by WES and SNP-array analysis. (A) Overview; for each patient, all mutations in genes known to be recurrently mutated in myeloid malignancies detected by WES are depicted as well as cytogenetic abnormalities detected by SNP array analysis. 2 = 2 mutations were detected. (B) Number of acquired mutations per patient as determined by WES. In black is the number of mutations in genes that have been previously implicated in pathogenesis of myeloid malignancies; in gray is the number of mutations in genes that have not been previously implicated in myeloid malignancies. (C) Correlation between age and the number of mutations. (D) Distribution of the various types of alterations detected in the total set of patients with RS phenotype. (E) SNP array results overview; figure was created using Nexus software. Red, loss; blue, gain.
Genetic defects detected by WES and SNP-array analysis. (A) Overview; for each patient, all mutations in genes known to be recurrently mutated in myeloid malignancies detected by WES are depicted as well as cytogenetic abnormalities detected by SNP array analysis. 2 = 2 mutations were detected. (B) Number of acquired mutations per patient as determined by WES. In black is the number of mutations in genes that have been previously implicated in pathogenesis of myeloid malignancies; in gray is the number of mutations in genes that have not been previously implicated in myeloid malignancies. (C) Correlation between age and the number of mutations. (D) Distribution of the various types of alterations detected in the total set of patients with RS phenotype. (E) SNP array results overview; figure was created using Nexus software. Red, loss; blue, gain.
Erythroblasts share genetic defects with leukemic clones
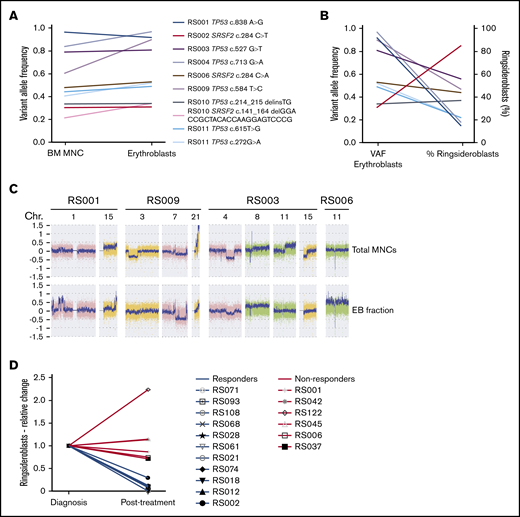
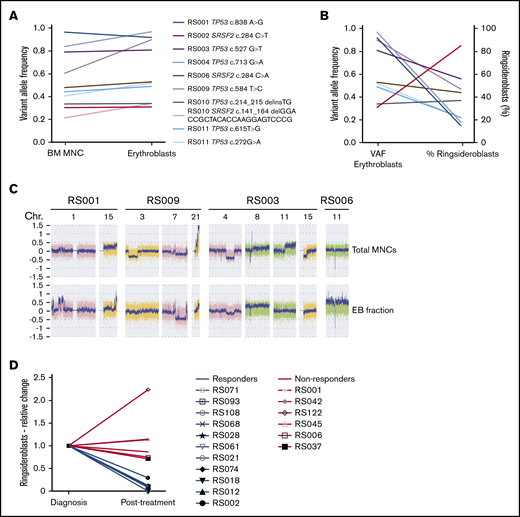
To determine whether RS are part of the malignant leukemic clone, TP53 and SRSF2 mutations detected by WES in the total MNC fraction (containing both myeloid blast cells and differentiated cells) were verified in sorted erythroblast populations (supplemental Methods; supplemental Figure 2) of 8 patients. Variant allele frequency (VAF) strongly correlated between both cell fractions (Pearson r = 0.94; P = .0002; Figure 4A). No correlation was observed between VAFs of erythroblast mutations and the percentage of RS (Pearson r = −0.43; P = .20; Figure 4B). SNP array analysis on both fractions revealed that most of the cytogenetic defects were shared by the MNC fraction and erythroblast populations. However, differences were also detected in 4/6 patients (Figure 4C). Observed differences consisted of either novel aberrancies, exemplified by the gain of chromosome 11 in the EBs of patient RS006 or discrepancies in observed frequency of cytogenetic defects, as observed for the 7q deletion in patient RS009 (0.6 in EBs vs 0.25 in total MNCs; Figure 4C). The frequency of cytogenetically aberrant clones within the erythroblast fractions did not correlate to RS percentages in these 4 patients (data not shown). No hotspot mutations in exons 13 to 16 of SF3B1 were detected in sorted EB fractions.
Genetic defects in erythroblast of patients with RS-phenotype. (A) VAFs of TP53 and SRSF2 mutations detected in MNC fractions (determined by WES) and erythroblast fraction (determined by amplicon-based sequencing). (B) Correlation between VAFs in erythroblast fractions (VAF indicated on left y-axis) and observed RS percentages (percentage indicated on right y-axis). Different colors represent individual mutations (as indicated in legend of Figure 4A). (C) Differences observed in SNP array results between MNC- and EB fractions, figure shows screenshots taken from Chromosome Analysis Suite software package (Affymetrix). (D) Relative changes in RS percentage of patients who received treatment, the RS percentage at follow-up examination (Posttreatment) are displayed relative to the RS percentages determined at diagnosis (Diagnosis). Blue lines indicate patients who responded to therapy, and red lines indicate patients who did not respond (supplemental Table 4).
Genetic defects in erythroblast of patients with RS-phenotype. (A) VAFs of TP53 and SRSF2 mutations detected in MNC fractions (determined by WES) and erythroblast fraction (determined by amplicon-based sequencing). (B) Correlation between VAFs in erythroblast fractions (VAF indicated on left y-axis) and observed RS percentages (percentage indicated on right y-axis). Different colors represent individual mutations (as indicated in legend of Figure 4A). (C) Differences observed in SNP array results between MNC- and EB fractions, figure shows screenshots taken from Chromosome Analysis Suite software package (Affymetrix). (D) Relative changes in RS percentage of patients who received treatment, the RS percentage at follow-up examination (Posttreatment) are displayed relative to the RS percentages determined at diagnosis (Diagnosis). Blue lines indicate patients who responded to therapy, and red lines indicate patients who did not respond (supplemental Table 4).
As erythroblasts of patients with RS-MN were observed as part of the malignant clone, we hypothesized that RS could be eliminated on treatment. We therefore analyzed follow-up BM smears, including RS percentage, which were available for 17 patients of the RS cohort. Eight patients received intensive chemotherapy24 (median interval between both evaluations, 2 months; range, 1-5 months), 6 were treated using hypomethylating agents25 (median interval, 4.3 months; range, 2.5-12 months), and 3 patients received a combination of both (median interval, 16 months; range, 5-20; supplemental Table 4). Of this group, 65% responded to therapy (defined as complete or partial response) and 35% did not respond (defined as no response or relapse). Patients who responded showed a marked decrease in RS percentage at follow-up evaluation, whereas the RS percentage in nonresponders was stable or increased (Figure 4D).
Upregulated genes in RS-AML are associated with megakaryocyte/erythroid differentiation and mRNA splicing
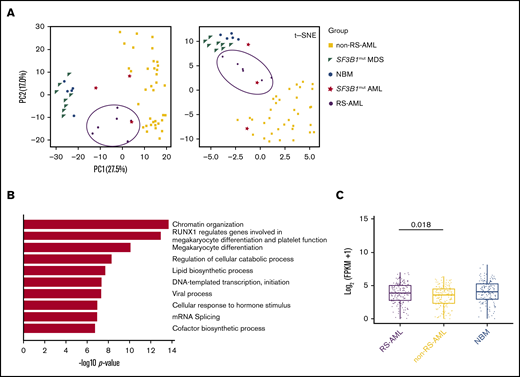
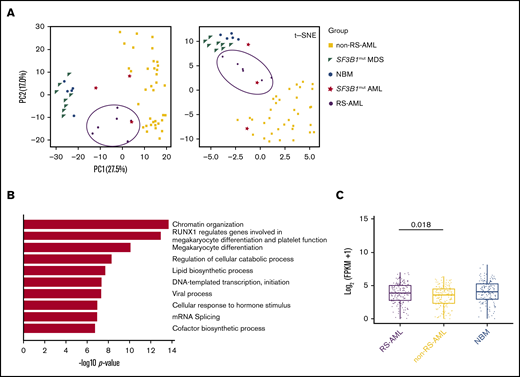
To investigate transcriptional differences that underlie the RS phenotype in AML, RNA sequencing was performed on CD34+-selected AML cells of 6 patients with at least 13% RS (supplemental Table 5). The results were compared with normal BM (NBM) CD34+ and SF3B1-mutated MDS CD34+ samples (GSE6356926 ; hereafter indicated as SF3B1mut MDS), samples from 36 patients with AML with a mixed background regarding cytogenetic and genetic defects (with no documented presence of RS) that were part of the Blueprint study27 (hereafter indicated as non-RS-AML), and 3 AML samples containing SF3B1 mutations (TCGA, Blueprint data set and 1 of our own samples [RS020]; hereafter indicated as SF3B1mut AML). First PCA and t-SNE analysis was performed, which consistently separated non-RS-AML from NBM and MDS samples (Figure 5A). RS-AML samples were located in between these populations, as well as the SF3B1mut AMLs. These findings suggest that RS-AML comprises a distinct entity that partially resembles expression patterns in SF3B1mut AML, probably reflecting involvement of overlapping pathways. By direct comparison of RS-AML to NBM CD34+, 1196 genes were identified to be upregulated in AML with RS phenotype. Functionally, this gene set was highly enriched for genes involved in epigenetic regulation, as well as protein modifications including ubiquitination (supplemental Figure 3A). Processes associated with downregulated genes (n = 1309) included cell cycle-related pathways and DNA replication (supplemental Figure 3B).
RS-AML transcription program. (A) PCA and t-SNE plots using RNA-seq results of the indicated cell types. Previously published RNA-seq was included for the following cell types: NBM (GSE63569), non-RS-AML (Blueprint study), SF3B1mut MDS (GSE63569) and SF3B1mut AML (combination of TCGA data set, Blueprint study and own data). (B) Biological process enrichment for genes upregulated (1464) in RS-AML as compared with non-RS-AML. (C) MEP signature comparison among RS-AML, non-RS-AML, and NBM.
RS-AML transcription program. (A) PCA and t-SNE plots using RNA-seq results of the indicated cell types. Previously published RNA-seq was included for the following cell types: NBM (GSE63569), non-RS-AML (Blueprint study), SF3B1mut MDS (GSE63569) and SF3B1mut AML (combination of TCGA data set, Blueprint study and own data). (B) Biological process enrichment for genes upregulated (1464) in RS-AML as compared with non-RS-AML. (C) MEP signature comparison among RS-AML, non-RS-AML, and NBM.
To investigate gene expression patterns that are correlated to RS-AML, but not to AML in general, we compared gene expression of patients with RS-AML with that of those without RS-AML. Downregulated genes in RS-AML vs non-RS-AML are involved in immune-related processes (supplemental Figure 3C). Gene ontology analysis on the upregulated genes in RS- AML revealed enrichment for genes involved in megakaryocyte differentiation and platelet function (Figure 5B; supplemental Table 6), including GATA1, GATA2, KLF1, AHSP, and TRIM58, which are genes that are also involved in the regulation of erythroid differentiation. Furthermore, this analysis determined that EPOR, the gene encoding for the erythropoietin receptor, was also upregulated in CD34+ cells of patients with RS-AML.
To determine whether the increased expression of these genes is the result of an increased amount of megakaryocyte-erythroid progenitors (MEPs) in the RS-AML, we extracted a MEP signature based on previously published gene expression patterns.28,29 As our cohort of non-RS-AMLs comprises both CD33+ and CD34+ selected samples, we first compared the MEP signature between both cell populations to exclude that marker-biased analysis determines this difference. However, this comparison did not reveal differences between both cell fractions with regard to the extent of the MEP signature (supplemental Figure 3D). Compared with the non-RS-AML cohort, RS-AML displayed a slightly increased expression of this MEP signature (Figure 5C). Altogether, these findings demonstrate that CD34+ RS-AML cells are partially distinct, reflected by elevated expression of genes associated to megakaryocyte and erythroid differentiation, including the MEP signature.
Similarities and differences with SF3B1 mutated myeloid neoplasms
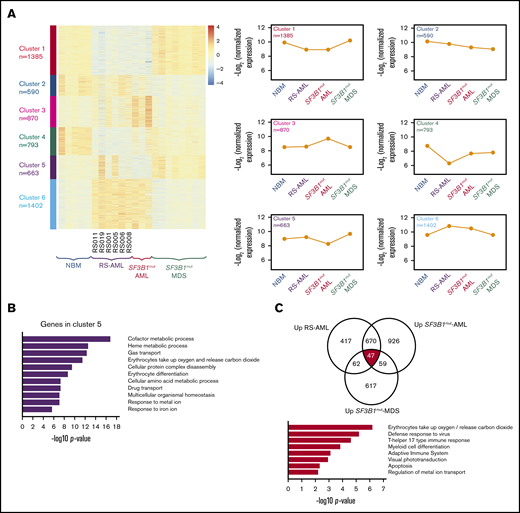
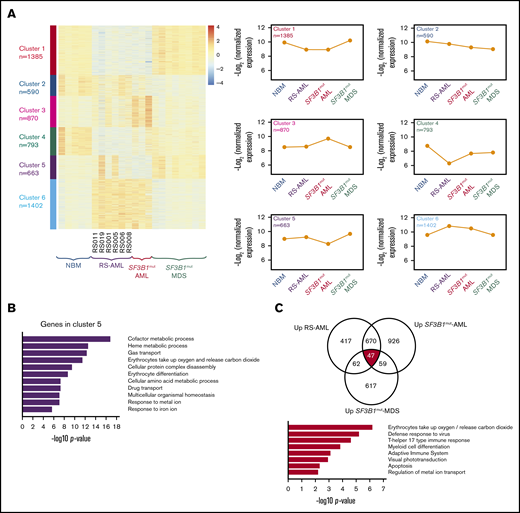
Next we studied in more detail the similarities and differences between the different MNs with RS. Therefore, we determined the most differentially expressed genes followed by clustering in RS-AML CD34+ cells (n = 6), NBM CD34+ cells (n = 5), CD34+ cells of SF3B1mut AML (n = 3), and SF3B1mut MDS (n = 8; Figure 6A). Six clusters were identified whereby clusters 1 and 6, which distinguish the RS-AML from MDS and NBM, are enriched for genes associated with cell cycle-related processes and protein modifications, respectively, highlighting the difference in proliferation and expansion between RS-AMLs and SF3B1mut MDS (supplemental Figure 4A-E). Cluster 4, which is enriched for genes involved in cellular communication and trafficking, is more specific for NBM CD34+ cells (supplemental Figure 4D). Cluster 5 represents genes that are specifically upregulated in CD34+ cells of SF3B1mut-MDS and show heterogeneous expression in RS-AML. Functionally, these genes are involved in erythroid development, including iron metabolism (Figure 6B).
Comparison between RS-AML and SF3B1mutAML and MDS. (A) Heat map of gene expression by supervised k-means clustering in RS-AML, SF3B1mut AML, and SF3B1mut MDS vs control NBM cells. The expression of the 6 clusters identified in for individual groups is shown on the right. (B) Biological process enrichment for cluster 5 as identified in panel A; for other clusters, see supplemental Figure 3. (C) Gene overlap of common upregulated genes among RS-AML, SF3B1mut AML, and SF3B1mut MDS vs control. Biological process enrichment is shown for commonly upregulated genes.
Comparison between RS-AML and SF3B1mutAML and MDS. (A) Heat map of gene expression by supervised k-means clustering in RS-AML, SF3B1mut AML, and SF3B1mut MDS vs control NBM cells. The expression of the 6 clusters identified in for individual groups is shown on the right. (B) Biological process enrichment for cluster 5 as identified in panel A; for other clusters, see supplemental Figure 3. (C) Gene overlap of common upregulated genes among RS-AML, SF3B1mut AML, and SF3B1mut MDS vs control. Biological process enrichment is shown for commonly upregulated genes.
To identify gene expression differences that are shared by RS AML, SF3B1mut AML, and SF3B1mutMDS, we compared gene expression of all gene sets to NBM and determined the overlapping genes. A total of 47 genes were consistently upregulated and 125 genes were downregulated in all 3 groups (Figure 6C; supplemental Figure 5A; supplemental Table 7). Examples of upregulated genes include ALAS2, HBB, and NFE2, all players in heme-metabolism. Functional annotation revealed erythroid-related processes as highest for this gene set (Figure 6C). This result is in line with the previously described increased expression of the erythroid gene program and increased MEP signature expression in these CD34+ cells. Commonly downregulated genes strongly enrich for immune pathways (supplemental Figure 5A). Gene expression of PRPF8, SF3B1, and ABCB7, which were previously described as being involved in RS of SF3B1mut MDS because of deregulated splicing, were not expressed at a lower level in RS-AML compared with NBM (supplemental Figure 5B). Finally, we analyzed whether genes that have been described as being differentially spliced in previous data sets of Dolatshad et al26 were differentially spliced (supplemental Figure 5C) or differentially expressed in our data set (supplemental Figure 5D). We found only limited overlap in genes that are differentially spliced or expressed in SF3B1mut MDS and our data set of RS-AML. These findings demonstrate that RS-AML shares a gene expression signature with SF3B1mut MDS, but that these AMLs also have unique characteristics that distinguish them from MDS.
Discussion
In this study, we characterized the presence of RS in a cohort of patients diagnosed with AML or high-risk MDS. We observed that RS-AML is enriched for ELN adverse risk disease, including the associated genetic and chromosomal defects. Clinically, higher RS percentage at diagnosis is accompanied with higher incidence of poor-risk disease characteristics. Unlike MDS, no single-gene defect was found that underlies the RS phenotype in AML. Gene expression analysis indicated upregulation of genes enriched for megakaryocyte and erythroid differentiation in RS-AML, as compared with a general AML cohort.
Although RS are generally regarded as a specific feature of certain MDS subtypes, the reported incidence of 25% indicates that RS is also a rather common finding in AML.18 In contrast to reports on MDS-RS subtypes, mutations in spliceosome gene SF3B1 were rarely observed in our RS-AML cohort. The paucity of this mutation in RS-AML might be explained by the low tendency toward AML transformation from MDS subtypes with SF3B1 mutations.8,13 Also, we did not identify genetic mutations in PRPF8, another gene that has been associated with an RS phenotype.20 In our cohort, 25% (4/16) of the patients had a deletion of the chromosomal locus of PRPF8, but we did not observe significantly lower gene expression of PRPF8.
Although we did not identify a single gene defect that underlies the RS phenotype in AML, panel-based sequencing and WES revealed a high incidence of adverse risk mutations in the RS-AML cohort, including DNMT3A, RUNX1, and ASXL1. Mutations in TP53 were observed most recurrently, particularly in patients with at least 15% RS at diagnosis. These results are in agreement with a previous study using a restricted gene panel to analyze the RS phenotype in patients with AML.18 The high incidence of poor-risk cytogenetic aberrancies, including chromothripsis, probably reflects the high frequency of TP53 mutations.30
In the present study, we have primarily included patients with de novo AML reflecting the lack of a clinical relevant history of antecedent MDS. However, a previous study has suggested that in particular, patients with t-AML and s-AML with TP53 mutations have transited through an unrecognized MDS prodrome based on genome ontogeny alterations in time.31 Whether similar findings apply to patients with RS-AML, whereby RS development is an early MDS event and AML development a late event, will require additional studies.
Interestingly, RS have also been reported in relation to MNs in patients with Li-Fraumeni with a congenital TP53 mutation.32 Defects in TP53 also occur frequently in acute erythroid leukemia (AEL). In addition to having a high frequency of TP53 mutations, AML with RS phenotype resembles AEL regarding higher age at diagnosis (median age, 68 years), a male predominance, and presence of complex chromosomal aberrancies.33 However, unlike AEL, erythroid differentiation in RS-AML does not stop at the proerythroblastic stage. Instead, accumulation of immature myeloid blast cells is commonly observed in RS-AML, whereas this is rare in AEL.33
The presence of RS in our AML cohort is not restricted to a specific ontogenic subtype,34 indicating that RS in AML arise from a common mechanism that goes beyond disease ontogeny. Also, it has been reported that the presence of RS on its own is not predictive for OS in patients with AML,18 suggesting that RS-AML is not a distinct disease entity. However, we observed several differences in megakaryocytic and erythroid differentiation gene expression that are specific for RS-AML compared with non-RS-AML, suggesting a role for the MEP cell.35 The transcription factors GATA1 and GATA2 are involved in erythroid lineage restriction, partly via stimulation of erythropoietin receptor expression,36 which we also observed as being upregulated in RS-AML, whereas both become downregulated during myeloid differentiation.37 These results suggest that the erythroid differentiation program is largely functional, despite the presence of a block in the myeloid differentiation program. These findings were present despite the fact that the majority of cytogenetic and molecular defects were shared by MNC and erythroblast populations, although our SNP array results suggests that cytogenetic evolution can take place.
In MDS, SF3B1 mutations presumably result in RS formation by interfering with mRNA splicing, resulting in differential gene expression.8,26 Although RS-AML is genetically distinct from RS-MDS, downstream mechanisms that result in aberrant erythroid differentiation may be similar. However, when comparing differentially spliced genes observed in SF3B1mut MDS samples26 and our RS-AML samples, we observed only limited overlap.
In conclusion, we have shown that RS are a frequent finding in AML, particularly in relation to adverse risk genetic defects. We revealed that erythroblasts share the mutations that are found in the malignant myeloid blast cells in RS-AML, and thus are part of the malignant population. Although the genetic background of RS-AML differs from that of RS-MDS, downstream effector pathways may be comparable, providing a possible explanation for presence of RS in AML.
Acknowledgments
The authors thank K. Chiba and S. Miyano from the Laboratory of DNA information Analysis at the University of Tokyo for their technical support.
S.O. was supported by the following grants: Grant-in-Aid for Scientific Research on Innovative Areas from the Ministry of Health, Labor and Welfare of Japan (15H05909); Grant for Project for Development of Innovative Research on Cancer Therapeutics from the Japan Agency for Medical Research and Development, AMED (JP18ck0106250h0002); and grant for project for cancer research and therapeutics evolution (P-CREATE) from AMED (JP18cm0106501h0003).
Authorship
Contribution: G.B., M.G., G.Y., H.S., G.H., A.B.M., S.O., J.H.A.M., J.H.J., and E.V conceived and planned the experiments; G.B., M.G., G.Y., T.N.K.-S., L.I.K., M.S.-K., K.Y., Y.S., and E.v.d.B. carried out the experiments; G.B., M.G., G.Y., H.S., G.H., A.B.M., S.O., J.H.A.M., J.H.J., and E.V. contributed to the interpretation of the results; G.B. took the lead in writing the manuscript; and all authors provided critical feedback and helped shape the research, analysis, and manuscript.
Conflict-of-interest disclosure: The authors declare no competing financial interests.
Correspondence: Edo Vellenga, Department of Hematology, University Medical Center Groningen, Hanzeplein 1, DA13, 9713GZ Groningen, The Netherlands; e-mail: e.vellenga@umcg.nl.
References
Author notes
Raw RNA-seq data are available via GSE127861.
The full-text version of this article contains a data supplement.

