Key Points
Approximately 10% of neutrophils in healthy human and mouse circulation are primed for early recruitment to sites of acute inflammation.
Massive induction of neutrophil priming in BM and blood occurs as inflammation progresses or in response to G-CSF and GM-CSF.

Abstract
Polymorphonuclear neutrophils (PMNs) are the most abundant circulating leukocytes, and the first cells recruited to sites of tissue inflammation. Using a fixation method to preserve native CD marker expression prior to immunophenotyping, we identified a distinct population of “primed for recruitment” PMNs in healthy mouse and human blood that has high expression of adhesion and activation markers compared with the bulk resting-state PMNs. In response to acute tissue inflammation, primed PMNs (pPMNs) were rapidly depleted from the circulation and recruited to the tissue. One hour after acute peritoneal insult, pPMNs became the dominant PMN population in bone marrow (BM) and blood, returning to baseline levels with resolution of inflammation. PMN priming was induced by the granulopoietic factors granulocyte-macrophage–colony-stimulating factor (GM-CSF) and granulocyte–colony-stimulating factor (G-CSF). High levels of pPMNs were observed in neutropenic mice and in pediatric neutropenic patients who were resistant to infection, highlighting an important role of this population in innate immune function.
Introduction
Polymorphonuclear neutrophils (PMNs), critical cellular components of host immune defense, are actively recruited in response to tissue damage or infection1,2 and are constitutively recruited to healthy and inflamed biofilm-associated mucosal surfaces.3-6 PMNs were regarded as a homogenous and terminally differentiated cell type, however, emerging evidence suggests significant phenotypic heterogeneity of circulating and tissue PMNs in a number of disease states.3,7-22 CD markers are commonly used to monitor PMN activation states, with tissue PMNs exhibiting altered expression of CD markers of activation compared with blood PMNs.3,7,8,23 Furthermore, tissue PMN CD marker expression differs depending on the specific inflammatory context, with graded expression of activation markers corresponding to functionality.3,8 In this study, our goal was to determine in vivo priming/activation states using CD marker expression levels, while avoiding a potential artifact induced by conventional isolation procedures.24-27 We optimized a flow cytometry protocol based on previously established approaches25,26 that captures PMN CD marker expression in its in vivo state.
Because PMNs are numerous in the circulation and have the potential to cause significant tissue damage,28,29 constraining PMN activation and recruitment to relevant inflammatory sites is critical. Current dogma is that PMN recruitment into tissues is determined by the state of activation of the endothelium, which can induce subsecond activation of PMN integrins under shear flow of blood.30-34 However, PMN priming in the circulation has also been described, which can increase the ability of these cells to respond to stimuli at the endothelial surface.35 Strong evidence suggests that upregulated surface expression of PMN adhesion receptors can increase the ability of PMN recruitment to the endothelial surface and subsequent diapedesis. Upregulated surface expression of the αM-integrin, CD11b, was observed on circulating PMNs in a human model of endotoxemia.36 Furthermore, aging PMNs in the circulation have upregulated expression of CD11b, and show increased proinflammatory characteristics including tissue recruitment.37,38 In vitro, surface expression of PMN adhesion receptors increases in response to a wide range of agonists,39-44 and increased surface expression of CD11b/CD18 (Mac-1) promotes PMN aggregation in suspension,45 adhesion to endothelial cells,24 and adherence-dependent locomotion.46 Furthermore, stimuli that induce upregulation of surface adhesion receptors also induce PMN adhesion and chemotaxis.47 Here, we demonstrate that a small steady-state population (∼10%) of PMNs in mouse and human circulation has upregulated surface expression of specific adhesion receptors and is primed for early recruitment to acute tissue inflammation. Furthermore, we demonstrate a profound systemic priming of PMNs in the bone marrow (BM) and circulation, based on upregulation of the same CD markers of adhesion, in response to acute peritoneal infection. PMN priming was also induced by the granulopoietic factors granulocyte–colony-stimulating factor (G-CSF) and granulocyte-macrophage–colony-stimulating factor (GM-CSF). Finally, primed PMNs (pPMNs) represent the predominant PMN activation subset in severely neutropenic children, suggesting that increased PMN priming may compensate for low PMN counts.
Methods
Human subjects
Blood and oral rinse samples were obtained from healthy volunteers and processed as previously described.3 Volunteers for the experimental gingivitis study were actively recruited at the University of Toronto. Volunteers (18-30 years of age) with no active or previous history of periodontal disease or systemic health issues were enrolled in the study. The gingivitis study was approved by the University of Toronto’s Research Ethics Board (protocol #32899). Pediatric neutropenic patients (2-18 years of age) were recruited from the Division of Haematology/Oncology (The Hospital for Sick Children, Toronto, ON, Canada). Age-matched controls with no history of infection or other comorbidities were recruited while presenting for routine elective orthopedic surgery at the same institution. This study was approved by the research ethics boards of The Hospital for Sick Children (protocol #1000052517) and the University of Toronto (protocol #33269). Human studies complied with the tenets of the Declaration of Helsinki, and signed informed consent was obtained from all donors prior to inclusion.
Mouse studies
Mouse studies complied with all relevant ethical regulations and were approved by the University of Toronto Animal Care Committee and the research ethics board (protocol #20010664). Mice were C57BL/6. Peritonitis was induced by injection with 100 µL of pHrodo Red Escherichia coli BioParticles (Molecular Probes) as previously described.48 For PMN depletion assays, mice received a peritoneal injection of anti-Ly6G (200 µg per mouse, clone 1A8; Bio X Cell). Blood was acquired by cardiac puncture with EDTA (50 mM) as anticoagulant. BM was flushed from the femurs and tibias of 8- to 16-week-old mice with cold phosphate-buffered saline (PBS). Cells were retrieved from the peritoneal cavity by lavage with 3 mL of cold PBS. Luminal colonic PMNs were obtained by immersing the excised and dissected colon in cold PBS (3 mL), followed by filtration through a 40-µm mesh filter. All mice were euthanized by CO2 inhalation.
Antibodies
The following anti-human antibodies were used: CD66a (CD66a-B1.1; Invitrogen), CD11b (ICRF44; BioLegend), CD63 (H5C6; BioLegend), CD16 (3G8; BioLegend), CD18 (6.7; BD Biosciences), CD170 (194128; R&D Systems), CD2 (RPA-2.10; BioLegend), CD3 (HIT3a; BioLegend), CD9 (HI9a; BioLegend), CD19 (HIB19; BioLegend), CD36 (5-271; BioLegend), and CD56 (HCD56; BioLegend). The following anti-mouse antibodies were used (see supplemental Table 1): Ly6G (1A8), F4/80 (BM8), CD11b (M1/70), CD66a (CC1), and CD63 (MVG-2). α-Citrullinated histone 3 (α-H3Cit) (polyclonal; Abcam), elastase (polyclonal; Abcam), myeloperoxidase (MPO) (2C7; OriGene), and goat anti-rabbit immunoglobulin G H&L, AF488 (Abcam) were also used. Western blot antibodies used were as follows: anti-MPO (E1E7I, 1:1000; Cell Signaling Technology), anti-matrix metalloproteinase 8 (MMP8) (EP1252Y, 1:1000; Abcam), anti-MMP9 (polyclonal, 1:1000; Abcam), and anti-actin (AC-15, 1:8000; Sigma-Aldrich).
Flow cytometry
Sample fixation, labeling, and flow cytometric analysis of human and mouse samples were performed as previously described.3 Briefly, whole blood or tissue lavage fluid were fixed with fresh, methanol-free, formaldehyde (1.6% final concentration) for 15 minutes on ice prior to processing. Red blood cells (RBCs) were lysed by repeated treatment with Pharm Lyse (BD Biosciences) for 5 minutes on ice. Cells were resuspended in flow-assisted cell sorting (FACS) buffer (Hanks −/−, 1% bovine serum albumin, 2 mM EDTA), and one-half of a million cells were blocked with mouse immunoglobulin G (2 µg; Sigma-Aldrich) and rat serum (60-80 µg; Sigma-Aldrich) for 20 minutes, labeled with antibody cocktail for 30 minutes on ice in the dark, and washed 3 times with FACS buffer. For detection of markers of NETosis, cells were labeled sequentially with primary (α-H3Cit or elastase) and secondary (goat α-rabbit-AF488) antibodies, and then labeled with an antibody cocktail containing MPO-phycoerythrin and washed as described in the previous sentence.
In a number of experiments, including phagocytosis, reactive oxygen species (ROS) assays, SYTOX labeling, in vitro stimulation, and live/dead staining, whole blood was treated and or labeled prior to fixation. Whole blood was labeled with the fixable viability dye eFluor506 (Thermo Fisher Scientific) or SYTOX Green (100 nM) for 15 minutes on ice, washed once with PBS−/−, fixed, and processed as described in the previous paragraph. Although incubations at 37°C were sufficient to alter basal CD marker expression levels, it was still possible to gate on resting-state PMN (rsPMN) and pPMN populations, as long as relatively short (30-minute) incubations were used.
Sample acquisition was performed using an LSR Fortessa or X-20 (BD Biosciences) flow cytometer. Flow cytometer channel voltages were calibrated manually using rainbow beads and compensation was performed with single-stained OneComp eBeads (eBioscience). At least 2 × 10⁵ gated events were acquired per sample. Data were analyzed using FlowJo software (version 10; TreeStar). Human multicolor flow cytometry panels and gating were as previously described.3 Mouse samples were analyzed with a custom multicolor flow cytometry panel (supplemental Table 1). Mouse PMNs were gated as Ly6G+F4/80− (supplemental Figure 1D). Appropriate isotype control antibodies were used to generate fluorescence minus one (FMO) samples to establish negative staining for each antibody.
PMN incubation with SYTOX-labeled NETotic DNA
Mouse BM PMNs were stimulated with phorbol 12-myristate 13-acetate (PMA; 100 nM) for 3 hours. NETotic DNA was isolated by ethanol precipitation. DNA was labeled with SYTOX Green (50 nM) for 15 minutes on ice and isolated again by ethanol precipitation. One million BM PMNs were then incubated with SYTOX-labeled NETotic DNA (200 ng) for 10 minutes at 37°C. Samples were fixed and analyzed by flow cytometry as described in “Flow cytometry.”
Flow-assisted cell sorting
Human and mouse blood was processed and labeled as described in “Flow cytometry.” For human PMNs, sorting was done using CD16, CD63, and CD66a, as indicated in supplemental Figure 1A. For mouse PMNs, sorting was done using Ly6G, F4/80, CD66a, and CD11b, as indicated in supplemental Figure 1C. PMNs were sorted under medium pressure into rsPMN and pPMN populations using a FACSAria IIu cell sorter (BD Biosciences).
Cytospins and microscopic imaging
Sorted cells (1 × 10⁵) were processed in the Cytospin 4 centrifuge (Thermo Shandon) and labeled by DiffQuik staining. Brightfield images were acquired using a Nikon E1000 microscope with a 100×/1.3 oil-immersion Plan Fluor objective (Nikon). Confocal images were acquired using a Zeiss Axio Observer Z1 microscope with a Plan-Apochromat 63×/1.4 oil-immersion objective. Image J software (version 1.44; National Institutes of Health) was used for image analysis.
Phagocytosis and ROS assays
In vitro phagocytosis assays were performed as previously described.48 Briefly, 10 µL of pHrodo Red E coli bioparticles (ThermoFisher Scientific) were added to 100 µL of human blood and incubated for the indicated times at 37°C. The blood was fixed with formaldehyde, processed, and analyzed by flow cytometry as described in “Flow cytometry.” For ROS assays, 100 µL of human blood was incubated with 1 µL of CellRox Green (1/5 diluted; Thermo Fisher Scientific) in the presence or absence of tumor necrosis factor α (TNF-α) (75 pM final concentration; PeproTech) or N-Formyl-Met-Leu-Phe (fMLF) (10 pM final concentration; Sigma-Aldrich) for 30 minutes at 37°C. The blood was fixed with formaldehyde, processed, and analyzed by flow cytometry as described in “Flow cytometry.”
PMN enrichment
Human PMNs were enriched by density centrifugation using 1-step Polymorphs solution (Accurate Chemical & Scientific Corporation) according to the manufacturer’s instructions. High-density and low-density bands were recovered, washed once with PBS, and fixed with formaldehyde prior to processing for flow cytometry. Flow cytometry confirmed at least 85% purity of PMN preparations. Magnetic bead–negative selection was performed using the EasySep Direct Human PMN Isolation kit (Stemcell Technologies) according to the manufacturer’s instructions, except that all steps were performed at 4°C. After negative selection, bead-positive and bead-negative fractions were fixed with formaldehyde prior to processing for flow cytometry.
Cytokine array
Cytokine analysis was performed using a Mouse Cytokine Antibody Array Membrane (Abcam) according to the manufacturer’s instructions. Mouse serum (200 µL) was diluted fivefold with blocking buffer and incubated overnight for hybridization.
Cytokine/chemokine stimulation
For human studies, fresh blood was treated with fMLF (100 nM; Sigma-Aldrich), PMA (200 nM), or vehicle control for 30 minutes at 37°C in sterile FACS tubes, and analyzed by flow cytometry or western blot. For mice, BM was flushed with 3 mL of PBS per femur and 1 × 10⁶ leukocytes were treated with GM-CSF (5 ng; PeproTech), G-CSF (5 ng; PeproTech), PMA (200 nM; Sigma-Aldrich), monocyte chemoattractant protein 1 (MCP-1) (20 ng; PeproTech), RANTES (20 ng; PeproTech), interleukin 6 (IL-6) (20 ng; PeproTech), lipopolysaccharide (LPS) (20 ng; Invivogen), or pHrodo (20 µL; Invitrogen) for 30 minutes at 37°C in sterile FACS tubes. Cells were fixed by the addition of formaldehyde (1.6% final concentration) and incubated on ice for 15 minutes. Flow cytometry was performed as described in “Flow cytometry.” For in vivo stimulation, GM-CSF (0.1 µg) and G-CSF (0.2 µg) were introduced via tail-vein injection. After 1 hour, blood and BM were harvested and processed as described in “Flow cytometry.”
Human studies
Blood was drawn prior to and 15 minutes after periodontal probing. Experimental gingivitis protocols were based on Loe et al.49 Briefly, subjects were asked to abstain from all oral hygiene practices for a period of 21 days. This induction period was followed by a resolution phase initiated by the resumption of oral hygiene routines for 14 days. Clinical parameters and flow cytometry of blood PMNs were assessed weekly. Gingival index (GI) was assessed according to Loe and Silness.50 Briefly, GI values were calculated using the following surfaces of teeth: 1.2, 1.6, 2.4, 3.2, 3.6, and 4.4 (mesiobuccal/labial, mesial, distobuccal/labial, mesiolingual/palatal, lingual/palatal, and distolingual/palatal). Surfaces were scored as follows: 0 = normal gingiva, no inflammation, discoloration or bleeding; 1 = mild inflammation, slight color change, mild alteration of gingival surface, no bleeding on probing; 2 = moderate inflammation, erythema and swelling, bleeding on probing; 3 = severe inflammation, erythema and swelling, tendency to spontaneous bleeding. The GI was calculated by dividing the total score by the total number of scored tooth surfaces.
Statistical analysis
All P values were determined by 1-way analysis of variance (ANOVA) with a post hoc Fisher's least significant difference (LSD) test for multiple comparisons or 2-way Student t test unless otherwise indicated. P ≤ .05 was considered statistically significant. Statistical analysis was performed using GraphPad Prism software (version 7.00).
Results
A subpopulation of human blood PMNs expresses elevated levels of adhesion/activation-associated CD markers
To accurately identify and immunophenotype novel circulating PMN activation states in health, we applied a previously optimized multicolor flow cytometry approach3 for analysis of whole-blood leukocytes from healthy human volunteers. After gating on PMNs (supplemental Figure 1A), we observed 2 distinct PMN subpopulations based on differential expression of several priming-associated CD markers including CD63, CD66a, and CD11b (Figure 1A). The majority of PMNs in the circulation expressed low levels of these 3 markers and were therefore designated as rsPMNs, whereas 11.7% ± 9.4% of total PMNs in blood of healthy volunteers (n = 64) had much higher surface expression of these markers (Figure 1A-B), similar to that of mucosal PMNs isolated from the oral cavity. We hypothesized that highly elevated expression of surface adhesion receptors on this small subset of circulating PMNs could prime them for adhesion to inflamed endothelium and subsequent tissue recruitment, and we therefore designated them as pPMNs. The spectral properties of pPMNs indicated a shift toward lower forward scatter (FSC-A) and side scatter (SSC-A) relative to rsPMNs (Figure 1C), which is typical for activated tissue PMNs.3 pPMNs had the same surface expression levels as rsPMNs for several known PMN markers (supplemental Figure 1B) and did not express CD markers of other, non-PMN, circulating leukocyte subsets (supplemental Figure 1C). To assess the morphology of the 2 PMN populations, we performed cytological staining and imaging of sorted cells. We found that pPMNs have the multilobular nuclear morphology typical of PMNs, and image analysis showed that pPMNs have a slightly larger mean nuclear area compared with rsPMNs (Figure 1D).
![Figure 1. Identification of a novel PMN activation subset in healthy blood that has similar CD marker expression as tissue PMNs. (A) Representative histograms of CD63, CD66a, and CD11b expression are shown for human blood PMNs (CD16high/side scatter area [SSC-A]high) of healthy volunteers, compared with tissue (oral) PMNs. pPMNs (∼10% of total circulating PMNs) can be distinguished from conventional rsPMNs based on elevated tissue-level CD marker expression. FMO controls are shown. (B) A scatter dot plot shows the mean ± standard deviation (SD) pPMN percentages of total gated PMNs in blood of healthy volunteers (n = 64). (C) Representative CD66a × CD63 scatterplots of human blood and tissue (oral) PMNs and representative forward scatter area (FSC-A) × SSC-A profiles of rsPMNs, pPMNs, and tissue (oral) PMNs are shown. (D) Representative images of DiffQuik-stained, FACS-sorted human rsPMNs and pPMNs are shown. Scale bar, 10 µm. Images were acquired using a Nikon E1000 microscope with a 100×/1.3 oil-immersion Plan Fluor objective. Image analysis was performed using Image J software (National Institutes of Health) to determine nuclear area of rsPMN and pPMN PMNs from 4 independent sorts. More than 300 cells were measured for each population. Mean values ± SD are shown. (E) Mouse BM, blood, and tissue (colon) PMN expression of CD66a, CD11b, and CD63 are shown. Colon cells were pooled from 3 mice. PMNs were gated based on Ly6Ghi and F4/80low (supplemental Figure 1D). FMO controls are shown. (F) Representative CD66a × CD11b and FSC-A × SSC-A dot plots are shown for gated mouse BM, blood, and tissue (colon) PMNs. (G) DiffQuik staining of FACS-sorted mouse rsPMNs and pPMNs was performed. Image analysis was performed as described in panel D from 2 independent sorts. Approximately 85 cells were measured for each population. Mean values ± SD are shown. P values were determined by 2-tailed paired Student t test. ****P < .0001. Representative confocal images of CD66a (H) and CD11b (I) labeled mouse blood leukocytes are shown. Nuclear staining (4′,6-diamidino-2-phenylindole [DAPI]) and merged images are also shown. PMNs were identified based on nuclear morphology. Images were acquired using a Zeiss Axio Observer Z1 microscope with a Plan-Apochromat 63×/1.4 oil-immersion objective. Scale bar, 10 µm.](https://ash.silverchair-cdn.com/ash/content_public/journal/bloodadvances/3/10/10.1182_bloodadvances.2018030585/2/m_advances030585f1.png?Expires=1768099518&Signature=RmNQMcuxw~x~FprcAb9qkdpRIyl4rlGe21AgROSL8kQPPkGLE21VURzikjnZ78jc162V4F3BS~4r3V97TgQVlKnbk8OAygeIaCpyP8M7uBrfd2hzpSpqTveItEZQTsfQJp1Qq3Zwd-70vh~jxXIIuWoCXpAzlXOWqm7Ny0a9D8JNsQQRQ3U~Kgbph4eMgsm5v8nfLZKSIEVvNW28yWooMvk5mdonSQYD6Nm5iXebhlQ4gCXUOndPhPIyg8RfLbe~nJn9kVAyRrcUQc1PYWC3qehRS6mIeapDxN-kIfP739Wb9~UxrmKa1b~WnkNqJ4paqEb3Rdlf~jK3ELLD0fgHXw__&Key-Pair-Id=APKAIE5G5CRDK6RD3PGA)
Identification of a novel PMN activation subset in healthy blood that has similar CD marker expression as tissue PMNs. (A) Representative histograms of CD63, CD66a, and CD11b expression are shown for human blood PMNs (CD16high/side scatter area [SSC-A]high) of healthy volunteers, compared with tissue (oral) PMNs. pPMNs (∼10% of total circulating PMNs) can be distinguished from conventional rsPMNs based on elevated tissue-level CD marker expression. FMO controls are shown. (B) A scatter dot plot shows the mean ± standard deviation (SD) pPMN percentages of total gated PMNs in blood of healthy volunteers (n = 64). (C) Representative CD66a × CD63 scatterplots of human blood and tissue (oral) PMNs and representative forward scatter area (FSC-A) × SSC-A profiles of rsPMNs, pPMNs, and tissue (oral) PMNs are shown. (D) Representative images of DiffQuik-stained, FACS-sorted human rsPMNs and pPMNs are shown. Scale bar, 10 µm. Images were acquired using a Nikon E1000 microscope with a 100×/1.3 oil-immersion Plan Fluor objective. Image analysis was performed using Image J software (National Institutes of Health) to determine nuclear area of rsPMN and pPMN PMNs from 4 independent sorts. More than 300 cells were measured for each population. Mean values ± SD are shown. (E) Mouse BM, blood, and tissue (colon) PMN expression of CD66a, CD11b, and CD63 are shown. Colon cells were pooled from 3 mice. PMNs were gated based on Ly6Ghi and F4/80low (supplemental Figure 1D). FMO controls are shown. (F) Representative CD66a × CD11b and FSC-A × SSC-A dot plots are shown for gated mouse BM, blood, and tissue (colon) PMNs. (G) DiffQuik staining of FACS-sorted mouse rsPMNs and pPMNs was performed. Image analysis was performed as described in panel D from 2 independent sorts. Approximately 85 cells were measured for each population. Mean values ± SD are shown. P values were determined by 2-tailed paired Student t test. ****P < .0001. Representative confocal images of CD66a (H) and CD11b (I) labeled mouse blood leukocytes are shown. Nuclear staining (4′,6-diamidino-2-phenylindole [DAPI]) and merged images are also shown. PMNs were identified based on nuclear morphology. Images were acquired using a Zeiss Axio Observer Z1 microscope with a Plan-Apochromat 63×/1.4 oil-immersion objective. Scale bar, 10 µm.
Identification of a novel PMN activation subset in healthy blood that has similar CD marker expression as tissue PMNs. (A) Representative histograms of CD63, CD66a, and CD11b expression are shown for human blood PMNs (CD16high/side scatter area [SSC-A]high) of healthy volunteers, compared with tissue (oral) PMNs. pPMNs (∼10% of total circulating PMNs) can be distinguished from conventional rsPMNs based on elevated tissue-level CD marker expression. FMO controls are shown. (B) A scatter dot plot shows the mean ± standard deviation (SD) pPMN percentages of total gated PMNs in blood of healthy volunteers (n = 64). (C) Representative CD66a × CD63 scatterplots of human blood and tissue (oral) PMNs and representative forward scatter area (FSC-A) × SSC-A profiles of rsPMNs, pPMNs, and tissue (oral) PMNs are shown. (D) Representative images of DiffQuik-stained, FACS-sorted human rsPMNs and pPMNs are shown. Scale bar, 10 µm. Images were acquired using a Nikon E1000 microscope with a 100×/1.3 oil-immersion Plan Fluor objective. Image analysis was performed using Image J software (National Institutes of Health) to determine nuclear area of rsPMN and pPMN PMNs from 4 independent sorts. More than 300 cells were measured for each population. Mean values ± SD are shown. (E) Mouse BM, blood, and tissue (colon) PMN expression of CD66a, CD11b, and CD63 are shown. Colon cells were pooled from 3 mice. PMNs were gated based on Ly6Ghi and F4/80low (supplemental Figure 1D). FMO controls are shown. (F) Representative CD66a × CD11b and FSC-A × SSC-A dot plots are shown for gated mouse BM, blood, and tissue (colon) PMNs. (G) DiffQuik staining of FACS-sorted mouse rsPMNs and pPMNs was performed. Image analysis was performed as described in panel D from 2 independent sorts. Approximately 85 cells were measured for each population. Mean values ± SD are shown. P values were determined by 2-tailed paired Student t test. ****P < .0001. Representative confocal images of CD66a (H) and CD11b (I) labeled mouse blood leukocytes are shown. Nuclear staining (4′,6-diamidino-2-phenylindole [DAPI]) and merged images are also shown. PMNs were identified based on nuclear morphology. Images were acquired using a Zeiss Axio Observer Z1 microscope with a Plan-Apochromat 63×/1.4 oil-immersion objective. Scale bar, 10 µm.
pPMNs occur in mouse
To determine whether the primed PMN population in circulation is conserved across species, we developed a multicolor flow cytometry panel (supplemental Table 1) to assess expression of mouse CD markers on circulating PMNs in this species. Mouse PMNs were gated as Ly6G+ and F4/80− (supplemental Figure 1D). Similar to humans, ∼13% of mouse blood PMNs had upregulated expression of the same adhesion and activation CD markers identified on human pPMNs, including CD66a, CD11b, and CD63 (Figure 1E-F). Similar to humans, CD marker expression levels on pPMNs were at the levels of expression of these markers on mucosal tissue PMNs isolated from mouse colon. Based on the optimal resolution of the pPMN population, we used CD66ahigh × CD11b+ to gate for pPMNs in mouse. Using this gating strategy, we found that pPMNs made up ∼3% of total PMNs in BM. Similar to human pPMNs, morphological analysis of sorted cells demonstrated that murine pPMNs possess a larger mean nuclear area compared with rsPMNs (Figure 1G). Confocal imaging confirmed surface staining of CD66a and CD11b on mouse PMNs (Figure 1H-I).
pPMNs function normally and are not dead
PMNs are relatively short lived,51 and aging37 or dying PMNs52 have been reported in the circulation. We therefore sought to confirm that the pPMNs are viable and maintain normal PMN functions. Because fixation kills the cells, we labeled fresh whole blood with the fixable viability stain, eFluor506, and washed the cells prior to application of our fixation and flow-cytometry protocol. We found that, although heat-killed PMNs were positive for the dead cell marker, pPMNs were not labeled by eFluor506 in human (Figure 2A) or mice (Figure 2B). To further confirm the viability/functionality of pPMNs, we performed in vitro phagocytosis and ROS generating assays using whole blood.48 For phagocytosis, whole blood was incubated with E coli–pHrodo bioparticle conjugates, which fluoresce after uptake in the phagosome. For ROS assays, whole blood was labeled with CellRox reagent in the presence or absence of TNF-α or fMLF. Samples were fixed at end point and then processed for flow cytometry. Our results show that pPMNs and rsPMNs possess similar phagocytic (Figure 2C-E) and ROS-generating capacity (Figure 2F-G), confirming that pPMNs are viable and have similar functional responsiveness compared with rsPMNs.

pPMNs are alive. (A) Human blood was labeled with eFluor506 prior to fixation and samples were otherwise processed and analyzed by multicolor flow cytometry as described throughout the study. Expression of the viability marker was assessed on gated rsPMN (red, CD66alow/CD63low) and pPMN (black, CD66ahi/CD63hi) populations. FMO control and heat-killed cells are shown. (B) Fresh mouse blood was incubated with eFlour506 fixable viability dye. Blood was washed prior to fixation and further labeling, and analyzed by multicolor flow cytometry. FMO and heat-killed (5 minutes at 64°C) controls are shown. (C) pHrodo E coli BioParticles were incubated with human blood at 37°C, fixed, and analyzed by flow cytometry. rsPMNs (red) and pPMNs (black) had similar percentages of pHrodo+ cells (D) and geometric mean fluorescent intensity (gMFI) (E) at each time point. Paired comparisons were performed at each time point by 2-way ANOVA with a post hoc Bonferroni correction. (F) CellRox reagent was incubated with human blood at 37°C in the presence or absence (Cnt) of TNF-α or fMLF, fixed and analyzed by flow cytometry. rsPMNs (red) and pPMNs (black) had similar increases of the percentage of CellRox+ cells in response to stimulation (G). Two-way ANOVA was performed with a post hoc Bonferroni correction. rsPMN and pPMN values were compared under each condition. ns, not significant.
pPMNs are alive. (A) Human blood was labeled with eFluor506 prior to fixation and samples were otherwise processed and analyzed by multicolor flow cytometry as described throughout the study. Expression of the viability marker was assessed on gated rsPMN (red, CD66alow/CD63low) and pPMN (black, CD66ahi/CD63hi) populations. FMO control and heat-killed cells are shown. (B) Fresh mouse blood was incubated with eFlour506 fixable viability dye. Blood was washed prior to fixation and further labeling, and analyzed by multicolor flow cytometry. FMO and heat-killed (5 minutes at 64°C) controls are shown. (C) pHrodo E coli BioParticles were incubated with human blood at 37°C, fixed, and analyzed by flow cytometry. rsPMNs (red) and pPMNs (black) had similar percentages of pHrodo+ cells (D) and geometric mean fluorescent intensity (gMFI) (E) at each time point. Paired comparisons were performed at each time point by 2-way ANOVA with a post hoc Bonferroni correction. (F) CellRox reagent was incubated with human blood at 37°C in the presence or absence (Cnt) of TNF-α or fMLF, fixed and analyzed by flow cytometry. rsPMNs (red) and pPMNs (black) had similar increases of the percentage of CellRox+ cells in response to stimulation (G). Two-way ANOVA was performed with a post hoc Bonferroni correction. rsPMN and pPMN values were compared under each condition. ns, not significant.
pPMNs are sensitive to purification protocols
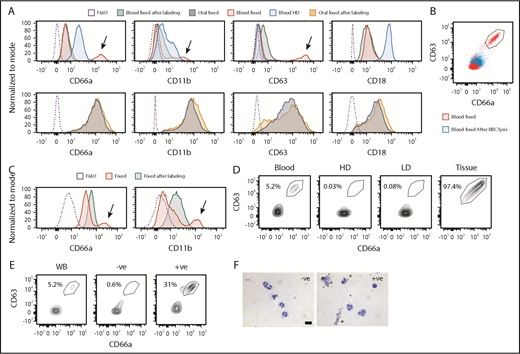
We and others have shown that fixation of fresh samples, prior to processing and labeling for flow cytometry, preserves PMN CD marker expression and mitigates the problem of PMN activation as a result of sample manipulation.3,25,26 However, there is a concern that fixation could alter relevant epitopes. To confirm that sample fixation did not alter target epitopes, we compared the effects of fixation at different stages during our sample processing and labeling procedure. For human samples, we compared fixation of fresh samples to fixation after RBC lysis, or fixation at the very end of the flow cytometric labeling procedure. We found that fixation at the outset did not alter the fluorescent labeling of oral PMNs, whereas blood PMNs had elevated expression of CD63 and CD11b when they were not fixed prior to processing (Figure 3A). Furthermore, PMNs recovered from the high-density (HD) fraction of conventional density gradients, had upregulated expression of CD66a, CD11b and CD18, consistent with upregulation of these markers as a result of sample manipulation. When blood samples were fixed after sample processing and antibody labeling steps the pPMN population was absent (Figure 3A). To further assess pPMN sensitivity to in vitro processing we compared blood that was fixed at the outset with blood that was fixed following the RBC lysis step. We found that the pPMN population was absent if the samples were fixed after RBC lysis (Figure 3B), suggesting that pPMNs are sensitive to RBC hypotonic lysis. We tested the effects of sample manipulation on mouse rsPMN and pPMN populations. Similar to human, the pPMN population was absent from mouse samples when blood was fixed at the end rather than prior to RBC lysis and flow cytometric labeling (Figure 3C). Furthermore, processing and labeling of PMNs prior to fixation resulted in upregulation of CD11b and CD66a, consistent with upregulation of these markers as a result of sample manipulation.

pPMNs are sensitive to conventional methods of purification. (A) Human blood and oral PMNs were fixed prior to, or after, processing and labeling for flow cytometry. Density gradient centrifugation was performed and high-density (HD) PMNs were recovered and labeled for flow cytometry. Histogram plots for representative CD markers on gated PMNs are shown. Arrows indicate the pPMN population. FMO controls are shown. (B) Human blood was fixed prior to, or after, RBC lysis. A representative contour plot of CD66a × CD63 expression on gated PMNs is shown. The pPMN gate is indicated. (C) Mouse blood was fixed prior to, or after, processing and labeling for flow cytometry. Representative histograms are shown. Arrows indicate pPMN populations. FMO controls are shown. (D) Human blood was separated by density centrifugation. CD66a × CD63 scatterplots of gated PMNs are shown from a representative experiment. Representative scatterplots of whole blood PMNs, HD PMNs, low-density (LD) PMNs, and tissue PMNs (oral) PMNs are shown. (E) PMNs were enriched from whole human blood by EasySep magnetic bead negative selection. Representative contour plots are shown for whole blood (WB), bead-negative, and bead-positive populations. (F) DiffQuick images of bead-negative and bead-positive fractions indicate the presence of PMNs in both fractions. Scale bar, 10 µm.
pPMNs are sensitive to conventional methods of purification. (A) Human blood and oral PMNs were fixed prior to, or after, processing and labeling for flow cytometry. Density gradient centrifugation was performed and high-density (HD) PMNs were recovered and labeled for flow cytometry. Histogram plots for representative CD markers on gated PMNs are shown. Arrows indicate the pPMN population. FMO controls are shown. (B) Human blood was fixed prior to, or after, RBC lysis. A representative contour plot of CD66a × CD63 expression on gated PMNs is shown. The pPMN gate is indicated. (C) Mouse blood was fixed prior to, or after, processing and labeling for flow cytometry. Representative histograms are shown. Arrows indicate pPMN populations. FMO controls are shown. (D) Human blood was separated by density centrifugation. CD66a × CD63 scatterplots of gated PMNs are shown from a representative experiment. Representative scatterplots of whole blood PMNs, HD PMNs, low-density (LD) PMNs, and tissue PMNs (oral) PMNs are shown. (E) PMNs were enriched from whole human blood by EasySep magnetic bead negative selection. Representative contour plots are shown for whole blood (WB), bead-negative, and bead-positive populations. (F) DiffQuick images of bead-negative and bead-positive fractions indicate the presence of PMNs in both fractions. Scale bar, 10 µm.
We tested the effects of conventional PMN purification procedures on recovery of the pPMN population. When density gradient centrifugation was performed, pPMNs were not recovered from the HD or low-density bands (Figure 3D), despite these samples being fixed after recovery from the gradient. When PMNs were purified by magnetic bead–negative selection, only rsPMNs were found in the PMN-enriched fraction, whereas pPMNs and rsPMNs were found in the bead-positive fraction (Figure 3E). The fact that pPMNs were strongly enriched in the bead-positive fraction confirms that they have distinct properties from rsPMNs and that they bind to at least 1 component of the bead cocktail. Cytospins confirmed the presence of PMNs in the bead-positive fraction (Figure 3F). These results indicate that pPMNs are highly sensitive to current purification protocols, and that fixation prior to RBC lysis is necessary to maintain this population.
pPMNs bind citrullinated histones, DNA, elastase, and MPO
While performing live/dead staining with the fixable eFlour506 dye (Figure 2), we also tested the DNA stain SYTOX Green, which is commonly used as a live/dead marker. SYTOX labeling was performed in fresh whole blood, followed by washing, fixation, and labeling for flow cytometric analysis. We found that the pPMN population, but not the rsPMNs, picked up the SYTOX dye (Figure 4A). Based on the observation that PMN CD11b/CD18 integrin can act as a DNA-binding module,53,54 we predicted that the pPMNs might be binding nucleic acids from the extracellular environment. We therefore tested for surface expression of several known markers of neutrophil extracellular traps (NETs), including H3Cit, neutrophil elastase (NE), and MPO. We found that pPMNs, but not rsPMNs, were positive for markers of NETotic DNA in humans (Figure 4A) and mice (Figure 4C). Immunofluorescent staining confirmed the surface labeling of pPMN neutrophils with H3Cit in both humans (Figure 4B) and mice (Figure 4D). To confirm the presence of surface-bound DNA on pPMNs in vivo, we performed tail-vein injection of SYTOX dye, and analyzed blood PMNs by flow cytometry. We found that pPMNs, but not rsPMNs were labeled in vivo 30 minutes after IV injection of SYTOX Green (Figure 4E). To demonstrate that pPMNs can bind DNA, we tested the ability of rsPMNs and pPMNs to bind exogenous NETotic DNA. When mouse blood was incubated with SYTOX-labeled post-NETotic DNA, we found that pPMNs picked up the fluorescent signal, whereas the rsPMNs did not (Figure 4F), suggesting that pPMNs might scavenge NETotic DNA from serum.
![Figure 4. pPMNs display surface markers of NETotic DNA. (A) Surface expression of H3Cit, neutrophil elastase (NE), MPO, and the cell-impermeable DNA dye SYTOX were determined on gated rsPMNs (rs) and pPMNs (p) in human blood. FMO controls are indicated. (B) Human blood PMNs were labeled with H3Cit (AF488) and pPMNs were purified by FACS. Cytospins were labeled with DAPI and imaged by fluorescence microscopy. An asterisk (*) indicates surface H3Cit labeling. Representative images are shown. Scale bar, 10 µm. (C) Surface expression of H3Cit, NE, and SYTOX were determined on gated mouse rsPMNs (rs) and pPMNs (p). FMO controls are indicated. (D) H3Cit labeling was performed and cytospins were prepared and labeled with DAPI. PMNs were identified by nuclear morphology. An asterisk (*) indicates surface H3Cit labeling. Representative images are shown. Confocal images were acquired using a Zeiss Axio Observer Z1 microscope with a Plan-Apochromat 63×/1.4 oil-immersion objective. Scale bar, 10 µm. (E) Blood was recovered by cardiac puncture 30 minutes after tail vein injection of SYTOX Green dye (50 µL of 5 µM solution). Representative SYTOX histograms of gated rsPMNs (rs), pPMNs (p), and FMO controls are indicated. (F) SYTOX-labeled NETotic DNA (+sD, 200 ng) or unlabeled DNA (−sD) was added to mouse blood for 10 minutes at 37°C. Gated rsPMNs (rs) and pPMNs (p) were analyzed by flow cytometry. Triplicate results are compiled from 3 independent experiments (n = 3). gMFI of SYTOX signal (mean ± standard error of the mean [SEM]) is shown. P values were determined by ANOVA with a post hoc Fisher's LSD test. ***P < .0005.](https://ash.silverchair-cdn.com/ash/content_public/journal/bloodadvances/3/10/10.1182_bloodadvances.2018030585/2/m_advances030585f4.png?Expires=1768099518&Signature=FFMRSeDP9sUNAml1yiupwpuaCzj7yerTKtP-ebzNd1wYycmulPcQg9lvTxIBEKZALh0DK80mKecybnUK2~aDuCmwZdHUlnYJDGbpAjdxuiyR2YQ244vlUascdiytetWHYB2G6DH20ZHH0MRJ8p0DyxQgNpGpjermcRvIkA1Um6cB41ys2VTTRMIV~fq538mV~l2kI~pY8K3jyzJZOr5RbievMp98MlBfZ3XakfCpdvy5VpcGTYdFWKPWZgJofwn~d8jQ9vxJ4O19Kqzqm8SWEQflKXgyIlyYNEz5nDoXu1Sp~UR~ui4PTS552MgZpd14ixbQJ6lqtYvCEk4T1kokGQ__&Key-Pair-Id=APKAIE5G5CRDK6RD3PGA)
pPMNs display surface markers of NETotic DNA. (A) Surface expression of H3Cit, neutrophil elastase (NE), MPO, and the cell-impermeable DNA dye SYTOX were determined on gated rsPMNs (rs) and pPMNs (p) in human blood. FMO controls are indicated. (B) Human blood PMNs were labeled with H3Cit (AF488) and pPMNs were purified by FACS. Cytospins were labeled with DAPI and imaged by fluorescence microscopy. An asterisk (*) indicates surface H3Cit labeling. Representative images are shown. Scale bar, 10 µm. (C) Surface expression of H3Cit, NE, and SYTOX were determined on gated mouse rsPMNs (rs) and pPMNs (p). FMO controls are indicated. (D) H3Cit labeling was performed and cytospins were prepared and labeled with DAPI. PMNs were identified by nuclear morphology. An asterisk (*) indicates surface H3Cit labeling. Representative images are shown. Confocal images were acquired using a Zeiss Axio Observer Z1 microscope with a Plan-Apochromat 63×/1.4 oil-immersion objective. Scale bar, 10 µm. (E) Blood was recovered by cardiac puncture 30 minutes after tail vein injection of SYTOX Green dye (50 µL of 5 µM solution). Representative SYTOX histograms of gated rsPMNs (rs), pPMNs (p), and FMO controls are indicated. (F) SYTOX-labeled NETotic DNA (+sD, 200 ng) or unlabeled DNA (−sD) was added to mouse blood for 10 minutes at 37°C. Gated rsPMNs (rs) and pPMNs (p) were analyzed by flow cytometry. Triplicate results are compiled from 3 independent experiments (n = 3). gMFI of SYTOX signal (mean ± standard error of the mean [SEM]) is shown. P values were determined by ANOVA with a post hoc Fisher's LSD test. ***P < .0005.
pPMNs display surface markers of NETotic DNA. (A) Surface expression of H3Cit, neutrophil elastase (NE), MPO, and the cell-impermeable DNA dye SYTOX were determined on gated rsPMNs (rs) and pPMNs (p) in human blood. FMO controls are indicated. (B) Human blood PMNs were labeled with H3Cit (AF488) and pPMNs were purified by FACS. Cytospins were labeled with DAPI and imaged by fluorescence microscopy. An asterisk (*) indicates surface H3Cit labeling. Representative images are shown. Scale bar, 10 µm. (C) Surface expression of H3Cit, NE, and SYTOX were determined on gated mouse rsPMNs (rs) and pPMNs (p). FMO controls are indicated. (D) H3Cit labeling was performed and cytospins were prepared and labeled with DAPI. PMNs were identified by nuclear morphology. An asterisk (*) indicates surface H3Cit labeling. Representative images are shown. Confocal images were acquired using a Zeiss Axio Observer Z1 microscope with a Plan-Apochromat 63×/1.4 oil-immersion objective. Scale bar, 10 µm. (E) Blood was recovered by cardiac puncture 30 minutes after tail vein injection of SYTOX Green dye (50 µL of 5 µM solution). Representative SYTOX histograms of gated rsPMNs (rs), pPMNs (p), and FMO controls are indicated. (F) SYTOX-labeled NETotic DNA (+sD, 200 ng) or unlabeled DNA (−sD) was added to mouse blood for 10 minutes at 37°C. Gated rsPMNs (rs) and pPMNs (p) were analyzed by flow cytometry. Triplicate results are compiled from 3 independent experiments (n = 3). gMFI of SYTOX signal (mean ± standard error of the mean [SEM]) is shown. P values were determined by ANOVA with a post hoc Fisher's LSD test. ***P < .0005.
pPMNs are first responders and fluctuate with tissue-inflammatory state
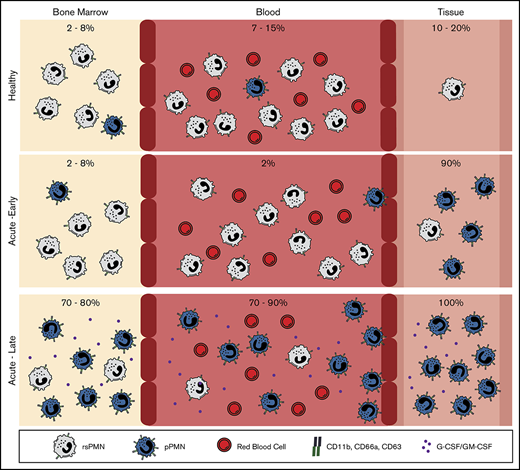
To monitor changes in pPMN levels in response to an inflammatory stimulus, we analyzed mouse blood and BM PMN CD marker expression after inducing an acute self-resolving peritonitis with nonviable pHrodo E coli bioparticle conjugates. At the earliest time points tested (10 and 30 minutes), pPMNs were largely depleted from blood (Figure 5B,D). This depletion of pPMNs coincided with the appearance of PMNs in the peritoneum, which had a similar CD marker signature as the pPMNs (Figure 5C-D). This suggests that pPMNs are quickly recruited to the tissues, consistent with early peritoneal recruitment of SYTOX-labeled pPMNs. One to 3 hours after initiation of peritoneal inflammation, ∼80% to 90% of PMNs in BM and circulation became primed (Figure 5A-D), suggesting that systemic factors produced in response to the localized inflammatory trigger induce surface upregulation of adhesion receptors on the bulk of circulating and BM PMNs. PMN priming in the BM and circulation returned to baseline levels over the following 48 hours, with resolution of inflammation. Depletion of pPMNs from blood at the earliest time points, and upregulation of PMN CD marker expression later during acute peritonitis, indicate that priming is not a by-product of sample manipulation, and reaffirm that sample fixation does not alter target epitope recognition by their cognate antibodies because fixation was performed on all samples. Although it is possible that upregulated expression of CD11b and CD66a is not a prerequisite for recruitment because PMNs with low CD11b and low CD66a were observed in the peritoneum at time 0 and 48 hours after peritonitis, our results indicate an association between upregulation of these adhesion receptors and peak recruitment to the inflamed tissue.
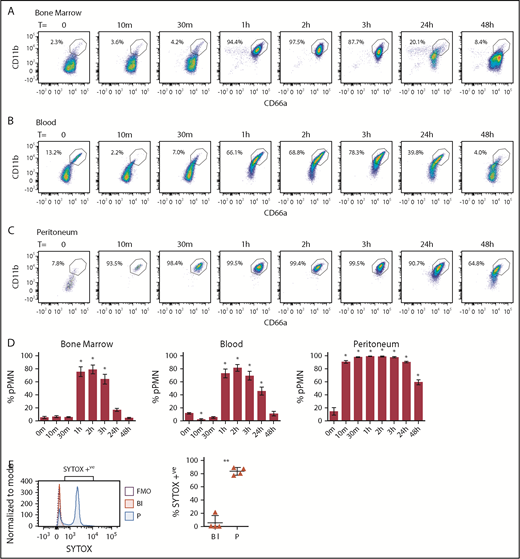
pPMNs in BM, blood, and peritoneum fluctuate with acute inflammation. BM (A), blood (B), and peritoneal (C) PMNs were monitored after peritoneal injection of E coli–pHrodo bioparticles (100 µL). (D) pPMNs were determined as a percentage of total PMNs in BM, blood, and peritoneum at each time point, based on high expression of CD66a and CD11b. Mean percentages of pPMNs ± SEM are shown (n ≥ 9). P values were determined by ANOVA with a post hoc Fisher's LSD test. All comparisons are with untreated controls (T = 0 m). *P < .0001. (E) Blood and peritoneal lavage were collected 1 hour after tail-vein injection of SYTOX Green and pHrodo-induced peritonitis, and analyzed by flow cytometry. Representative SYTOX histograms of blood PMNs (Bl), peritoneal PMNs (P), and FMO controls are indicated. The mean percentages of SYTOX-positive blood and peritoneal PMNs ± SEM are indicated; n = 4. A 2-tailed Student t test was performed. **P < .005.
pPMNs in BM, blood, and peritoneum fluctuate with acute inflammation. BM (A), blood (B), and peritoneal (C) PMNs were monitored after peritoneal injection of E coli–pHrodo bioparticles (100 µL). (D) pPMNs were determined as a percentage of total PMNs in BM, blood, and peritoneum at each time point, based on high expression of CD66a and CD11b. Mean percentages of pPMNs ± SEM are shown (n ≥ 9). P values were determined by ANOVA with a post hoc Fisher's LSD test. All comparisons are with untreated controls (T = 0 m). *P < .0001. (E) Blood and peritoneal lavage were collected 1 hour after tail-vein injection of SYTOX Green and pHrodo-induced peritonitis, and analyzed by flow cytometry. Representative SYTOX histograms of blood PMNs (Bl), peritoneal PMNs (P), and FMO controls are indicated. The mean percentages of SYTOX-positive blood and peritoneal PMNs ± SEM are indicated; n = 4. A 2-tailed Student t test was performed. **P < .005.
To confirm and firmly establish that pPMNs are first responders to the tissue, we took advantage of the specific labeling of pPMNs by SYTOX to track their tissue recruitment by in vivo labeling. We performed in vivo pulse labeling of pPMN cells by tail-vein injection of SYTOX Green, concurrent with acute peritonitis. After 1 hour, we found that the majority of neutrophils in the peritoneum were SYTOX-positive, whereas SYTOX-positive pPMNs were largely depleted from the circulation (Figure 5E).
G-CSF and GM-CSF prime PMNs in vivo and in vitro
To identify systemic factors that contribute to the pPMN response during an acute inflammatory response, we used array hybridization to compared inflammatory cytokines from naive mice and those exposed to acute peritonitis. Cytokines that we identified that were elevated in mouse serum (supplemental Figure 2) and in peritoneal lysates (data not shown) 3 hours after peritoneal injection of pHrodo, included: G-CSF, MCP-1, RANTES, IL-6, and IL-12. We tested these factors, and others using in vitro and in vivo assays, to identify which factors induced PMN priming. In vitro stimulation of mouse BM with G-CSF, GM-CSF, or PMA induced a significant increase in pPMNs, however, other factors including MCP-1, RANTES, IL-6, LPS, and pHrodo failed to induce PMN priming (Figure 6A). Preliminary in vitro results indicate that LPS was sufficient to induce pPMNs in mouse blood (N.F., unpublished results), suggesting that sensitivity of PMN priming to specific factors is different for BM and blood. IV injection of G-CSF or GM-CSF was sufficient to induce pPMNs in mouse BM (Figure 6B) and blood (Figure 6C) in vivo.

Murine models of granulopoiesis. (A) BM (n ≥ 4) was stimulated in vitro at 37°C for 30 minutes with PBS (P), GM-CSF (GM), G-CSF (G), PMA, MCP-1 (M), RANTES (R), IL-6, LPS (L), or pHrodo (pH), fixed, and analyzed by flow cytometry. One-way ANOVA was performed with the post hoc Fisher's LSD test. ****P < .0001. (B-C) PBS, GM-CSF, or G-CSF were introduced by tail-vein injection (n = 4). pPMN percentages in BM and blood were determined after 1 hour. Representative contour plots are shown. One-way ANOVA was performed with the post hoc Fisher's LSD test. *P < .05; **P < .01.
Murine models of granulopoiesis. (A) BM (n ≥ 4) was stimulated in vitro at 37°C for 30 minutes with PBS (P), GM-CSF (GM), G-CSF (G), PMA, MCP-1 (M), RANTES (R), IL-6, LPS (L), or pHrodo (pH), fixed, and analyzed by flow cytometry. One-way ANOVA was performed with the post hoc Fisher's LSD test. ****P < .0001. (B-C) PBS, GM-CSF, or G-CSF were introduced by tail-vein injection (n = 4). pPMN percentages in BM and blood were determined after 1 hour. Representative contour plots are shown. One-way ANOVA was performed with the post hoc Fisher's LSD test. *P < .05; **P < .01.
Using in vitro stimulation of PMNs in human blood, we found that PMA, as well as the formylated peptide (fMLF), were sufficient to induce a fourfold to fivefold increase of primed PMNs after a one-half-hour treatment (supplemental Figure 3A-B). In addition to increasing the percentage of pPMNs, fMLP and PMA stimulation induced surface upregulation of CD63, CD66a, and CD11b on rsPMNs, and a further increase of CD66a and CD11b expression on pPMNs (supplemental Figure 3C), indicating that pPMNs retain the potential for further upregulation of some CD markers upon stimulation. Western blotting analysis demonstrated reduced levels of granule contents including primary (MPO), secondary (MMP8), and tertiary (MMP9) granules, in blood leukocyte lysates after treatment with fMLF and PMA, indicating that degranulation is likely to contribute to the pPMN phenotype (supplemental Figure 3D). PMA produced greater degranulation of secondary and tertiary granules compared with fMLF, but a similar effect on the percentage of pPMNs. This suggests that primary (azurophilic) granules might contribute to CD63 upregulation, whereas secondary and tertiary granules contribute to CD66a and CD11b upregulation.
pPMN levels fluctuate in human models of tissue microtrauma
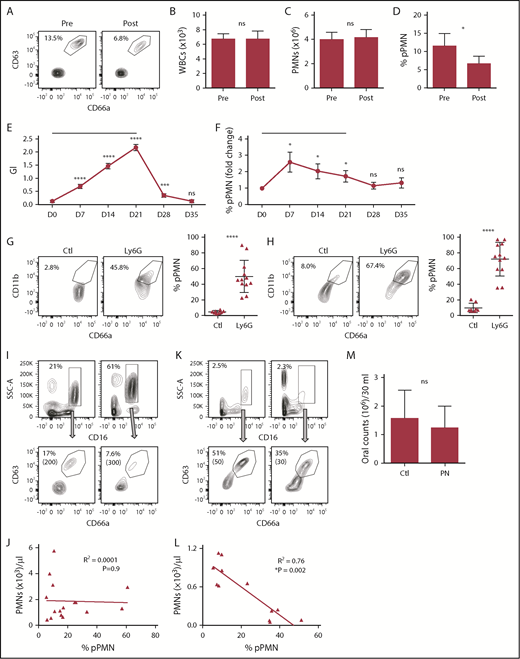
To determine whether circulating pPMN levels fluctuate in humans, we monitored their levels in a model of acute tissue microtrauma. pPMNs were quantified in human blood prior to and 15 minutes after dental probing, which induces local microtrauma within the gingival tissues adjacent to the dentition resulting in PMN influx into the periodontal tissues and oral cavity. Although total white blood cell and PMN counts in the blood did not change, there was a twofold reduction of circulating pPMNs, as a percentage of total PMNs, after acute wounding of gingival tissue (Figure 7A-D). Thus, pPMNs are depleted from circulation during initial phases of acute tissue trauma that result in PMN recruitment into damaged tissue.

pPMN levels fluctuate with tissue trauma/inflammation and neutropenia. Blood was obtained from human volunteers prior to (pre) and 15 minutes following (post) gingival probing induced microtrauma (A-D; n = 9). Representative contour plots and pPMN percentages are shown (A). White blood cell counts (WBC) (B), total PMN counts per milliliter of blood (C), and percentage of pPMNs as a fraction of total gated PMNs (D) are shown. Mean values ± SEM are shown. P values were determined by paired Student t test. *P ≤ .05. (E-F) Clinical parameters and blood PMNs were assessed on a weekly basis for volunteers undergoing experimental gingivitis (n = 25). A black horizontal line designates the period of cessation of oral hygiene. GI and blood pPMN percentages were determined weekly from days 0 to 35. Mean values ± SEM are shown. Repeated measures ANOVA was performed with the Fisher's LSD test for multiple comparisons. All comparisons are relative to day 0 (D0). *P ≤ .05; ***P ≤ .0005; ****P ≤ .0001. (G-H) PMNs were depleted in mice by intraperitoneal injection of anti-Ly6G, and pPMN levels in BM (G) and blood (H) were determined 2 to 5 days later. We consistently observed a 90% to 98% depletion of PMNs in BM and blood by anti-Ly6G injection. Representative dot plots are shown for control (Ctl; n = 8) and Ly6G-depleted (Ly6G, n = 12) mice. The mean percentage of pPMNs as a fraction of total PMNs is shown (±SD). A 2-tailed unpaired Student t test was performed. ****P < .0001. (I-L) The percentage of PMNs and pPMNs in healthy controls and pediatric neutropenia patients was determined by flow cytometry. Representative contour plots are shown for 2 healthy controls (I) and 2 neutropenia patients (K). Percentage PMNs and percentage pPMNs are indicated. Absolute pPMN counts per microliter of blood are indicated in parentheses. Linear regression analysis was performed. An inverse correlation between pPMN percentage and PMNs per microliter of blood was observed in the neutropenia cohort (n = 12), whereas no correlation was found in the healthy controls (n = 16). (M) PMN counts from control (Ctl) and pediatric neutropenic patient (PN) oral rinse samples were determined. The 2-tailed Student t test was performed.
pPMN levels fluctuate with tissue trauma/inflammation and neutropenia. Blood was obtained from human volunteers prior to (pre) and 15 minutes following (post) gingival probing induced microtrauma (A-D; n = 9). Representative contour plots and pPMN percentages are shown (A). White blood cell counts (WBC) (B), total PMN counts per milliliter of blood (C), and percentage of pPMNs as a fraction of total gated PMNs (D) are shown. Mean values ± SEM are shown. P values were determined by paired Student t test. *P ≤ .05. (E-F) Clinical parameters and blood PMNs were assessed on a weekly basis for volunteers undergoing experimental gingivitis (n = 25). A black horizontal line designates the period of cessation of oral hygiene. GI and blood pPMN percentages were determined weekly from days 0 to 35. Mean values ± SEM are shown. Repeated measures ANOVA was performed with the Fisher's LSD test for multiple comparisons. All comparisons are relative to day 0 (D0). *P ≤ .05; ***P ≤ .0005; ****P ≤ .0001. (G-H) PMNs were depleted in mice by intraperitoneal injection of anti-Ly6G, and pPMN levels in BM (G) and blood (H) were determined 2 to 5 days later. We consistently observed a 90% to 98% depletion of PMNs in BM and blood by anti-Ly6G injection. Representative dot plots are shown for control (Ctl; n = 8) and Ly6G-depleted (Ly6G, n = 12) mice. The mean percentage of pPMNs as a fraction of total PMNs is shown (±SD). A 2-tailed unpaired Student t test was performed. ****P < .0001. (I-L) The percentage of PMNs and pPMNs in healthy controls and pediatric neutropenia patients was determined by flow cytometry. Representative contour plots are shown for 2 healthy controls (I) and 2 neutropenia patients (K). Percentage PMNs and percentage pPMNs are indicated. Absolute pPMN counts per microliter of blood are indicated in parentheses. Linear regression analysis was performed. An inverse correlation between pPMN percentage and PMNs per microliter of blood was observed in the neutropenia cohort (n = 12), whereas no correlation was found in the healthy controls (n = 16). (M) PMN counts from control (Ctl) and pediatric neutropenic patient (PN) oral rinse samples were determined. The 2-tailed Student t test was performed.
pPMNs fluctuate during experimental gingivitis
To further test acute inflammation-induced changes in pPMN levels, we performed an experimental gingivitis study.49,55 Healthy volunteers ceased oral hygiene activities for 21 days to induce acute gingival inflammation (gingivitis), followed by a 2-week recovery period where oral hygiene was reinstituted. As anticipated, patients presented with increased gingival inflammation during the gingivitis period (days 7, 14, and 21), with resolution following reinstitution of oral hygiene measures (days 28 and 35), as reflected by an increase in the mean GI index (Figure 7E) and increased delivery of PMNs into the oral cavity.55 Coincident with the rise in the GI and increased PMN delivery into the oral cavity, an increase in the mean percentage of circulating pPMNs was observed (Figure 7F), indicating that localized inflammation within the oral cavity was sufficient to induce a proinflammatory response characterized by increased pPMNs in the circulation. After resumption of oral hygiene activities, the GI and pPMN levels in circulation returned to baseline levels.
pPMNs are elevated in neutropenia
In health, PMNs are continuously recruited to mucosal sites where they interact with commensal biofilm.3 We hypothesized that during neutropenia, pPMN levels are rate limiting for effective suppression of infection, and that the low levels of remaining PMNs will be in a primed state. To test this hypothesis, we depleted PMNs in the mouse by intraperitoneal injection of an anti-Ly6G antibody and monitored BM and blood PMN populations. PMNs were almost completely depleted from blood and BM between 2 and 5 days after injection and, although PMN counts were very low (<300 cells per 200 µL of blood) in neutropenic mice, the pPMN-to-rsPMN ratio was significantly higher in BM and blood compared with untreated mice (Figure 7G-H).
Although neutropenic mice had an increase in the ratio of pPMNs to rsPMNs, Ly6G can have effects that are independent of removal of PMNs. We therefore explored the effects of neutropenia on the proportion of pPMNs in humans. Pediatric neutropenic patients who did not experience recurrent febrile episodes or infections over a period of 12 months were recruited. Similar to our results from the mouse model of neutropenia, pPMN percentages were inversely correlated to absolute PMN counts in our cohort of neutropenic patients, but not in the aged matched healthy control cohort (Figure 7I-L). Thus, in patients with low circulating PMN levels, there is a relative increase of pPMNs compared with rsPMNs. Normal levels of PMN recruitment to the oral cavity were observed in these neutropenic patients (Figure 7M). The confirmation of normal PMN tissue delivery in spite of low blood PMN counts was consistent with the observed oral health in these neutropenic patients.
Discussion
PMNs are abundant effector cells that participate in innate immune surveillance and demonstrate remarkable sensitivity and rapid responses to infection and tissue damage. As a corollary, PMNs are also highly sensitive to in vitro manipulation that is typical of PMN isolation protocols, including density gradient centrifugation and hypotonic lysis of RBCs, which introduces a significant challenge for assessment of their in vivo activation status.3,24-26,56-58 To mitigate PMN sensitivity to purification protocols, we used a fixation approach that allows for the capture of native PMN activation states by preventing handling-mediated activation that occurs during ex vivo manipulation.3 Fixation prior to labeling, was previously a common practice,25,59 and more recently it is required for cutting edge mass cytometry approaches.60 Although, a number of groups have proposed the existence of unique PMN subsets in the context of disease,9-17,61-64 here, we use fixation to detect PMN priming in healthy blood. Specifically, we found that a pPMN population in blood was sensitive to RBC lysis, unless fixation was performed prior to this step. The fact that PMN priming was greatly enhanced by acute tissue inflammation (Figure 5) or treatment with granulopoietic factors (Figure 6) supports the biological validity of the primed subset and preempts the possibility that the primed phenotype could be an artifact of fixation. Confocal imaging also confirms elevated surface labeling of CD66a and CD11b on pPMNs compared with rsPMNs. Our results demonstrate that CD11b, an important adhesion receptor for transmigration, has low expression on the bulk rsPMN population, and is highly upregulated on pPMNs, which is likely to enhance the potential of these PMNs to be recruited to tissue. We show that CD11b and CD66a expression is upregulated on rsPMNs downstream of specific granulopoietic (G-CSF and GM-CSF) factors, or as a side effect of in vitro manipulation during PMN purification procedures, and that this is through partial degranulation of PMNs prior to their arrival in the tissues. Although fixation was necessary to preserve rsPMN and pPMN populations, short incubations of whole blood at 37°C or labeling of whole blood on ice were possible, as long as fixation was performed prior to further manipulations.
CD66a and CD11b, 2 of the CD markers that are highly expressed on pPMNs, are molecules that mediate adhesion and recruitment to sites of inflammation, and it seems reasonable to hypothesize that they are involved in the rapid tissue recruitment process. Marked systemic priming of PMNs in BM and blood during the acute response to peritonitis, when adhesion-dependent tissue recruitment of PMNs is at its peak, is consistent with this model (supplemental Figure 4). Although high expression of these markers is associated with rapid depletion of pPMNs from the circulation, and early recruitment of SYTOX-labeled pPMNs to the inflamed peritoneum immediately following the induction of an acute peritonitis (Figure 4G), our data do not directly establish the role of these receptors, and we cannot rule out the possibility that other receptors may be involved in the rapid recruitment. In addition to a heightened expression of adhesion receptors, pPMNs exhibit surface-bound DNA and associated enzymes, including elastase and MPO, and our results indicate that pPMNs scavenge SYTOX-labeled DNA, which is consistent with the previously demonstrated ability of PMNs to bind DNA through CD11b/CD18 integrin.53,54 Further studies are necessary to determine any potential role of pPMN surface NETs.
PMN priming is a complex process involving an initial stimulus that potentiates a heightened response to a secondary trigger.35 PMN priming can be induced by a wide range of stimuli, including cytokines,65 microbial factors,66 oxidants,67 and mechanical force,68 and can refer to priming with respect to various downstream responses, including respiratory burst,19 cell polarization,69 chemotaxis,70 and NETosis.71 In the current manuscript, we refer specifically to priming with respect to PMN recruitment to activated endothelia and subsequent transmigration. Other functional outputs including phagocytosis and ROS production did not differ between pPMNs and rsPMNs. Considering the wide range of threats encountered by PMNs and the diversity of PMN expressed pattern recognition receptors, it seems likely that PMNs can be primed in different ways depending on the inflammatory context.35 Based on the new experimental avenues established here, future studies will be necessary to dissect the full range of potential PMN responses in blood and tissue.
Due to the ubiquitous role of PMNs in health and disease states, monitoring the levels of primed PMNs in circulation is likely to be useful in a wide range of inflammatory conditions. We found that neutropenic children who are resistant to infection and exhibit good oral health, have a higher proportion of circulating pPMNs compared with age-matched healthy controls, and normal delivery of PMNs to the oral cavity, consistent with the important role of PMNs to help control the oral biofilm and prevent severe periodontitis and tooth loss.72 Further clinical studies are needed to determine whether low pPMN levels occur in patients suffering from inherited neutropenia who suffer from frequent infections. If true, this would indicate that the level of pPMNs, as first responder effector cells, is more critical in maintaining health than the total level of circulating PMNs, and that pPMNs could be monitored prospectively as an indicator of susceptibility to infection because there is currently no reliable test to determine infection risk among patients with a similar severity of neutropenia. Our observations that pPMNs predominate during acute inflammation, in neutropenia and during the onset of acute gingivitis (Figure 7), suggest that monitoring the dynamics of the pPMN population may be useful in a clinical setting as a barometer of innate immune status.
The full-text version of this article contains a data supplement.
Acknowledgments
Cell sorting was performed by Dionne White at the flow cytometry facility at the Department of Immunology, University of Toronto.
This work was supported by a Bone Team grant from the Canadian Institutes of Health Research (TBO-122068) (M. Glogauer).
Authorship
Contribution: M. Glogauer, N.F., D.J.P., and Y.D. designed the research; N.F., C.S., N.W., O.B., J.W.C., F.T., D.P., M.O., and N.T. performed the research; Y.D., and M. Gargan helped guide the neutropenia clinical study; and N.F. and M. Glogauer wrote the paper.
Conflict-of-interest disclosure: The authors declare no competing financial interests.
Correspondence: Michael Glogauer, Matrix Dynamics Group, Faculty of Dentistry, University of Toronto, 124 Edward St, Toronto, ON M5G 1G6, Canada; e-mail: michael.glogauer@utoronto.ca.

![Figure 1. Identification of a novel PMN activation subset in healthy blood that has similar CD marker expression as tissue PMNs. (A) Representative histograms of CD63, CD66a, and CD11b expression are shown for human blood PMNs (CD16high/side scatter area [SSC-A]high) of healthy volunteers, compared with tissue (oral) PMNs. pPMNs (∼10% of total circulating PMNs) can be distinguished from conventional rsPMNs based on elevated tissue-level CD marker expression. FMO controls are shown. (B) A scatter dot plot shows the mean ± standard deviation (SD) pPMN percentages of total gated PMNs in blood of healthy volunteers (n = 64). (C) Representative CD66a × CD63 scatterplots of human blood and tissue (oral) PMNs and representative forward scatter area (FSC-A) × SSC-A profiles of rsPMNs, pPMNs, and tissue (oral) PMNs are shown. (D) Representative images of DiffQuik-stained, FACS-sorted human rsPMNs and pPMNs are shown. Scale bar, 10 µm. Images were acquired using a Nikon E1000 microscope with a 100×/1.3 oil-immersion Plan Fluor objective. Image analysis was performed using Image J software (National Institutes of Health) to determine nuclear area of rsPMN and pPMN PMNs from 4 independent sorts. More than 300 cells were measured for each population. Mean values ± SD are shown. (E) Mouse BM, blood, and tissue (colon) PMN expression of CD66a, CD11b, and CD63 are shown. Colon cells were pooled from 3 mice. PMNs were gated based on Ly6Ghi and F4/80low (supplemental Figure 1D). FMO controls are shown. (F) Representative CD66a × CD11b and FSC-A × SSC-A dot plots are shown for gated mouse BM, blood, and tissue (colon) PMNs. (G) DiffQuik staining of FACS-sorted mouse rsPMNs and pPMNs was performed. Image analysis was performed as described in panel D from 2 independent sorts. Approximately 85 cells were measured for each population. Mean values ± SD are shown. P values were determined by 2-tailed paired Student t test. ****P < .0001. Representative confocal images of CD66a (H) and CD11b (I) labeled mouse blood leukocytes are shown. Nuclear staining (4′,6-diamidino-2-phenylindole [DAPI]) and merged images are also shown. PMNs were identified based on nuclear morphology. Images were acquired using a Zeiss Axio Observer Z1 microscope with a Plan-Apochromat 63×/1.4 oil-immersion objective. Scale bar, 10 µm.](https://ash.silverchair-cdn.com/ash/content_public/journal/bloodadvances/3/10/10.1182_bloodadvances.2018030585/2/m_advances030585f1.png?Expires=1768168915&Signature=1oJeN19ME4eKBKiYw2WOXVYH8YDfywv6cVxSijYk94kZraA-vIrw1Pv6gjKmTsRv6ZjFAeRqQHe~LqkwAN43gbdruTyf7WKU2odSm82bbclV9rtTvXglAZGSJzQnXWEOO~6sn5VXSTV91TJHqPflxTCPaA7Hedw~Ga7jdctlAUTZpTLFJk~BCIK0mgpGlVh0TSjY0cQubSQ3ZJ3H7aVd9ELdy7qNuWlfg6dDyGucsqDxng-lKG7ViZn7d0bIhOkvHLeZ0UUE9irxQGXsaOAEzXiQN3EBj2aHW5IXNcQEvIAMPPOu2hVOzGnE~zG-cRU--5a6QDnKcec9~JE1HVG8KQ__&Key-Pair-Id=APKAIE5G5CRDK6RD3PGA)

![Figure 4. pPMNs display surface markers of NETotic DNA. (A) Surface expression of H3Cit, neutrophil elastase (NE), MPO, and the cell-impermeable DNA dye SYTOX were determined on gated rsPMNs (rs) and pPMNs (p) in human blood. FMO controls are indicated. (B) Human blood PMNs were labeled with H3Cit (AF488) and pPMNs were purified by FACS. Cytospins were labeled with DAPI and imaged by fluorescence microscopy. An asterisk (*) indicates surface H3Cit labeling. Representative images are shown. Scale bar, 10 µm. (C) Surface expression of H3Cit, NE, and SYTOX were determined on gated mouse rsPMNs (rs) and pPMNs (p). FMO controls are indicated. (D) H3Cit labeling was performed and cytospins were prepared and labeled with DAPI. PMNs were identified by nuclear morphology. An asterisk (*) indicates surface H3Cit labeling. Representative images are shown. Confocal images were acquired using a Zeiss Axio Observer Z1 microscope with a Plan-Apochromat 63×/1.4 oil-immersion objective. Scale bar, 10 µm. (E) Blood was recovered by cardiac puncture 30 minutes after tail vein injection of SYTOX Green dye (50 µL of 5 µM solution). Representative SYTOX histograms of gated rsPMNs (rs), pPMNs (p), and FMO controls are indicated. (F) SYTOX-labeled NETotic DNA (+sD, 200 ng) or unlabeled DNA (−sD) was added to mouse blood for 10 minutes at 37°C. Gated rsPMNs (rs) and pPMNs (p) were analyzed by flow cytometry. Triplicate results are compiled from 3 independent experiments (n = 3). gMFI of SYTOX signal (mean ± standard error of the mean [SEM]) is shown. P values were determined by ANOVA with a post hoc Fisher's LSD test. ***P < .0005.](https://ash.silverchair-cdn.com/ash/content_public/journal/bloodadvances/3/10/10.1182_bloodadvances.2018030585/2/m_advances030585f4.png?Expires=1768168915&Signature=h2U5GxCH9Q38fdodYBrN8MTjF2EryLJpa0PNYvazc3ssP33PakoWphA352S1eSybQ8jiCFspxYXvrpJp7QWbzwk6YZ5RKDw2eWoJfA5dwzsTYH~UBFhtRj7r85QlBb~yjOd~7SpuZGeNoAUC9JNPId8c3OeOUvd4wp9b1f~3KUwcTSZR~9Vex9hy3vOqQ8ksLrN224OHf08vEgQw7AKivBZPWeUzTdFqxciKgh7dRDPwkkLvByA668mnJY4NYTDHsaAQ7IfyTqwvx-Tl3wCpv~EluioWAelADV365lTqRfgA9tCoinKsIcarxpuXSEBPzF2i0CpKlHEgjtFsPU2nyw__&Key-Pair-Id=APKAIE5G5CRDK6RD3PGA)