

Key Points
A protein-domain focused CRISPR-Cas9 screen uncovers SPOP as a novel HbF repressor.
The repressive role of SPOP on HbF is independent of BCL11A or LRF but is dependent on CUL3 activity.

Abstract
Reactivation of fetal hemoglobin (HbF) production benefits patients with sickle cell disease and β-thalassemia. To identify new HbF regulators that might be amenable to pharmacologic control, we screened a protein domain–focused CRISPR-Cas9 library targeting chromatin regulators, including BTB domain–containing proteins. Speckle-type POZ protein (SPOP), a substrate adaptor of the CUL3 ubiquitin ligase complex, emerged as a novel HbF repressor. Depletion of SPOP or overexpression of a dominant negative version significantly raised fetal globin messenger RNA and protein levels with minimal detrimental effects on normal erythroid maturation, as determined by transcriptome and proteome analyses. SPOP controls HbF expression independently of the major transcriptional HbF repressors BCL11A and LRF. Finally, pharmacologic HbF inducers cooperate with SPOP depletion during HbF upregulation. Our study implicates SPOP and the CUL3 ubiquitin ligase system in controlling HbF production in human erythroid cells and may offer new therapeutic strategies for the treatment of β-hemoglobinopathies.
Introduction
Hemoglobin comprises a tetramer containing 2 α-type and 2 β-type subunits. The human β-type globin gene cluster consists of an embryonic (ε-globin), 2 fetal (γ-globin), and 2 adult type (δ-globin and β-globin) genes. Mutations in the β-globin gene that underlie sickle cell disease (SCD) and some types of β-thalassemia become clinically relevant after birth when the fetal genes are silenced. Increased fetal hemoglobin (HbF) production as a result of natural genetic variation or therapeutic intervention can lower morbidity and mortality in β-hemoglobinopathies.1,2 Although promising strategies involving gene addition or genome editing are being pursued,3,4 their implementation will be largely restricted to patients with access to sophisticated medical providers. Effective HbF induction by pharmacologic means is therefore needed but remains a challenge.
BCL11A and LRF (ZBTB7A) are critical direct transcriptional repressors of the γ-globin genes.5-8 However, as DNA-binding proteins with functions in multiple tissues, they remain difficult to target pharmacologically and in an erythroid selective manner. Moreover, LRF depletion delays erythroid differentiation.8,9 In spite of a deep understanding of the transcriptional control of the globin genes, the regulatory circuitry outside of DNA-binding nuclear factors remains underexplored. Yet, it is clear from targeted depletion experiments that non–DNA-binding coregulatory complexes can play pivotal roles in HbF silencing.10,11
To identify new and potentially druggable nuclear HbF regulators, we screened in HUDEP-2 cells12 a library that is composed of single-guide RNAs (sgRNAs) directed against chromatin-associated nuclear proteins containing BTB domains, chromo domains, PWWP domains, and PHD domains among others (supplemental data) using an improved protein domain–based CRISPR-Cas9 platform.10,13 These domains have conserved structures and might provide potential surfaces for docking small-molecule inhibitors. Among ∼600 BTB proteins and E3 ligase components in the library, the screen selectively identified speckle-type POZ protein (SPOP), a substrate adaptor of the CUL3 ubiquitin ligase complex,14 as a novel repressor of γ-globin transcription.
The repressive role of SPOP on γ-globin levels is at least in part mediated by the CUL3 ubiquitin ligase complex, and disrupting SPOP-substrate interactions by overexpressing an SPOP-dominant negative mutant recapitulated the effect of SPOP depletion on γ-globin expression. The activity of SPOP seems to be carried out independently of BCL11A and LRF. SPOP depletion markedly amplified the effects of pharmacologic HbF inducers, including pomalidomide and hydroxyurea, suggesting that SPOP perturbation might be useful in combination with other treatment modalities.
Materials and methods
Cell culture
HUDEP-2 cells were cultured as described previously.12 Human primary CD34+ cells were purified from peripheral blood mononuclear cells obtained from the University of Pennsylvania Human Immunology Core using an MACS MicroBead kit. CD34+ cells were differentiated using a 3-phase culture system as described previously.15 Cells were harvested at days 13 to 16 and analyzed by HbF staining, Wright-Giemsa staining, cell surface marker staining, RNA sequencing (RNA-seq), reverse transcriptase quantitative polymerase chain reaction (RT-qPCR), western blot, and high-performance liquid chromatography.
Plasmids
The Cas9 expression vector was constructed by subcloning the 5′-3×FLAG-tagged human codon–optimized Cas9 complementary DNA (cDNA) from Streptococcus pyogenes into a lentiviral EFS-Cas9-P2A-Puro expression vector via the In-Fusion cloning system. All guide RNAs (gRNAs) were inserted into a lentiviral U6-gRNA-EFS-GFP/mCherry expression vector by BsmBI digestion. Lentivirus vectors expressing short hairpin RNA (shRNA) against human SPOP (pLKO.1-shRNA vectors) were purchased from Sigma. Two independent clones were used: TRCN0000145047 (shRNA#3) and TRCN0000139794 (shRNA#5). The BCL11A cDNA (from Jian Xu), mouse Spop (mSpop) cDNA (from Doris A. Stoffers), and human SPOP (hSPOP) wild-type (WT) and mutant cDNA (from Luca Busino) were subcloned into a lentiviral vector pSDM101-IRES-GFP by BamHI and NdeI. 5′ hemagglutinin (HA) tag was introduced by PCR. pFLBIO-BCL11A Puro plasmid was a gift from Jian Xu. SPOP cDNAs were also subcloned into pFLBIO Puro vector by BamHI and XbaI.
HbF staining and fluorescence-activated cell sorting
In total, 2 to 5 million cells were fixed in 0.05% glutaraldehyde for 10 minutes, washed 3 times with phosphate-buffered saline (PBS)/0.1% bovine serum albumin (BSA), and then permeabilized with 0.1% Triton X-100 for 3 to 5 minutes. After 1 wash with 1× PBS/0.1% BSA, cells were stained with HbF-allophycocyanin conjugate antibody (1:4 dilution in 1× PBS/0.1% BSA) for 30 minutes in the dark at room temperature. Cells were then washed twice with 1× PBS/0.1% BSA. Flow cytometry was carried out on a BD FACSCanto flow cytometry system and cell sorting was performed on a BD FACSJazz cell sorter at the Children’s Hospital of Philadelphia flow cytometry core.
CRISPR-Cas9 screen
The protein domain–based sgRNA library was packaged in lentivirus. Viral titer was determined by serial dilution. HUDEP-2-Cas9 cells were transduced with the BTB domain and histone modification reader domain–containing proteins library at a low multiplicity of infection (0.3) such that ∼30% of cells were green fluorescent protein positive (GFP+) (multiplicity of infection for these studies was ∼0.25). Then, 12 million cells were infected to yield 1000× coverage of the sgRNA library in the GFP+ population. GFP+ cells were then sorted by FACS on day 2 after infection.
GFP+ cells were then expanded in HUDEP-2 media for an additional 6 days (total of 8 days postinfection). On day 8 after infection, cells were transferred to differentiation media for 7 days. After differentiation, cells were stained for HbF as indicated above, and sorted into HbF-high (top 10%) and HbF-low (bottom 10%) populations as previously described.16
Genomic DNA was isolated from these samples by phenol-chloroform extraction according to a standard protocol. sgRNAs were amplified with Phusion Flash High Fidelity Master Mix Polymerase with the LRG F2/R2 primer pair (supplemental Table 6). Reactions were performed with 23 cycles of amplification with 100 ng of genomic DNA as template, and 50 parallel reactions were performed to maintain sgRNA library representation. PCR reactions were then pooled for each sample and purified with a QIAGEN PCR purification kit. PCR products were subjected to Illumina MiSeq library construction and sequencing. First, PCR products (0.5-1 μg pooled PCR product) were end repaired with T4 DNA polymerase, DNA polymerase I, and T4 polynucleotide kinase. Then, an A-overhang was added to the end-repaired amplicons using Klenow DNA Pol Exo-. The A-overhang DNA fragment was ligated with diversity-increased barcoded Illumina adaptors followed by 7 precapture PCR cycles with primer pair PE-5/PE-7 (supplemental Table 6). Samples were then purified with the QIAquick PCR purification kit. sgRNA library concentrations were quantified on a 2100 Bioanalyzer. The barcoded libraries were pooled at an equal molar ratio and subjected to massively parallel sequencing through a MiSeq instrument using 75-bp paired-end sequencing.
The sequencing data were de-barcoded, trimmed to contain only the sgRNA sequence, and subsequently mapped to the reference sgRNA library without allowing any mismatches. The read counts were calculated for each individual sgRNA and normalized to total read counts. Normalized read counts of sgRNAs in HbF-high and HbF-low populations were log2 transformed in R software, and graphical representation was performed by using the R-package ggplot2. For details, see supplemental data.
Results
Protein domain-focused CRISPR-Cas9 screen identifies SPOP as a potential γ-globin repressor
We have previously shown that sgRNAs targeting functional protein domains generated phenotype-altering mutations at a higher rate than sgRNAs designed to generate null alleles.13 To identify additional potential γ-globin repressors, we designed a library of sgRNAs targeting approximately 600 proteins covering most of the BTB domain and histone modification reader domain–containing proteins (6 sgRNAs per domain). This library also included 6 sgRNAs for LRF as positive controls and 50 nontargeting sgRNAs as negative controls. This sgRNA library was cloned into the LRG 2.1T lentiviral vector that we had previously optimized, and then introduced into HUDEP-2 cells12 stably expressing Cas9 (Figure 1A). We stained cells using an anti-HbF antibody, sorted the top 10% and bottom 10% of HbF-expressing cells by FACS, and deep-sequenced the sgRNAs from each population (Figure 1B). As expected, nontargeting sgRNAs were evenly distributed across the HbF-high and HbF-low populations, and all 6 sgRNAs of LRF were enriched in the HbF-high population (Figure 1C). Moreover, the sgRNAs targeting NuRD complex subunits (CHD4, MBD2, and MTA2) and DNMT1, which were previously reported to be required for γ-globin silencing,11 were all enriched in the HbF-high portion (supplemental Figure 1), which validated the screen. Interestingly, 5 of 6 sgRNAs targeting SPOP were significantly enriched in the HbF-high population, suggesting that it might function as a repressor of γ-globin (Figure 1C). To our knowledge, a role for SPOP in γ-globin gene regulation has not been previously reported.
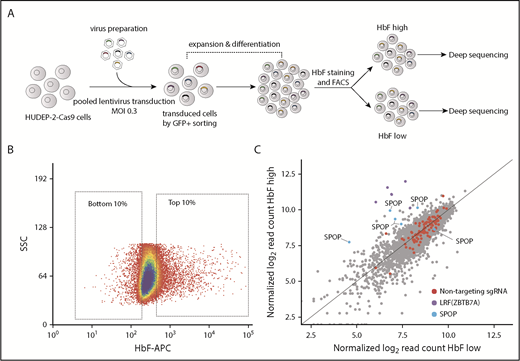
Protein-domain based CRISPR-Cas9 screen identifies SPOP as a novel fetal globin repressor. (A) Screening strategy. Cas9-expressing HUDEP-2 cells were transduced with a BTB domain and histone modification reader domain-targeting sgRNA library (6 sgRNAs per domain). Edited HUDEP-2 cells were then induced to differentiate for 7 days. Differentiated cells were stained by allophycocyanin (APC)-conjugated anti-HbF and sorted into HbF-high and HbF-low cells by FACS. Enriched sgRNAs were identified by deep sequencing. (B) HbF FACS gating strategy for HbF-high and HbF-low cell populations. (C) Scatter plot of HbF-high (y-axis) and HbF-low (x-axis) populations as log2 transformed normalized read counts; each dot represents an sgRNA. SSC, side scatter.
Protein-domain based CRISPR-Cas9 screen identifies SPOP as a novel fetal globin repressor. (A) Screening strategy. Cas9-expressing HUDEP-2 cells were transduced with a BTB domain and histone modification reader domain-targeting sgRNA library (6 sgRNAs per domain). Edited HUDEP-2 cells were then induced to differentiate for 7 days. Differentiated cells were stained by allophycocyanin (APC)-conjugated anti-HbF and sorted into HbF-high and HbF-low cells by FACS. Enriched sgRNAs were identified by deep sequencing. (B) HbF FACS gating strategy for HbF-high and HbF-low cell populations. (C) Scatter plot of HbF-high (y-axis) and HbF-low (x-axis) populations as log2 transformed normalized read counts; each dot represents an sgRNA. SSC, side scatter.
SPOP is one of the substrate adaptors of the CUL3 ubiquitin ligase complex that mediates ubiquitination of target proteins and, in most cases, causes protein degradation.14,17 SPOP binds to its substrates by its N-terminal meprin and traf homology (MATH) domain and interacts with CUL3 via its C-terminal BTB domain18 (Figure 2A). SPOP is widely expressed across human tissues (Genotype-Tissue Expression database). In blood, SPOP is highly enriched in erythroid cells (BloodSpot database), and its messenger RNA (mRNA) expression levels are comparable between fetal and adult erythroblasts on the basis of recently published transcriptome studies.19,20
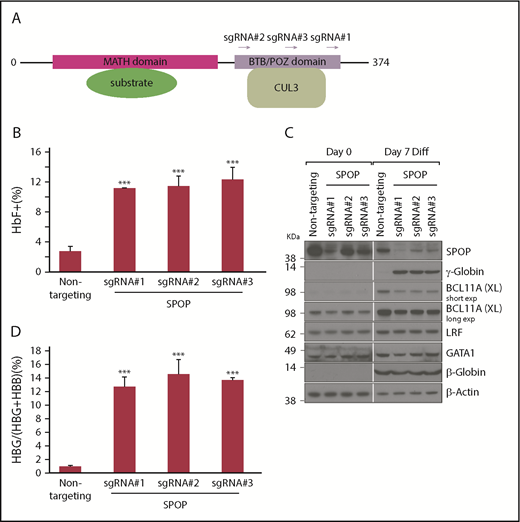
SPOP depletion increases γ-globin protein and mRNA levels in HUDEP-2 cells. (A) SPOP protein domain structure and position of 3 SPOP sgRNAs within the BTB domain. (B) HbF flow cytometry of differentiated cells transduced with indicated sgRNAs. Data are mean ± standard deviation (SD) (n = 2). (C) Immunoblot analysis with indicated antibodies using whole-cell lysates from cell pools transduced with sgRNAs. (D) γ-Globin mRNA was measured by RT-qPCR; data are plotted as percentage of γ-globin over γ-globin + β-globin gene levels. Data are mean ± SD of at least 2 biological replicates. Diff, differentiation; exp, exposure. ***P < .01 from unpaired Student t tests. BCL11A (XL), full length BCL11A.
SPOP depletion increases γ-globin protein and mRNA levels in HUDEP-2 cells. (A) SPOP protein domain structure and position of 3 SPOP sgRNAs within the BTB domain. (B) HbF flow cytometry of differentiated cells transduced with indicated sgRNAs. Data are mean ± standard deviation (SD) (n = 2). (C) Immunoblot analysis with indicated antibodies using whole-cell lysates from cell pools transduced with sgRNAs. (D) γ-Globin mRNA was measured by RT-qPCR; data are plotted as percentage of γ-globin over γ-globin + β-globin gene levels. Data are mean ± SD of at least 2 biological replicates. Diff, differentiation; exp, exposure. ***P < .01 from unpaired Student t tests. BCL11A (XL), full length BCL11A.
Depletion of SPOP increases γ-globin levels in HUDEP-2 cells
To validate the results from the screen, we stably introduced 3 of the 6 sgRNAs against the SPOP BTB domain into HUDEP-2-Cas9 cells and allowed the cells to undergo differentiation. All 3 SPOP sgRNAs significantly increased the fraction of HbF-expressing cells (Figure 2B; supplemental Figure 2). Western blots showed that (1) SPOP protein levels declined during differentiation; (2) GATA1 protein levels were unchanged upon SPOP depletion, suggesting SPOP is not required for normal cell maturation; (3) γ-globin protein levels were significantly increased upon SPOP depletion, consistent with the HbF flow cytometry results; and (4) LRF was unchanged, but BCL11A protein levels were modestly decreased (Figure 2C; see below).
When measuring the transcriptional effects of SPOP perturbation, we observed robust increases in the γ-globin mRNA and pre-mRNA levels, indicating that SPOP impinges on transcriptional regulation of γ-globin. SPOP loss increased ε-globin mRNA levels approximately twofold, but β-globin mRNA and pre-mRNA levels were similar to those of controls (Figure 2D; supplemental Figure 3A-B). Importantly, there were no notable changes in α-globin, GATA1 and BAND3 mRNA levels (erythroid differentiation markers) (supplemental Figure 3C), and cell morphology (supplemental Figure 4), suggesting that SPOP loss did not significantly impair erythroid maturation. We also observed varying levels of HbF induction in SPOP-depleted clonal HUDEP-2 lines (data not shown). In sum, in the context of HUDEP-2 cells, SPOP suppresses γ-globin gene expression.
Effects of SPOP inhibition on the erythroid transcriptome and proteome
To study the impact of SPOP depletion globally, we performed RNA-seq using HUDEP-2 pools independently derived from 3 SPOP sgRNAs and found that global gene expression patterns were highly similar between control and SPOP-depleted cells (Pearson correlation coefficient above 0.95). γ-Globin genes (HBG1and HBG2) seemed to be the most strongly and significantly increased in differentiated cells (Figure 3A). Consistent with our qPCR results, α-globin, β-globin, GATA1, ALAS2, and BAND3 genes were comparable (Figure 3A; supplemental Figure 3B-C). Of note, BCL11A mRNA levels were unchanged (supplemental Figure 3D).
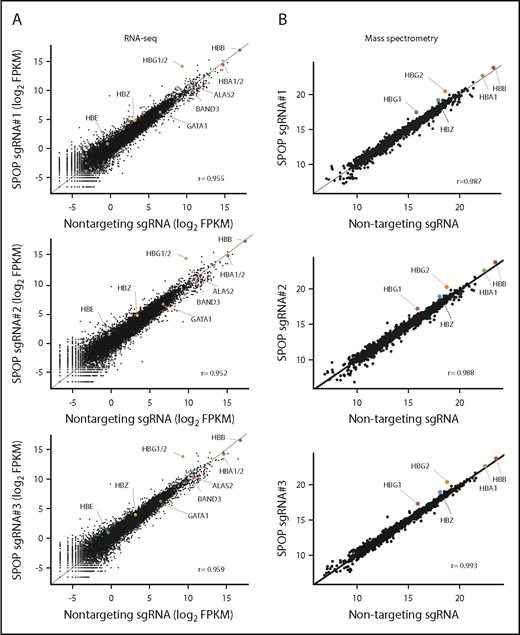
SPOP depletion specifically and strongly induces γ-globin in HUDEP-2 cells. (A) RNA-seq analysis of cell pools with SPOP sgRNA#1, -#2, and -#3. Each dot represents an individual gene. Each gene is depicted according to FPKM (fragments per kilobase per million) value. HBG1/2 indicates the combined levels of HBG1 and HBG2. (B) Scatter plots showing the results of mass spectrometry analysis of cell pools with SPOP sgRNA#1, -#2, and -#3 using whole-cell lysates. Data represent log2 protein abundances. Protein abundances were quantified by tandem mass tag–labeled mass spectrometry. Each dot represents a protein.
SPOP depletion specifically and strongly induces γ-globin in HUDEP-2 cells. (A) RNA-seq analysis of cell pools with SPOP sgRNA#1, -#2, and -#3. Each dot represents an individual gene. Each gene is depicted according to FPKM (fragments per kilobase per million) value. HBG1/2 indicates the combined levels of HBG1 and HBG2. (B) Scatter plots showing the results of mass spectrometry analysis of cell pools with SPOP sgRNA#1, -#2, and -#3 using whole-cell lysates. Data represent log2 protein abundances. Protein abundances were quantified by tandem mass tag–labeled mass spectrometry. Each dot represents a protein.
Given that SPOP functions as a substrate adaptor of CUL3 E3 ligase complex, SPOP loss might lead to increased protein levels of its substrates. We performed mass spectrometry experiments to measure protein abundances in whole-cell lysates and in nuclear extracts from SPOP-depleted cell pools. Among ∼2290 quantified proteins from whole-cell lysates, relatively few changes in protein levels were observed except that γ-globin was strongly increased upon SPOP depletion (supplemental Table 1). In addition, given that SPOP loss increases transcription of γ-globin (supplemental Figure 3), we repeated the mass spectrometry analysis in nuclear extracts with the goal of identifying nuclear factors directly or indirectly controlled by SPOP. Again, among 2203 quantified proteins, relatively few displayed altered levels (supplemental Table 2). Among the most changed proteins was GLYR1, which we also identified as a new SPOP substrate (see “Discussion”). However, α-globin and β-globin abundance changed only a little or not at all upon SPOP depletion, consistent with the RNA-seq results (Figure 3; supplemental Figure 5). Because of technical limitations, we could not quantify all expressed proteins. Hence, changes in low-abundance proteins might have escaped detection. Nevertheless, globally, SPOP loss induced γ-globin expression accompanied by relatively few changes in the transcriptome and proteome.
Depletion of SPOP increases γ-globin levels in primary erythroid CD34+ cells
We tested the repressive role of SPOP on HbF in a primary human CD34+ cell–derived culture system (Figure 4A). SPOP depletion by 2 independent shRNAs significantly increased HbF+ cell populations (Figure 4B; supplemental Figure 6; note donor-to-donor variation), γ-globin protein levels as shown by western blot and high-performance liquid chromatography (Figure 4C-D), and γ-globin transcript levels by RT-qPCR (Figure 4E). Similar to HUDEP-2 cells, GATA1 and LRF levels were unchanged but BCL11A was reduced approximately twofold (see below). RNA-seq analysis of SPOP-depleted cells showed that global gene expression patterns were highly correlated between control and SPOP-depleted cells; γ-globin transcripts were increased the most, with no significant changes in α-globin and β-globin mRNAs; GATA1, ALAS2, and BAND3 genes were mostly unchanged; and BCL11A and LRF transcript levels were comparable (Figure 4F; supplemental Figure 7; supplemental Table 3). We further validated these results by RT-qPCR (supplemental Figure 8). Importantly, SPOP depletion did not seem to impair erythroid maturation, as suggested by the similar transcript levels of the differentiation makers, cell surface makers CD71 and CD235a, and cell morphology (supplemental Figure 9). Of note, except for γ-globin genes (HBG1 and HBG2), RNA-seq and mass spectrometry data (supplemental Tables 1-3) showed no overlap among the most changed transcripts and proteins. Because SPOP controls protein turnover presumably without affecting their mRNA levels, we believe that mRNA changes might be indirect. Furthermore, expression changes for most transcripts and proteins were modest, and RNA-seq is more sensitive than mass spectrometry.
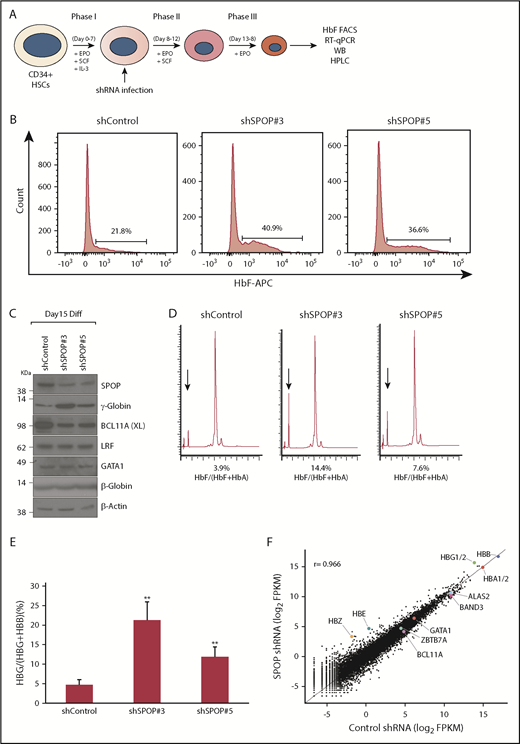
SPOP depletion increases γ-globin in primary erythroid CD34+cells. (A) Schematic diagram of experimental design. (B) Representative HbF flow cytometry of CD34+ erythroid cells at day 14 of differentiation. (C) Western blot (WB) analysis with indicated antibodies for differentiated CD34+ cells infected with scrambled or SPOP shRNAs virus. (D) High-performance liquid chromatography (HPLC) analysis of cells expressing indicated shRNAs at days 15 to 16 of differentiation. Arrow indicates HbF. (E) γ-Globin mRNA was measured by RT-qPCR; data are plotted as percentage of γ-globin over γ-globin + β-globin. Data are mean ± SD of 3 independent donors. (F) RNA-seq analysis for CD34+ cells at day 14 of differentiation. HBG1/2 indicates the combined levels of HBG1 and HBG2. The r value denotes Pearson correlation coefficient. Log2 FPKM values were averaged from 2 independent donors. EPO, erythropoietin; HbA, adult hemoglobin, HSC, hematopoietic stem cell; IL-3, interleukin-3; SCF, stem cell factor. **P < .05, unpaired Student t tests.
SPOP depletion increases γ-globin in primary erythroid CD34+cells. (A) Schematic diagram of experimental design. (B) Representative HbF flow cytometry of CD34+ erythroid cells at day 14 of differentiation. (C) Western blot (WB) analysis with indicated antibodies for differentiated CD34+ cells infected with scrambled or SPOP shRNAs virus. (D) High-performance liquid chromatography (HPLC) analysis of cells expressing indicated shRNAs at days 15 to 16 of differentiation. Arrow indicates HbF. (E) γ-Globin mRNA was measured by RT-qPCR; data are plotted as percentage of γ-globin over γ-globin + β-globin. Data are mean ± SD of 3 independent donors. (F) RNA-seq analysis for CD34+ cells at day 14 of differentiation. HBG1/2 indicates the combined levels of HBG1 and HBG2. The r value denotes Pearson correlation coefficient. Log2 FPKM values were averaged from 2 independent donors. EPO, erythropoietin; HbA, adult hemoglobin, HSC, hematopoietic stem cell; IL-3, interleukin-3; SCF, stem cell factor. **P < .05, unpaired Student t tests.
Increased levels of HbF reduce the propensity of SCD erythroid cells to undergo sickling (for review, see Akinsheye et al21 ).1 We depleted SPOP in CD34+-derived erythroid cells from SCD patients. Inhibition of SPOP increased γ-globin to levels similar to those found in cells from healthy donors (supplemental Figure 10A-B; compare with Figure 4). Cells infected with SPOP shRNAs displayed less sickling than controls when grown under low oxygen conditions (supplemental Figure 10C-D), and the effect size was commensurate with the degree of SPOP depletion.
SPOP-CUL3 complex represses γ-globin transcription independent of BCL11A
Because CUL3 is the core component of the SPOP-CUL3 E3 ligase complex,14 we asked whether CUL3 is involved in the repression of HbF. Indeed, depletion of CUL3 with sgRNAs targeting its cullin domain increased γ-globin production without affecting α-globin and β-globin levels, and had no significant effects on GATA1, BCL11A, and LRF expression (Figure 5A; supplemental Figures 11 and 12). SPOP protein, but not mRNA, was increased upon CUL3 depletion (Figure 5A; supplemental Figure 12A), consistent with previous studies showing that SPOP-CUL3 itself can be ubiquitylated.22,23 This upregulation of SPOP in partially CUL3-depleted cells might explain the reduced effect size on γ-globin induction when compared with SPOP depletion. CUL3 is known to regulate cell cycle progression by targeting cyclin E.24 Indeed, CUL3 depletion slowed cell growth but did not ostensibly impair cell differentiation, as evidenced by normal levels of GATA1, α-globin, and BAND3 (Figure 5A; supplemental Figure 12D). These data also suggest that SPOP regulates γ-globin through substrates of the CUL3-ubiquitin proteasome pathway.
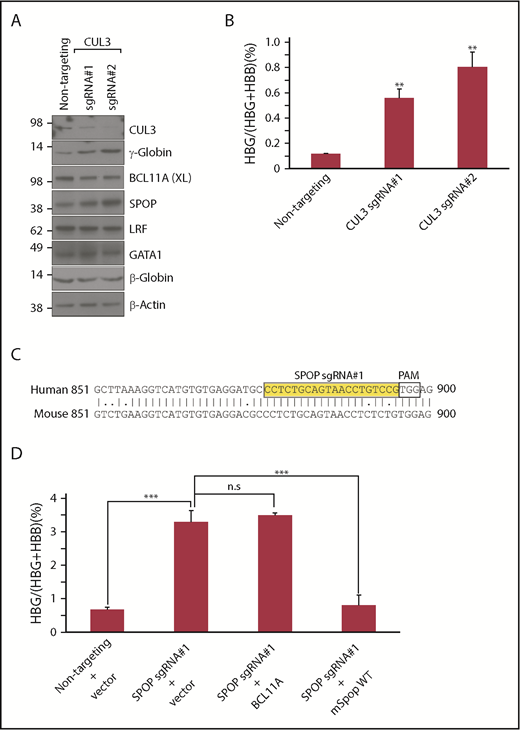
SPOP-CUL3 complex represses γ-globin independent of BCL11A. (A) Immunoblot analysis with indicated antibodies of differentiated HUDEP-2 cells expressing CUL3 sgRNAs. (B) γ-Globin mRNA was measured by RT-qPCR; data are plotted as percentage of γ-globin over γ-globin + β-globin mRNAs. Data are mean ± SD of 2 biological replicates. (C) Alignment of human and mouse SPOP DNA sequences. Yellow indicates SPOP sgRNA#1 sequence. Two mismatched nucleotides upstream of protospacer adjacent motif (PAM) in mSpop cDNA. (D) γ-Globin mRNA was measured by RT-qPCR; data are plotted as percentage of γ-globin over γ-globin + β-globin mRNAs. Data are mean ± SD of 2 biological replicates. **P < .05; ***P < .01, unpaired Student t tests. n.s., not significant.
SPOP-CUL3 complex represses γ-globin independent of BCL11A. (A) Immunoblot analysis with indicated antibodies of differentiated HUDEP-2 cells expressing CUL3 sgRNAs. (B) γ-Globin mRNA was measured by RT-qPCR; data are plotted as percentage of γ-globin over γ-globin + β-globin mRNAs. Data are mean ± SD of 2 biological replicates. (C) Alignment of human and mouse SPOP DNA sequences. Yellow indicates SPOP sgRNA#1 sequence. Two mismatched nucleotides upstream of protospacer adjacent motif (PAM) in mSpop cDNA. (D) γ-Globin mRNA was measured by RT-qPCR; data are plotted as percentage of γ-globin over γ-globin + β-globin mRNAs. Data are mean ± SD of 2 biological replicates. **P < .05; ***P < .01, unpaired Student t tests. n.s., not significant.
Under SPOP-deficient conditions, BCL11A was decreased at the protein level, but not the mRNA level, in both HUDEP-2 cells and primary erythroid CD34+ cells (Figures 2C and 4C), possibly explaining some of the effects on γ-globin regulation. To test this, we performed rescue experiments by re-introducing either BCL11A cDNA or mSpop cDNA, which contains 2 mismatched nucleotides upstream of the protospacer adjacent motif sequence of SPOP gRNA#1 into SPOP-depleted cells (Figure 5C). Surprisingly, BCL11A failed to restore γ-globin repression, whereas mSpop cDNA lowered γ-globin to basal protein and mRNA levels (Figure 5D; supplemental Figure 13). In contrast, BCL11A was able to restore γ-globin repression in BCL11A-deficient cells (supplemental Figure 13D-E). Moreover, if SPOP represses γ-globin mainly through BCL11A, SPOP depletion should not further increase γ-globin levels in BCL11A-deficient cells. However, loss of SPOP in BCL11A-depleted cells further increased γ-globin levels (supplemental Figure 14), suggesting that SPOP and BCL11A repress γ-globin transcription through distinct pathways. Finally, given that SPOP functions as a CUL3 E3 ligase adaptor, if BCL11A were one of its direct substrates, depletion of SPOP would be expected to increase, but not decrease, BCL11A protein levels, and overexpression of WT SPOP, but not derivatives unable to bind substrates,22 should increase the ubiquitination levels of BCL11A. However, in preliminary experiments, overexpression of WT SPOP or mutant versions deficient for CUL3 or substrate binding did not alter ubiquitination of BCL11A in cellular assays (data not shown). Taken together, although SPOP depletion moderately alters BCL11A protein amounts, these results suggest that BCL11A is not a direct downstream effector of the SPOP-CUL3 complex during the repression of HbF.
Overexpression of a dominant negative-acting SPOP mutant strongly increases γ-globin levels
Given its role as an E3 ligase that targets proteins to the proteasome, we suspected that SPOP-CUL3 represses transcription of the γ-globin genes by promoting the ubiquitylation and degradation of proteins that might function as transcriptional activators of γ-globin. To test this idea, we overexpressed a SPOP mutant in which Tyr87 was replaced by Asn (Y87N) in the MATH domain, which disrupts SPOP-substrate interactions.18 Indeed, overexpression of SPOP (Y87N) strongly increased γ-globin levels and to some extent also ε-globin levels without significantly affecting α-globin and β-globin production and with no measurable effect on BCL11A or LRF levels (Figure 6; supplemental Figure 15). In contrast, overexpression of wild-type SPOP had no effect on γ-globin, α-globin, and β-globin levels (Figure 6D; supplemental Figure 15). Importantly, overexpression of SPOP (Y87N) had no significant detrimental effect on cell maturation (Figure 6C). In concert, our data suggest that the SPOP-CUL3 complex likely functions by promoting the turnover of proteins involved in γ-globin transcriptional regulation.
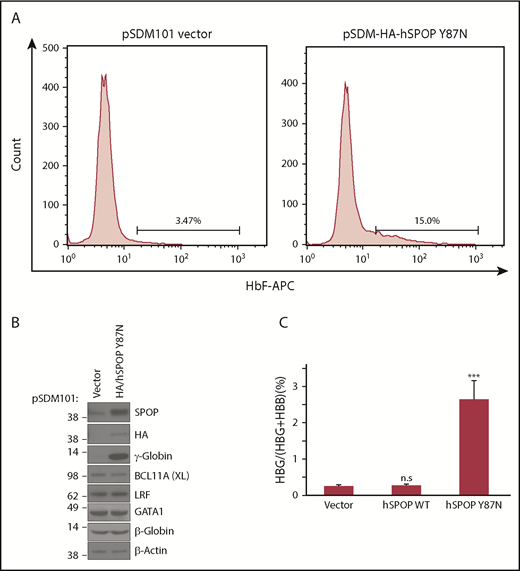
Overexpression of SPOP mutant increases γ-globin. (A) HbF flow cytometry of differentiated HUDEP-2 cells expressing empty vector (left) or the SPOPY87N mutant. (B) Western blot analysis with indicated antibodies for differentiated HUDEP-2 cells expressing empty vector or SPOP mutant. (C) γ-Globin mRNA was measured by RT-qPCR; data are plotted as percentage of γ-globin over γ-globin + β-globin. Data are mean ± SD of 2 biological replicates. ***P < .01, unpaired Student t tests.
Overexpression of SPOP mutant increases γ-globin. (A) HbF flow cytometry of differentiated HUDEP-2 cells expressing empty vector (left) or the SPOPY87N mutant. (B) Western blot analysis with indicated antibodies for differentiated HUDEP-2 cells expressing empty vector or SPOP mutant. (C) γ-Globin mRNA was measured by RT-qPCR; data are plotted as percentage of γ-globin over γ-globin + β-globin. Data are mean ± SD of 2 biological replicates. ***P < .01, unpaired Student t tests.
Depletion of SPOP cooperates with pomalidomide and hydroxyurea during HbF induction
We considered whether activation of γ-globin expression by SPOP depletion could be amplified by pharmacologic agents that function via distinct pathways. Pomalidomide can induce HbF expression,25,26 and although the mechanism of action remains unclear, it does cause a reduction in BCL11A mRNA levels.15 Therefore, as proof of concept, we tested whether pomalidomide might amplify the effects of SPOP depletion in HUDEP-2 cells. This was indeed the case, because the combined treatment increased the fraction of HbF+ cells and increased γ-globin transcription more strongly than either treatment alone (Figure 7A-B; supplemental Figure 16A). Moreover, BCL11A transcript levels were unchanged upon SPOP deletion but were significantly decreased upon treatment with pomalidomide (Figure 7C). In addition, although to a lesser extent, hydroxyurea, the only US Food and Drug Administration–approved drug for increasing HbF levels for patients with SCDs, also amplified the effects of SPOP depletion in HUDEP-2 cells (supplemental Figure 17). Of note, these conditions did not seem to impair cell differentiation (supplemental Figures 16B-C and 17B). Together these data suggest that SPOP inhibition in combination with other treatments might offer a therapeutic strategy for HbF induction in patients with hemoglobinopathies.

SPOP depletion strongly enhances the effect on γ-globin induction by pomalidomide treatment. (A) HbF flow cytometry of indicated HUDEP-2 sgRNAs cell pools treated with or without pomalidomide (Pom) at day 6 of differentiation. (B) γ-Globin mRNA was measured by RT-qPCR; data are plotted as percentage of γ-globin over γ-globin + β-globin. Data are mean ± SD of 2 independent experiments. (C) BCL11A mRNA levels measured by RT-qPCR. Glyceraldehyde-3-phosphate dehydrogenase (GAPDH) was used for normalization. Data are mean ± SD of 2 biological replicates. **P < .05; ***P < .01, unpaired Student t tests.
SPOP depletion strongly enhances the effect on γ-globin induction by pomalidomide treatment. (A) HbF flow cytometry of indicated HUDEP-2 sgRNAs cell pools treated with or without pomalidomide (Pom) at day 6 of differentiation. (B) γ-Globin mRNA was measured by RT-qPCR; data are plotted as percentage of γ-globin over γ-globin + β-globin. Data are mean ± SD of 2 independent experiments. (C) BCL11A mRNA levels measured by RT-qPCR. Glyceraldehyde-3-phosphate dehydrogenase (GAPDH) was used for normalization. Data are mean ± SD of 2 biological replicates. **P < .05; ***P < .01, unpaired Student t tests.
Discussion
Here we identified SPOP, a substrate adaptor of the CUL3 ubiquitin E3 ligase complex, as a novel regulator of HbF expression. Reduction in SPOP levels increased HbF production in HUDEP-2 and primary human cell cultures without substantial disruption of the cellular transcriptome and proteome. Mechanistically, we demonstrated that the repressive role of SPOP on γ-globin is dependent on the CUL3 ubiquitin ligase complex. Moreover, ectopic expression of a dominant-negative form of SPOP (Y87N) unable to bind to its substrates substantially induced HbF production. Finally, as proof of concept, we found that combining SPOP depletion with pomalidomide or hydroxyurea exposure induced higher HbF production than either treatment alone.
In spite of significant efforts, the SPOP substrates relevant to γ-globin regulation remain unknown. We performed immunoprecipitation of an SPOP version defective for CUL3 binding (L193P) followed by mass spectrometry and found several SPOP partners (supplemental Table 8). The SPOP binding consensus motif (φ-π-S-S/T-S/T [φ, nonpolar; π, polar]) has been characterized.18 Among these partners, CAPRIN1, NUP153, and GLYR1 contain at least one such SPOP binding motif. We further tested these in addition to previously described SPOP substrates with functions in the nucleus. These include BRD2, BRD4, DEK, TRIM24, SETD2, and ATF2 (supplemental Table 9). In particular, ATF2 has been shown to be capable of activating γ-globin.27 Moreover, NRF2 has been reported to be regulated by the CUL3 ubiquitin ligase complex28 and might be a transcriptional activator of γ-globin.29 We first tested whether SPOP regulates the amounts of any of these proteins in erythroid cells. Only GLYR1, TRIM24, and SETD2 protein levels were strongly upregulated upon SPOP loss or SPOP Y87N overexpression, suggesting cell type–specific regulation of SPOP substrates (supplemental Figure 18A-B). We further tested whether upregulation of GLYR1, TRIM24, or SETD2 accounts for the induction of γ-globin genes. Depleting each of them individually in SPOP knockout cells failed to restore the silencing of HbF as measured by flow cytometry (supplemental Figures 18C and 19), suggesting that an as yet unidentified substrate or multiple substrates convey SPOP-mediated γ-globin induction in these cells.
CUL3 interacts with BTB/POZ domain proteins such as SPOP. Although other BTB domain–containing substrate adaptors of the CUL3 E3 ligase were also included in our sgRNA library, SPOP seems to be the only one involved in HbF repression. This reflects a selective function of SPOP and is consistent with general target selectivity of CUL3 E3 ligases via different BTB domain–containing substrate adaptors.14 Induction of HbF upon CUL3 depletion was less pronounced compared with SPOP loss, which may in part be the result of the compensating effects of increased SPOP protein levels. Moreover, in HUDEP-2 cells, CUL3 depletion impaired cell proliferation, possibly as a result of deregulation of cyclin E,24 but SPOP depletion did not have this effect, indicating that CUL3 targets cyclin E through another substrate-specific adaptor.
Given the central role of BCL11A in HbF silencing, it seemed likely that the moderate decrease of BCL11A in SPOP-depleted cells might have contributed to HbF induction. However, restoration of BCL11A levels failed to reinstate γ-globin silencing. Hence, SPOP likely exerts its function via a different mechanism. This is also supported by the observation that depletion of both SPOP and BCL11A induced HbF to higher levels than either treatment alone. Because ubiquitination can in some cases increase protein stability or alter protein activity, we examined whether SPOP ubiquitinates BCL11A and observed no changes upon SPOP overexpression, again arguing against a direct functional link between SPOP and BCL11A. Regardless, the role of SPOP in HbF silencing very likely involves its role as an E3 ligase, because forced expression of SPOP (Y87N) but not SPOP WT leads to strong HbF induction. SPOP (Y87N) expression induces γ-globin to levels similar to those observed upon SPOP depletion, but in contrast to the latter condition, BCL11A levels remained unchanged. The reason for this discrepancy is unclear, but these results are nevertheless consistent with SPOP functioning via the CUL3 E3 ligase complex and support a mechanism that does not involve BCL11A.
One means of increasing the therapeutic index is to combine therapies that have an impact on different cellular pathways. SPOP depletion had no effect on BCL11A mRNA levels, but because pomalidomide is known to decrease production of BCL11 mRNA,15 we tested possible cooperativity of SPOP and pomalidomide during HbF induction. The combination of SPOP depletion and pomalidomide treatment induced HbF production to levels much higher than either treatment alone. Similarly, we observed cooperativity when combining SPOP depletion with hydroxyurea treatment, although the underlying mechanism for cooperativity is unknown. Together, these results support the idea that SPOP inhibition might be combined with other treatments to augment effect size and lower potential adverse effects through dose reduction.
The BTB domain is a druggable structure.30 Small molecules designed to inhibit the SPOP-substrate protein interactions have recently been reported.31 Although these molecules seem to mainly target cytoplasmically mislocalized SPOP, this finding indicates that SPOP-substrate protein interactions can be a potential therapeutic target for designing small molecule inhibitors. Importantly, strong HbF induction achieved through disrupting SPOP-substrate interactions by overexpressing SPOP (Y87N) mutant further supports this possibility. In summary, SPOP functions as a novel regulator of HbF and offers a potential therapeutic target for monotherapy or combination therapies for β-hemoglobinopathies.
All plasmids and reagents described in this study are available upon request.
The full-text version of this article contains a data supplement.
Acknowledgments
The authors thank laboratory members for helpful discussions, and Dahmane Ouazia, Luca Busino, Jian Xu, and Doris A. Stoffers for sharing reagents and advice.
This work was supported by the National Institutes of Health, National Institute of General Medical Sciences (T32GM008216) (J.D.G.) and R01-GM110174 (B.A.G.); National Institute of Diabetes and Digestive and Kidney Diseases (1F30DK107055-01 [J.D.G.], R56DK065806 [R.C.H.], and 5R37DK058044 [G.A.B.]); National Human Genome Research Institute (U54HG006998) (R.C.H.); National Heart, Lung, and Blood Institute (5R01HL119479) (G.A.B.); National Institute of Allergy and Infectious Diseases (R01-AI118891) (B.A.G.); US Department of Defense grant W81XWH-113-1-0426 (B.A.G.); and Cold Spring Harbor Laboratory (J.S.). The authors are very grateful for the generous support by the DiGaetano family.
Authorship
Contribution: X.L., J.S., and G.A.B. conceived the study, designed experiments, and wrote the manuscript; X.L., E.K., C.A.K., B.G., J.B., J.S., and G.A.B. analyzed the data; X.L., E.K., P.H., J.D.G., S.A.P., S.K.B., O.A., H.W., C.A.K., B.A.G., J.B., and E.R.D., performed experiments; and all authors edited the manuscript.
Conflict-of-interest disclosure: X.L., J.D.G., J.S., and G.A.B. are contributors to a patent filed on behalf of The Children’s Hospital of Philadelphia. The authors declare no competing financial interests.
Correspondence: Gerd A. Blobel, The Children’s Hospital of Philadelphia, 3615 Civic Center Blvd, ARC 316H, Philadelphia, PA 19104; e-mail: blobel@email.chop.edu.

