Abstract
Little information is available on the evolution of erythropoiesis after interruption of recombinant human erythropoietin (rHuEpo) therapy. Iron-overloaded rats received 20 daily injections of rHuEpo. During treatment, reticulocytes, soluble transferrin receptor (sTfR), and hematocrit increased progressively. This was accompanied by a substantial expansion of spleen erythropoiesis but a decrease in the bone marrow. Five weeks after treatment, rats developed a significant degree of aregenerative anemia. Erythropoietic activity, as assessed by reticulocytes, sTfR, erythroid cellularity, iron incorporation into heme, and the number of erythroid colonies, was severely depressed 3 weeks after cessation of rHuEpo. This was followed by regeneration of erythroblasts and reticulocytes at weeks 6 to 7 post-Epo, but erythroid progenitors recovered only partially by that time. The anemia was definitely corrected 2 months after cessation of rHuEpo treatment. Serum Epo levels remained elevated for several weeks, but the sensitivity of marrow erythroid precursors to Epo was preserved. No rat antibodies to rHuEpo were detected, and serum from post-Epo animals did not exert any inhibitory activity on erythropoiesis. In conclusion, after cessation of intensive rHuEpo therapy, there was a strong inhibition of erythropoietic activity with secondary anemia followed by late recovery. This was not due to antibodies or other soluble inhibitory factors, a defect in endogenous Epo production, or a loss of sensitivity to Epo. This may rather represent intrinsic erythroid marrow exhaustion, mostly at the level of erythroid progenitors but also at later stages of erythropoiesis.
Introduction
Recombinant human erythropoietin (rHuEpo) has been used extensively to treat the anemia of renal failure and is increasingly considered for use in other situations.1 In normal subjects, rHuEpo elicited a dose-dependent stimulation of erythropoiesis, resulting in elevated reticulocytes, soluble transferrin receptors (sTfRs), and hematocrit (Hct),2-5allowing for the collection of multiple red blood cell units.6,7 The magnitude of the erythropoietic response was similar in normal subjects, in patients with genetic hemochromatosis, and in patients with the anemia of chronic renal failure.8After cessation of treatment, one would expect a gradual return of all erythroid parameters to baseline levels. This has never been studied in normal subjects, except in the setting of surgery and/or autologous blood donation. However, it is obvious that inflammation, bleeding, and transfusions associated with surgery, as well as anemia and iron deficiency associated with phlebotomy will preclude any meaningful interpretation of posttreatment changes in terms of overall erythroid marrow capacity to produce red cells. Therefore, we designed a study in normal rats to examine the long-term evolution of erythropoiesis after stopping intensive treatment with rHuEpo. Surprisingly, we did not simply observe a gradual return to baseline, but rather a diphasic evolution of profound inhibition of erythropoiesis and anemia before appropriate marrow response to correct this anemia.
Material and methods
Animals and rHuEpo therapy
Male Wistar rats were obtained from Janssen (Beerse, Belgium) and raised at the University of Liège from the age of 3 weeks through the end of the experiment. They were fed standard food in powder form supplemented with 1% (wt/wt) carbonyl iron (Sigma Chemical, St Louis, MO) 6 days per week and normal granular food 1 day per week. Rats were aged 3.5 to 4 months at the time of the experiments. Some animals underwent splenectomy under general anesthesia with ether (Gifer Barbezat, Dicenes, France) followed by placement of autoclip mikron clips (Becton Dickinson Benelux, Erembodegem-Alst, Belgium) for 10 days. They were then left to stabilize for 30 days before the experiment, and only animals showing no sign of inflammation at that time were used. Other rats underwent the same procedure but without splenectomy (sham-operated). To examine the effect of polycythemia per se (without any exposure to rHuEpo), a group of 4 rats were transfused with 5 mL packed red cells for 3 consecutive days and then 2 mL every other day for 32 days so as to maintain their Hct around 65%. Donor animals were pretreated with 35 mg thiamphenicol daily for 4 days, and donor blood was washed thrice with saline to provide reticulocyte- and plasma-free red cells.
rHuEpo (Recormon) was kindly provided by Boehringer-Mannheim (Brussels, Belgium). Rats were injected daily with intravenous rHuEpo at a dose of 150 U/d for 20 days. Control animals received the same volume of normal saline. Blood samples were drawn from a tail vein under short ether anesthesia 3 times per week just before rHuEpo injections. Part of the blood was drawn on ACD formula A and part on heparin to be centrifuged to obtain plasma, which was frozen at −20°C until processing.
Serum preparation
Blood was collected by aortic puncture from control untreated animals as well as day 15 post-Epo animals and centrifuged 10 minutes at 400g. The serum was further centrifuged at 5000g for 20 minutes to eliminate platelets, sterilized by filtration through a 0.22-μm Millipore filter, and stored at −20°C. It was tested at 10% concentration in assays of hematopoietic progenitors and of iron incorporation into heme (see below).
Cell suspensions
Single cell suspensions were obtained from bone marrows (femur) and spleens of rats killed 0, 20, or 40 days after cessation of treatment with rHuEpo or control untreated rats. They were prepared in Iscove modified Dulbecco medium (IMDM; Bio-Whittaker Europe, Verviers, Belgium) containing 1% fetal bovine serum (Myoclone, Bio-Whittaker Europe). The bone marrow was flushed and aspirated through a 23-gauge and then a 25-gauge needle, and the spleen was crushed. Cell suspensions were then filtered through a nylon mesh to remove aggregates. Cells were counted in a Technicon H2 automatic cell counter, and total marrow or spleen cellularity was calculated. The proportions of erythroid and granulocytic lineage cells in the bone marrow and spleen were obtained by counting 200 cells after staining with May-Grümwald-Giemsa.
Progenitor assays
Spleen and marrow cell suspensions were treated with a NH4Cl solution (0.15 M NH4Cl, 1 mM KHCO3, 0.1 mM Na2 EDTA; pH 7.2-7.4) to lyse red blood cells. Colony-forming unit–erythrocyte (CFU-E), burst-forming unit, erythroid (BFU-E), colony-forming unit–granulocyte-macrophage (CFU-GM), and CFU-Mix were estimated in semisolid serum-free IMDM culture medium containing 0.9% methylcellulose (StemCell, Vancouver, Canada), 1% bovine serum albumin (BSA), 10 μg/mL bovine pancreatic insulin (StemCell), 200 μg/mL human iron-saturated transferrin (StemCell), 0.1 mM β-mercaptoethanol (Sigma Chemical), 2 mM L-glutamine (Life Technologies, Paisley, United Kingdom), 100 U/mL penicillin (Life Technologies), 10 mg/mL streptomycin (Life Technologies), 10 ng/mL recombinant murine interleukin 3 (IL-3; PeproTech, Northampton, United Kingdom), 10 ng/mL recombinant human IL-6 (Novartis, Basel, Switzerland), 50 ng/mL recombinant murine stem cell factor (PeproTech), and 2 U/mL rHuEpo (Boerhinger Mannheim). Either 3 or 4 rats were used for each condition, and assays were run in duplicates. Cells were incubated at 37°C in a humidified 5% CO2 atmosphere at a concentration of 1.5 × 10⁵/mL (bone marrow) or 3 × 10⁵/mL (spleen). CFU-Es were scored after 7 days and BFU-E, CFU-GM, and CFU-Mix after 14 days. The total number of progenitors in the femur and in the spleen were derived, and the total body count of each type of progenitor was calculated according to the following equation: (progenitor count in one femur × 13) + progenitor count in the spleen.
Incorporation of iron into heme
We used the method described by Krystal et al9 with slight modifications. Marrow cells (2 × 10⁶/mL) were incubated 24 hours at 37°C in serum-free IMDM containing 1% BSA, 10 μg/mL bovine pancreatic insulin, 200 μg/mL human iron-saturated transferrin, 0.1 mM β-mercaptoethanol, 2 mM L-glutamine, 100 U/mL penicillin, 10 mg/mL streptomycin, and 1% cholesterol-rich lipids (Sigma Chemical). Epo was added at various concentrations (0, 10, 25, 50, 100, 200, and 500 mU/mL), with each condition done in triplicate. Cells were washed twice in warm IMDM containing penicillin and streptomycin and centrifuged at 200g for 5 minutes at 25°C. The pellet was resuspended in 0.5 mL IMDM containing 50 μg/mL iron-free apotransferrin preincubated 1 hour at 37°C with 1 μCi/mL59Fe citrate (specific activity 10-60 mCi/mg iron; CIS Bio International, Gif-sur-Yvette, France). After incubating 3 hours at 37°C, cells were washed twice in RPMI 1640 (Bio-Whittaker). Heme was extracted by the butane-2-one method, as previously described.9 After transfer of 1.5 mL final supernatant and 20 mL aqueous scintillation liquid (Insta-gel plus, Packard Bioscience, Groningen, The Netherlands) to a scintillation vial, radioactivity was counted in a β-counter (Tri-Carb 1900TR, Packard, Brussels, Belgium).59Fe incorporation into heme was expressed as counts per minute per 2 × 10⁶ cells.
Miscellaneous laboratory analyses
Complete blood counts were measured on a Technicon H2 automatic cell counter (Tarrytown, New York, NY) with appropriate corrections for dilution by ACD. The percentage of reticulocytes was determined on a FACSCAN cytofluorometer (Becton Dickinson, San Jose, CA) after coloration with thiazole orange.10 Preliminary experiments showed that this automated method gave results similar to manual counting on blood smears colored with brilliant cresyl blue. Absolute reticulocyte counts were calculated. Plasma erythropoietin was measured by a commercially available radioimmunoassay (Incstar Corporation, Stillwater, MN). Plasma sTfR was measured as previously described with minor modifications.11 12 The presence of rat antibodies to rHuEpo in rat serum was assayed by M. Kelley (R.W. Johnson Pharmaceutical Research Institute, Raritan, NJ), using a validated in-house enzyme-linked immunosorbent assay.
Statistical methods
All results of in vivo experiments were calculated as percentages of a baseline value and expressed as mean ± standard deviation (M ± SD). Comparisons of baseline values with later measurements in the same animals were carried out by paired Studentt tests. Comparisons between groups of animals were carried out with Student t tests, with the Welsch correction in case of unequal variances. Most statistical analyses were carried out with the Excel 5.0 (Microsoft Corp, Redmond, WA) or Prism 2.0 (GraphPad Software Inc, San Diego, CA) software packages.
Results
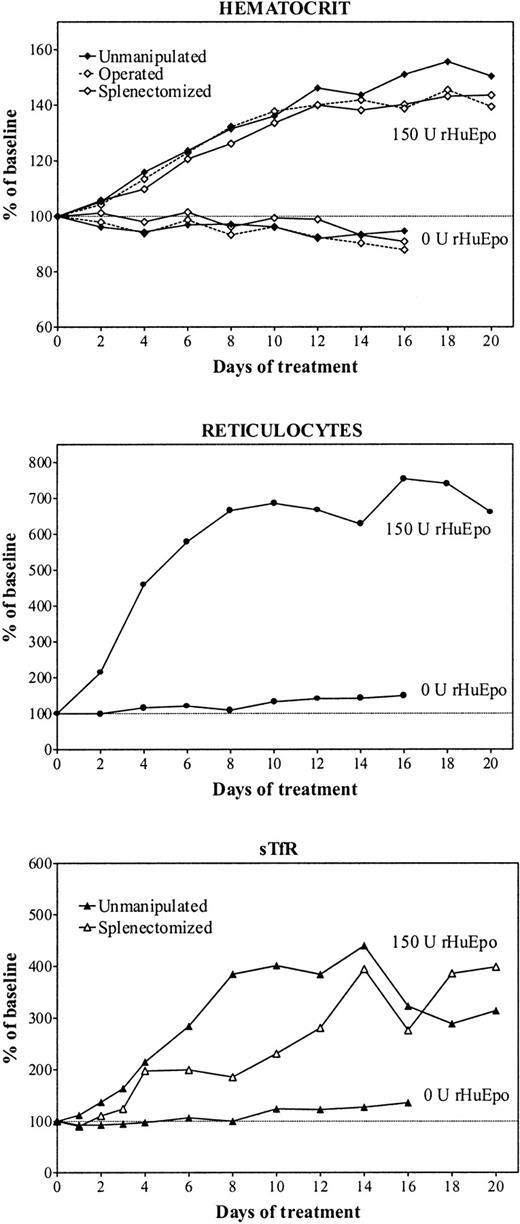
Figure 1 shows the evolution of erythroid parameters during treatment of iron-overloaded rats with 150 U rHuEpo per day for 20 days. There was a progressive increase in Hct up to day 16 of therapy, when a plateau at 160% of baseline was achieved (top panel). The reticulocyte response was very brisk, and the maximum increase was achieved after 8 days, when reticulocytes stabilized around 700% of baseline values (middle panel). There was a gradual expansion of erythropoietic activity (as measured by sTfR) with a maximum reached also after 8 days of treatment before stabilizing thereafter (bottom panel). The erythropoietic response of operated rats was a little delayed but of similar magnitude.
Erythropoietic response to erythropoietin.
Evolution of erythroid parameters during treatment of unmanipulated (closed symbols, continuous line), sham-operated (open symbols, broken line), or splenectomized (open symbols, continuous line) iron-overloaded rats during treatment with daily doses of 150 U rHuEpo. Results are expressed as percentages of baseline value.
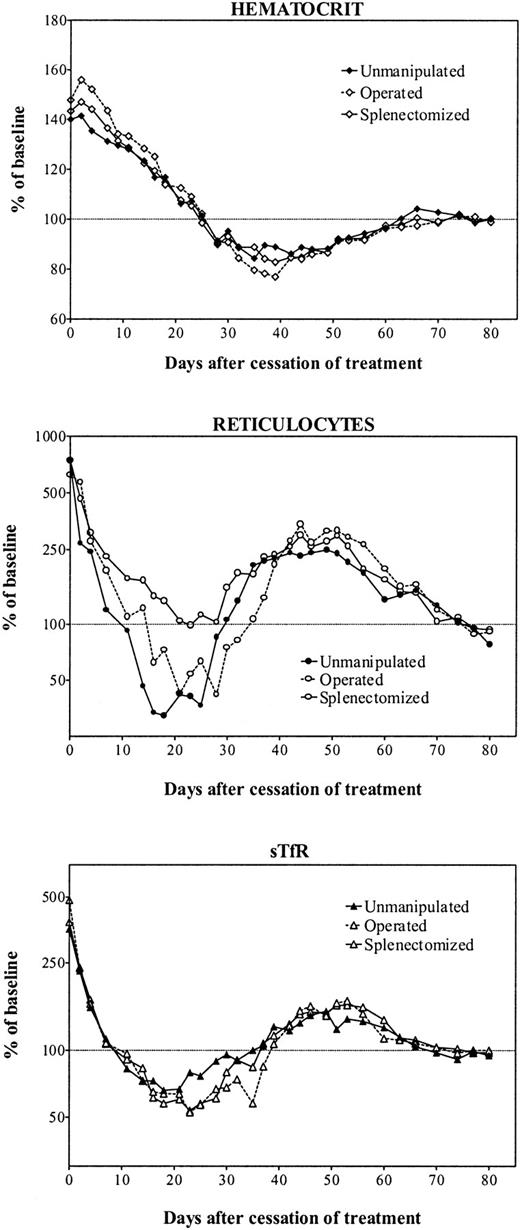
Treatment with rHuEpo was stopped after 20 days, and rats were followed up for 80 days following cessation of therapy (Figure2). There was first a gradual return of Hct to normal values over 3 to 4 weeks (Figure 2, top panel). However, this was followed by a continued decrease to anemic values with a nadir at 80% of baseline values reached between day 35 and day 40 posttreatment. Thereafter, the Hct recovered slowly over a period of about 1 month to finally stabilize at a normal level. This evolution was identical in the 3 groups of animals.
Erythroid parameters after cessation of erythropoietin therapy.
Evolution of erythroid parameters in unmanipulated (closed symbols, continuous line), sham-operated (open symbols, broken line), or splenectomized (open symbols, continuous line) iron-overloaded rats after cessation of treatment with 150 U rHuEpo per day for 20 days. Results are expressed as percentages of the mean value obtained between days 70 and 80.
After stopping rHuEpo, there was a very rapid drop in reticulocyte counts that reached normal values about 10 days later in unmanipulated or sham-operated animals (Figure 2, middle panel). However, this drop went on to reach a nadir of about 50% of normal values around day 20 posttreatment. The evolution in splenectomized rats showed the same initial drop in reticulocyte counts but without the decrease below normal levels. After reaching their nadir, in all 3 groups of animals reticulocytes underwent a secondary elevation up to 250% of normal values during several weeks before returning to baseline values.
There was a similar diphasic evolution for sTfR levels (Figure 2, bottom panel). Their initial drop was very similar to the one observed with reticulocytes, reaching a nadir at 60% of normal values around day 20, before undergoing a secondary expansion up to 180% of normal erythropoietic activity. This was also followed by a final return to normal levels.
Granulocytes and monocytes were not significantly affected by rHuEpo therapy. We have recently reported the occurrence of thrombocytopenia during treatment with rHuEpo and its progressive return to normal values after erythropoietin withdrawal.13
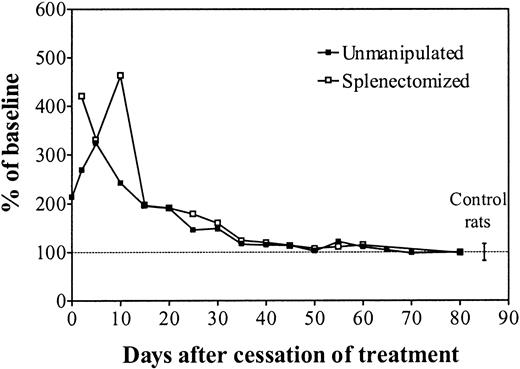
Plasma Epo levels were assayed on pools of plasma obtained within a period of 2 to 3 days in animals of the same group (Figure3). After the last injection of rHuEpo there was a very slow decrease of Epo values in all categories of animals. However, normal Epo levels were only achieved by day 35, after which they remained within appropriate limits for the Hct. The presence of rat antibodies to rHuEpo was assayed in serum of groups of 4 rats killed 0, 20, or 40 days after cessation of treatment with high doses of rHuEpo as well as in control untreated animals. None of the samples was positive.
Plasma Epo levels after cessation of erythropoietin therapy.
Plasma Epo values in unmanipulated (black squares) or splenectomized (white squares) iron-overloaded rats after cessation of treatment with 150 U rHuEpo per day for 20 days. Results are expressed as percentages of the mean value obtained between days 70 and 80. Mean ± SD values of control untreated rats are given at the right of the figure.
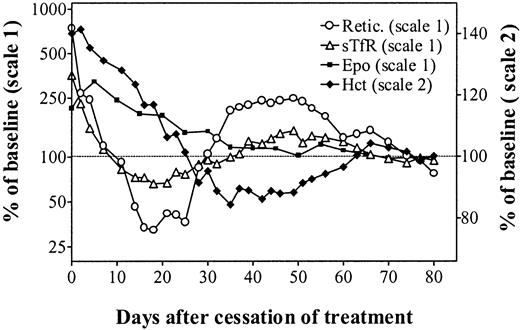
Figure 4 describes the simultaneous evolution of the Hct, reticulocyte count, sTfR levels, and Epo levels in unmanipulated animals observed for almost 3 months following cessation of rHuEpo therapy. This clearly shows a rapid decrease of erythropoietic activity while the Hct progressively returned to normal and endogenous Epo levels remained elevated. Despite adequate Epo stimulation, there was a secondary anemia due to erythroid marrow failure. This was followed by a reexpansion of erythropoiesis, allowing for a progressive correction of the anemia. Finally, all parameters stabilized in the normal range.
In vivo erythropoiesis after cessation of erythropoietin therapy.
Simultaneous evolution of the hematocrit (closed diamonds, right scale), absolute reticulocyte count (open circles, left scale), sTfR (open triangles, left scale), and Epo (closed squares, left scale) in unmanipulated iron-overloaded rats after cessation of treatment with 150 U rHuEpo per day for 20 days. Results are expressed as percentages of the mean values measured on days 70 to 80.
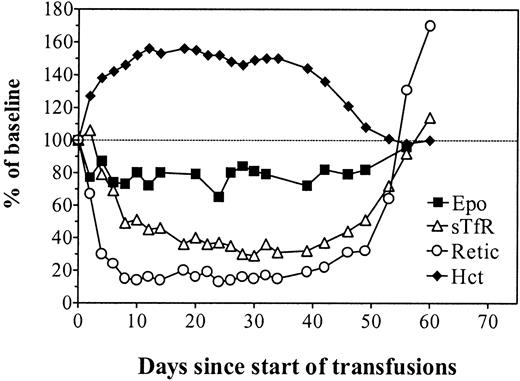
To evaluate the effect of polycythemia per se without any exposure to rHuEpo, rats were hypertransfused for 35 days and observed for a further 30 days (Figure 5). Polycythemia resulted in diminished plasma Epo levels followed by severely depressed erythropoietic activity. After cessation of the hypertransfusion program, the return to normal Hct values was accompanied by recovery of normal plasma Epo levels and erythropoietic activity.
In vivo erythropoiesis during and after a program of hypertransfusion without rHuEpo.
Simultaneous evolution of the hematocrit (closed diamonds), absolute reticulocyte count (open circles), sTfR (open triangles), and Epo (closed squares) in rats made polycythemic by hypertransfusion for 35 days and then observed for a further 30 days after cessation of the transfusion program. Results are expressed as percentages of the mean baseline values.
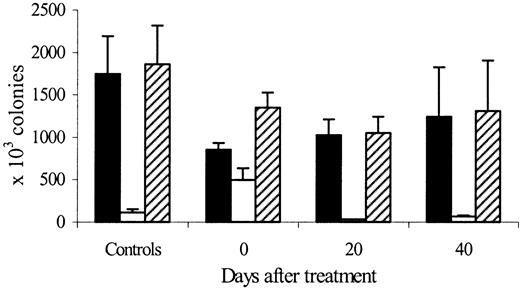
Figure 6 shows the evolution of marrow, spleen, and total-body erythroid lineage colonies (CFU-E + BFU-E) after cessation of treatment with high doses of rHuEpo in iron-overloaded rats. Compared to controls, the number of marrow erythroid colonies decreased by 50% at the end of treatment (P = .004) and then slowly recovered to 58% of control values by day 20 (P = .05) and 70% by day 40 (P = .1) posttreatment. Erythroid colonies in the spleen increased dramatically at the end of rHuEpo therapy (5 times control values, P = .0008) but later decreased to 23% of control values by day 20 (P = .03) and 71% by day 40 (P = .06) posttreatment. As a result, total-body erythroid colonies decreased at the end of rHuEpo treatment (77% of control values, P = .04), had their nadir on day 20 posttreatment (58% of control values, P = .04), and then recovered partially by day 40 (71% of control values, P = .1)
Erythroid colonies after cessation of erythropoietin therapy.
Evolution of marrow (black bars), spleen (white bars), and total body (hatched bars) erythroid lineage (CFU-E plus BFU-E) colonies 0, 20, and 40 days after cessation of treatment with high doses of rHuEpo, compared to control untreated animals.
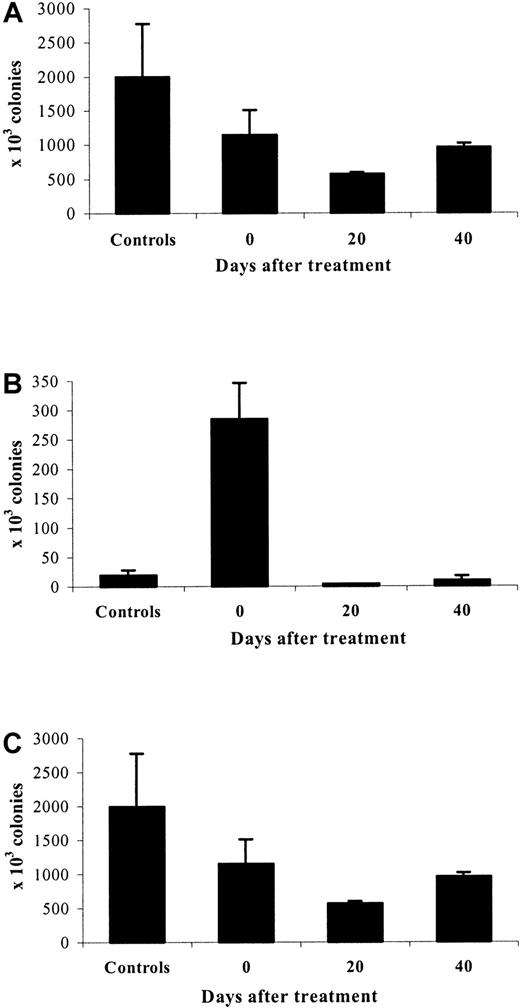
A similar pattern, with minor differences, was observed for CFU-GM (Figure 7). The nadir of marrow CFU-GM was on day 20 posttreatment (23% of control values,P = .04) rather than on day 0 (44% of control value,P = .02). The evolution of spleen CFU-GM was similar to that of spleen erythroid colonies, although the absolute number of CFU-GM was much lower at each time point. The kinetics of changes in total-body CFU-GM was therefore very similar to that observed with erythroid colonies.
CFU-GM after cessation of erythropoietin therapy.
Evolution of marrow (A), spleen (B), and total body (C) CFU-GM 0, 20, and 40 days after cessation of treatment with high doses of rHuEpo, compared to control untreated animals.
CFU-GM after cessation of erythropoietin therapy.
Evolution of marrow (A), spleen (B), and total body (C) CFU-GM 0, 20, and 40 days after cessation of treatment with high doses of rHuEpo, compared to control untreated animals.
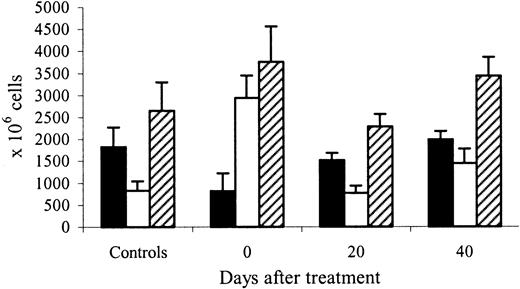
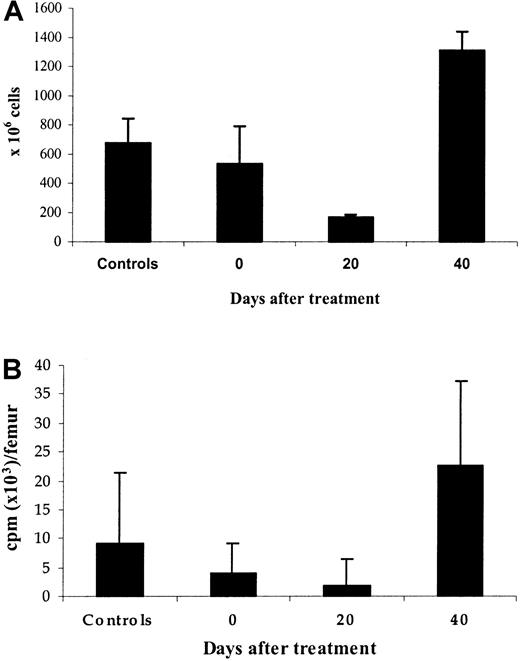
The evolution of marrow and spleen cellularity correlated with changes in progenitor numbers at the end of rHuEpo treatment (Figure8). Indeed, marrow cellularity decreased to 45% (P = .008), and spleen cellularity increased to 350% (P = .0001) of control values. The red pulp was expanded, with numerous normoblasts and absent iron stores. Marrow erythroid cellularity (Figure 9A) decreased to 26% of control values on day 20 posttreatment (P = .0005) before increasing again to 215% on day 40 (P = .001). The number of spleen normoblasts remained low at day 20 but increased again above normal at day 40 post-Epo, with iron stores restored to normal levels. Total marrow cellularity normalized by day 40 and total spleen cellularity by day 20 posttreatment.
Marrow and spleen cellularity after cessation of erythropoietin therapy.
Evolution of marrow (black bars), spleen (white bars), and marrow plus spleen (hatched bars) cellularity 0, 20, and 40 days after cessation of treatment with high doses of rHuEpo, compared to control untreated animals.
Marrow and spleen cellularity after cessation of erythropoietin therapy.
Evolution of marrow (black bars), spleen (white bars), and marrow plus spleen (hatched bars) cellularity 0, 20, and 40 days after cessation of treatment with high doses of rHuEpo, compared to control untreated animals.
Erythroid precursors after cessation of erythropoietin therapy.
Marrow cells were obtained 0, 20, and 40 days after cessation of treatment with high doses of rHuEpo as well as from control untreated animals. (A) Erythroid cellularity. (B) 59Fe incorporation into heme of erythroid precursors cultured for 24 hours in serum-free medium without erythropoietin.
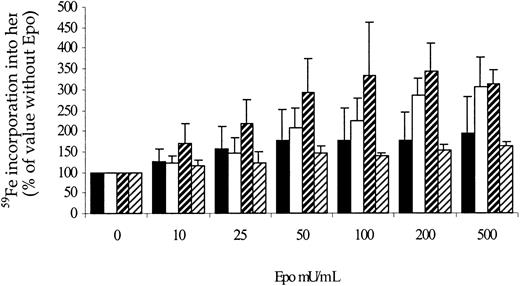
To study the evolution of marrow erythroblasts, the incorporation of iron into heme was also examined in rats killed after treatment with rHuEpo as well as in control untreated rats. Iron incorporation into heme (Figure 9B) paralleled the evolution of erythroid cellularity: It reached its nadir (20% of control values, P = .003) on day 20, before increasing to 245% of control values on day 40 (P = .005). We also examined the sensitivity of marrow erythroid precursors to Epo by measuring iron incorporation into heme in the presence of increasing concentrations of Epo, in relation to its value when no Epo is added to the medium (Figure10). The evolution of relative erythroblast sensitivity to Epo was inversely correlated with absolute changes in heme incorporation: Sensitivity to Epo was highest on day 20 posttreatment and was lower on day 40. It thus appeared that the poorer the bone marrow was in erythroblasts, the more they were sensitive to Epo.
Sensitivity of erythroid precursors to Epo after cessation of erythropoietin therapy.
Sensitivity of marrow erythroid precursors to increasing erythropoietin concentrations in rats sacrificed 0 (white bars), 20 (hatched bars, large bands), or 40 (hatched bars, small bands) days after cessation of treatment with high doses of rHuEpo, compared to control untreated animals (black bars).
To test whether the inhibition of erythropoietic activity observed after cessation of rHuEpo therapy was mediated by serum factors, serum from day 15 post-Epo or from control untreated animals was added to standard culture medium containing 0, 10, 30, 100, or 1000 mU/mL Epo in progenitor assays as well as in experiments of59Fe incorporation into heme. There was no difference in the growth of erythroid colonies or in iron incorporation into heme between control and post-Epo serum.
Discussion
Our study in normal rats showed that the dose of rHuEpo given was capable of achieving a brisk erythroid response, as assessed by substantial increases in soluble transferrin receptors and reticulocytes, resulting in hematocrits above 60% after 2 weeks of treatment (Figure 1). Changes in erythropoietic activity were of similar magnitude but a little delayed in operated animals, probably because of some persistent chronic inflammation after surgery. After cessation of treatment, we first observed the expected decrease of erythropoietic activity that led to a normalization of the hematocrit over 25 days. However, this was followed by a significant degree of anemia from which it took several weeks to recover. The anemia was caused by a transient defect in the capacity to produce red cells, as illustrated by the severe reduction in reticulocytes and sTfR levels that preceded it. Thereafter, the erythroid compartment regained its capacity to respond to an appropriate erythropoietin stimulation by increasing red cell production and correcting the anemia.
Short-term follow-up after 114 or 44 doses of rHuEpo administered to normal volunteers showed that reticulocytes returned to baseline and hematocrits remained stable after 7 and 14 days, respectively. Longer but partial follow-up after cessation of rHuEpo therapy is only available in 2 studies. In the first study, premature infants receiving rHuEpo (300 or 750 U/kg/wk) or placebo for 6 weeks were then followed up at 2, 4, and 6 weeks after cessation of rHuEpo and showed no sign of reticulocytopenia or anemia.15 In the second study, normal adult monkeys receiving rHuEpo at the dose of 100 to 250 U/kg given twice weekly for 3 weeks16 had only a modest elevation of hemoglobin, surprisingly without reticulocytosis. Available data at 3, 6, and 10 weeks posttreatment showed no anemia, but significant reticulocytopenia was evidenced at week 3. However, control animals receiving placebo showed the same pattern of progressive reticulocytopenia during treatment and were the only ones in which this remained significant at week 10 posttreatment. These results are very difficult to interpret and cannot be compared with our data, which were also obtained with larger doses of rHuEpo. To avoid the pitfalls of functional iron deficiency,17 our rats were iron overloaded for 3 months before as well as during rHuEpo therapy.
The transient suppression of erythropoietic activity we observed may be due to inappropriate stimulation by erythropoietin or intrinsic failure of erythroid cells to respond to that stimulus. Our data show that erythropoietin levels were never diminished during the course of the study but remained elevated for an unexpectedly long period of time. These inappropriately high Epo levels could be due to changes in Epo production rates or in Epo clearance and utilization. It has been observed that, for similar degrees of anemia, patients with aplastic erythroid marrow had higher serum Epo levels than patients with iron deficiency anemia, and even more so compared to patients with megaloblastic anemia or thalassemia intermedia.18-20 It has also been shown that serum Epo levels decreased rapidly on introduction of iron or vitamin B12 for the treatment of iron deficiency20 or megaloblastic anemia20,21 well before any detectable change in hemoglobin. Similarly, we have observed that the kinetics of change of serum Epo levels after autologous hematopoietic stem cell transplantation was clearly dependent on the speed of erythroid engraftment.22 The abnormal persistence of elevated plasma Epo levels in our study could thus relate to suppression of erythroid activity. However, this was contradicted by our experiment with hypertransfused rats, in which polycythemia resulted in appropriate reduction rather than elevation of serum Epo levels, with subsequent depression of erythropoietic activity. Therefore, it is unlikely that persisting elevated Epo levels were due to nonutilization by a severely depressed erythroid marrow. Alternatively, Bozzini et al23have suggested the existence of a yet unidentified feedback mechanism between Epo-responsive erythroid cells and Epo-producing cells. Cobalt- or hypoxia-induced Epo production in normocythemic mice is increased when erythropoiesis is acutely depressed and reduced when erythropoiesis is recently stimulated.23-25 However, hypoxia-induced Epo response in transfused polycythemic mice is much higher when erythropoiesis has been previously stimulated for prolonged periods of time.23,25 These apparently contradictory observations in normal and polycythemic mice may be reconciled if it is a retracting erythron that can induce this Epo-hypersecretory state.23 However, although the erythron must shrink more after rHuEpo-induced than after transfusion-induced polycythemia, it is unclear how hypoxia-induced Epo production would be relevant to our observed discrepancy in serum Epo levels between the 2 conditions. Finally, even if Epo production and Epo utilization by erythroid cells are not altered after cessation of rHuEpo therapy, changes in Epo clearance rate could provide a valid explanation. In normal human subjects14,26 as well as in rats,27 the initial clearance of rHuEpo was decreased when the doses injected were increased, approaching a plateau at high doses. In addition, the kinetics of its final elimination has not been determined. It would thus not be surprising that animals saturated with very high doses of rHuEpo for 20 days would eliminate the hormone slowly from their bodies with a long trail. Alternatively, antibodies could be generated by repeated injections of foreign proteins and prevent the normal clearance of rHuEpo. However, we found no direct or indirect evidence of such rat antibodies against human erythropoietin.
Despite this more than adequate erythropoietin stimulation, erythropoietic activity was so much suppressed as to cause anemia. We examined a series of potential explanations. A recent report of 2 horses developing severe anemia after treatment with rHuEpo demonstrated direct inhibition of the growth of erythroid progenitors by their serum.28 Therefore, we tested the effects of serum from post-Epo animals on the growth of BFU-E and CFU-E and on iron incorporation into heme and found no evidence of an inhibitory activity on erythroid precursor or progenitor cells. In addition, no rat antibodies to rHuEpo were detected at any time during the experiments. Furthermore, experiments of iron incorporation into heme at various Epo concentrations (Figure 10) demonstrated that the sensitivity of erythroid precursors to Epo was entirely preserved. These observations exclude that erythroid suppression was mediated either by anti-rHuEpo antibodies or other soluble factors or by a reduction of receptor number or affinity for Epo.
It thus appeared that erythropoietic activity could be decreased because of an intrinsic marrow defect. This is unlikely to result from excessive apoptosis because relatively low Epo levels are sufficient to prevent apoptosis in CFU-E and early erythroblasts.29Detailed analysis of all cell categories involved in erythropoiesis indicated that the whole process was significantly depressed around 3 weeks after cessation of rHuEpo therapy. This was illustrated by decreased reticulocytes and sTfR (a quantitative marker of the mass of erythroblasts), reduced erythroid cellularity in the bone marrow and spleen, diminished iron incorporation into heme, and smaller numbers of BFU-E and CFU-E. Recovery of late erythropoiesis occurred within 3 additional weeks, but full normalization of erythroid progenitors took longer. All this suggests some form of exhaustion of erythropoiesis after intensive stimulation. Platelet and white blood cell counts were not similarly altered, but CFU-GM numbers paralleled those of erythroid progenitors. Therefore, these phenomena probably already involve an early progenitor, although erythroid progenitors and their progeny are predominantly affected. Fortunately, this inhibition of erythropoietic activity is only transient and is followed by an adequate marrow response to the anemia, restoring a normal capacity of the erythroid marrow to produce red cells.
Other observations also point toward a limited capacity of the bone marrow to sustain intense stimulation of one cell lineage. Reciprocal inhibition of murine erythropoiesis and granulopoiesis has been described in splenectomized mice treated with G-CSF or rHuEpo, respectively.30 In particular, marrow erythropoietic activity can be severely depressed after G-CSF treatment, resulting in anemia.30,31 However, this has not yet been reproduced by other groups. Similarly, moderate doses of rHuEpo may cause an elevation of platelet counts,32,33 but large chronic doses induce thrombocytopenia,34 particularly in iron-replete animals,13 suggesting competition between the 2 cell lineages at the level of a common precursor.35,36 This has been well documented in a number of other studies.37
These observations of possible competition between different cell lineages as well as those of potential exhaustion after intensive stimulation indicate that caution should be applied before implementing high-dose therapy with multiple hematopoietic growth factors. Fortunately, moderate doses of rHuEpo in subjects with intact erythroid marrow do not appear to produce a secondary anemia after cessation of therapy.15 However, although our observations were obtained with very large doses of rHuEpo, lower doses may exert similar effects in situations of limited residual hematopoiesis, such as after multiple courses of chemotherapy or after hematopoietic stem cell transplantation. Such studies are ongoing in our laboratory. Whereas rHuEpo could accelerate erythroid recovery and reduce the need for transfusions in these situations, there might be a risk for more anemia after high-dose erythropoietin is stopped. If this were the case, progressive reduction of rHuEpo dosage rather than abrupt withdrawal would allow avoiding such secondary anemia.
Acknowledgments
A.G. is Senior Research Assistant, and Y.B. is Research Director of the National Fund for Scientific Research (FNRS, Belgium). Jeanine Comté provided excellent technical help.
Supported by grants from Télévie (FNRS, Belgium) and from the Fondation Frédéricq (University of Liège, Belgium) to M.P. and M.L.
M.P. and M.L. contributed equally to this work.
The publication costs of this article were defrayed in part by page charge payment. Therefore, and solely to indicate this fact, this article is hereby marked “advertisement” in accordance with 18 U.S.C. section 1734.
References
Author notes
Yves Beguin, University of Liège, Department of Hematology, CHU Sart-Tilman, 4000 Liège, Belgium; e-mail:yves.beguin@chu.ulg.ac.be.

This feature is available to Subscribers Only
Sign In or Create an Account Close Modal