Abstract
Dendritic cells (DCs) represent a family of ontogenically distinct leukocytes involved in immune response regulation. The ability of DCs to stimulate T-cell immunity has led to their use as vectors for immunotherapy vaccines. However, it is unclear whether and to what degree in vitro–generated DCs are representative of DCs that develop in vivo. Treatment of mice with human Flt3 ligand (FL) dramatically increases the number of DCs. We report here that administration of FL to healthy human volunteers increased the number of circulating CD11c+ IL-3Rlow DC (mean 44-fold) and CD11c− IL-3Rhigh DC precursors (mean 12-fold). Moreover, the CD11c+ DCs were efficient stimulators of T cells in vitro. Thus, FL can expand the number of circulating, functionally competent human DCs in vivo.
Dendritic cells (DCs) are rare, bone marrow (BM)-derived antigen-presenting cells (APCs) that are involved in immune surveillance, antigen (Ag) capture, and Ag presentation.1 DCs are uniquely able to present Ag to naive T cells and induce their activation and proliferation.1 DCs can be generated from myeloid-committed precursors, including CD14+ and CD14− BM-derived precursors, Langerhans cells of the skin (Lc-DCs),1,2 peripheral blood (PB) monocytes (monoDCs),3,4 and immature neutrophils.5 Alternatively, DCs can be generated from lymphoid-committed precursors, which also give rise to B cells, natural killer (NK) cells, and T cells.6-9 The myeloid growth factor granulocyte–macrophage colony-stimulating factor (GM-CSF) is obligate for the development of myeloid-related DCs in vitro but does not appear to be required for DC development from lymphoid-committed precursors.10 The seeming diversity in DC subsets and their distinct anatomic locations suggest that DCs may be composed of a system of several cell types, each of which may express overlapping but distinct functions.
In the PB of healthy individuals, DCs represent a minor fraction (< 1%) of mononuclear cells and can be distinguished from other mature cell lineages by their characteristic dendritic morphology; their lack of cell surface expression of CD3, CD14, CD19, and CD56; their high level of expression of CD1b/c, CD11c, CD33, and HLA-DR; and their expression of CD4. In addition, a DC precursor subset lacking CD11c expression but expressing interleukin (IL)-3Rα, and previously referred to as the plasmacytoid T cell, has been identified in lymphoid tissue and PB.11-14
The efficient capacity of DCs to initiate and regulate lymphocyte-mediated immunity has led to the study of DCs as cellular vaccine adjuvants for the immunotherapy of cancer.15,16Numerous studies in mice have demonstrated the efficacy of DC-based immunization protocols for the generation of antitumor responses.15 However, despite these promising results, the feasibility of using DCs as cellular vectors for immunotherapy is limited by the extremely small number of DCs that can be isolated from human PB. Moreover, the use of only 1 type of DC precursor (ie, monocytes) or the preferential expansion of only myeloid-related DCs in vitro for use in clinical studies may not necessarily provide the appropriate APC-derived signals that would result in the generation of optimal T-cell immunity.17 The use of cytokines that increase the number of DCs in vivo without altering subset diversity may obviate many of the potential problems surrounding current DC-based immunotherapy strategies.
Flt3 ligand (FL) is a hematopoietic growth factor that induces the proliferation and survival of primitive hematopoietic progenitor and stem cells.18 When administered to mice, FL has the unique ability to expand the number of both myeloid-related and lymphoid-related DC subsets.19,20 The expansion of DCs in mice has resulted in successful vaccination with a soluble Ag in the absence of chemical adjuvants21 as well as the generation of protective immune responses to established tumors.22 23 A phase I clinical study was therefore performed in healthy human volunteers, and the ability of FL to expand DCs in these subjects was examined. Our findings indicate that FL can be administered to humans to expand significantly the number of circulating CD11c+ and CD11c− DC subsets and DC precursors.
Patients, materials, and methods
Administration of FL to healthy human volunteers
PB samples were obtained from a randomized, placebo-controlled, phase I dose-escalation study performed in healthy human volunteers. The study was conducted at the Phase I clinic of Pharmaco International (Austin, TX), a commercial contract research organization. The protocol was approved by Pharmaco's IRB, Research Consultants' Review Committee, and informed consent was obtained from all individuals. FL was produced by recombinant DNA technology in a Chinese hamster ovary (CHO) cell line. FL was supplied as a sterile lyophilized preparation of 5 mg of FL, with 40 mg mannitol, 10 mg sucrose, and 25 mmol/L of tromethamine (Tris) per vial. It was reconstituted before administration in bacteriostatic water for injection. Twenty volunteers received once-daily subcutaneous injections of 10, 25, 50, 75, or 100 μg · kg−1 · d−1 of human FL (n = 3 per group) or matching placebo (n = 1 per group) for 14 consecutive days. PB samples (20 mL) were obtained on days 1 (before the first injection), 3, 5, 7, 9, 11, 13, 15, 17, 19, and 21 of FL or placebo administration. Safety monitoring included clinical laboratory evaluation and assessment of adverse events. Treated individuals were monitored on site for signs of adverse events. Differential white blood cell (WBC) count and serum chemistries were performed. Samples were analyzed by flow cytometry for changes in the distribution of various leukocyte populations.
Cell preparation and flow cytometric isolation of peripheral blood mononuclear cell (PBMC) populations
PBMCs were isolated after centrifugation over a discontinuous density gradient using Ficoll (1.077 g/mL, Accu-Prep; Accurate Chemicals, Westbury, NY), followed by centrifugation in phosphate-buffered saline (PBS) containing 5% fetal bovine serum (FBS) (Intergen, New York, NY). Cells were then incubated with directly conjugated antibodies, which included CD1a, CD1b/c, CD2, CD3, CD4, CD5, CD8α, CD11b, CD11c, CD14, CD19, CD33, CD40, CD56, CD80, CD86, CD123w (IL-3Rα), CD116 (GM-CSFRα), HLA-DR, macrophage mannose receptor (MMR) (Pharmingen, San Diego, CA), and CD83 (Immunex Corp, Seattle, WA), for 30 minutes at 4°C in PBS containing 0.01% NaN3 supplemented with 10% goat serum and 10% rabbit serum to block Fc receptors. Propidium iodide (PI) (1 μg/mL) was included in the final wash to allow exclusion of dead cells. Isotype-matched antibodies were used as negative controls. Multiparameter flow cytometric analysis and sorting of PBMCs were performed on a FACStar Plus (Becton Dickinson, San Jose, CA). Cytospins of sorted PBMC populations were performed by centrifugation of 5 × 10⁴ cells onto slides (500 rpm), followed by staining with Wright-Giemsa according to the manufacturer's instructions (Fisher Diagnostics, Pittsburgh, PA).
Generation of CD1a+ DCs from CD34+ BM cells
CD1a+ DCs were derived by culturing CD34+ BM progenitor cells. BM cells were obtained from healthy donors (kindly provided by Dr M. A. Caligiuri, Roswell Park Cancer Institute, Buffalo, NY). The mononuclear cells were isolated after centrifugation over a discontinuous Ficoll density gradient, followed by centrifugation in PBS containing 5% FBS. CD34+ BM cells were isolated using an anti-CD34 immunoaffinity column according to the manufacturer's instructions (Ceprate; Cell Pro, Bothell, WA). Briefly, BM mononuclear cells were incubated with anti-CD34–biotin and passed over a streptavidin-conjugated Ceprate gel matrix column. The column was washed extensively, and bound CD34+ BM cells were dislodged from the Ceprate column matrix by mechanical disruption and collected in PBS containing 5% FBS. Fluorescence-activated cell sorter (FACS) analysis revealed a purity of 85% to 92% CD34+ cells. DCs were generated by culturing CD34+ cells with recombinant human (rhu)GM-CSF (20 ng/mL), rhuIL-4 (20 ng/mL), rhu tumor necrosis factor (TNF)-α (20 ng/mL), plus rhuFL (100 ng/mL) in modified McCoy's culture medium for 14 days. DCs were purified by cell sorting on the basis of CD1a, CD86, and HLA-DR expression. All cytokines used in these cultures were produced and purified at Immunex.
Mixed leukocyte culture (MLC) and Ag-specific presentation assays
T cells were isolated from PBMCs of healthy donors using opsonized sheep red blood cells. Purified CD4+ T cells (90% to 95%) were isolated using the MACS CD4 T-cell isolation kit (Miltenyi Biotec, Sunnyvale, CA). MLC or Ag presentation assays were performed in 96-well round-bottom culture plates (Nunc, Naperville, IL). Autologous T cells were obtained from cryopreserved PBMCs obtained from healthy volunteers before FL treatment. Allogeneic CD4+ T cells (1 × 10⁵) were incubated with varying numbers of irradiated (2000 rad), cell-sorted PBMC populations from FL-treated individuals or control CD1a+ DCs in 0.2 mL modified McCoy's medium containing 10% FBS and 10−42-mercaptoethanol (culture medium) for 5 days in humidified 10% CO-2 in air. Autologous CD4+ T cells (1 × 10⁵) were incubated with irradiated (2000 rad) CD11c+ CD14− DCs or CD11c+CD14+ monocytes from FL-treated individuals in 96-well round-bottom plates in AIM-V serum-free medium (Life Technologies, Gaithersburg, MD) with or without 25 μg/mL each of either keyhole limpet hemocyanin (KLH; Calbiochem Corp, La Jolla, CA), tetanus toxoid (TT; Connaught, Swiftwater, PA), ovalbumin (Ova; Pierce Chemical Co., Rockford, IL), or hepatitis B surface Ag peptide (HBsAg peptide; Sigma, St Louis, MO) for 6 days at 37°C in 10% CO2 in air. The cultures were then pulsed with 0.5 μCi3H-thymidine for 24 hours, and the cells were harvested onto glass fiber sheets for counting on a gas-phase β counter. Values represent the mean ± SEM of 3 replicate cultures.
Fluid-phase uptake of fluorescein isothiocyanate (FITC)-ovalbumin
Fluid-phase uptake was assessed by incubation of PBMCs with 2 mg/mL FITC-Ova (Molecular Probes, Eugene, OR) at either 0°C or 37°C for 30 minutes. The 0°C samples were first metabolically fixed by preincubation in 0.1% sodium azide at 37°C and rapidly chilled before incubation with FITC-Ova. These metabolically fixed, 0°C samples were used to assess nonspecific cell-surface staining. The cells were then incubated with anti-CD14–APC and anti-CD11c–PE (Pharmingen), and PI was used to exclude dead and dying cells. CD11c+ CD14− DCs, CD11c+ CD14+ monocytes, and CD11c− CD14− lymphocytes were gated electronically and examined for FITC-Ova uptake as a function of the mean fluorescence intensity (MFI) in FITC staining. The data are presented as the MFI ± SEM of 3 FL-treated individuals, and similar results were obtained in 3 separate experiments. Examination of cells by fluorescence microscopy demonstrated that FITC-Ova was internalized.
Results
FL increases circulating CD11c+ DCs in vivo
FL was well tolerated by all subjects at all doses tested compared with the placebo controls, with only 2 adverse events considered to be related to FL administration: enlarged lymph nodes and injection-site reactions. FL did not cause allergic-type reactions. FL increased the number of WBCs, PBMCs, and CD14+ monocytes but did not significantly alter the number of circulating lymphocytes.24
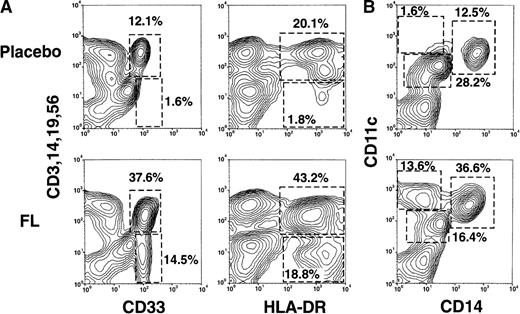
Flow cytometric analyses of the PBMC fraction from a representative FL-treated volunteer (75 μg/kg) and a placebo-treated volunteer are presented in Figure 1A. PBMCs that lacked the mature lineage markers CD3, CD14, CD19, and CD56 (Lin−) and expressed CD33 or HLA-DR were rare in the blood of placebo-treated individuals (Figure 1A) and also in pretreatment samples (data not shown). However, after 14 days of FL treatment, approximately 14% of PBMCs were Lin− and CD33+. Similarly, approximately 14% of PBMCs expressed CD11c but not the monocyte marker CD14 (Figure 1B). Four-color flow cytometry revealed that all Lin− CD33+cells expressed CD11c. In contrast, approximately 19% of PBMCs were Lin− HLA-DR+ (Figure 1A), suggesting that FL treatment generated a population of approximately 4% of Lin− HLA-DR+ cells that were CD33− CD11c− and that were rare in the blood of placebo-treated individuals (discussed later). Finally, FL treatment increased the proportion of the CD11c+CD14+ monocyte fraction (Figure 1B).
Flow cytometric analysis of PBMCs from healthy volunteers treated with either placebo or FL for 14 consecutive days.
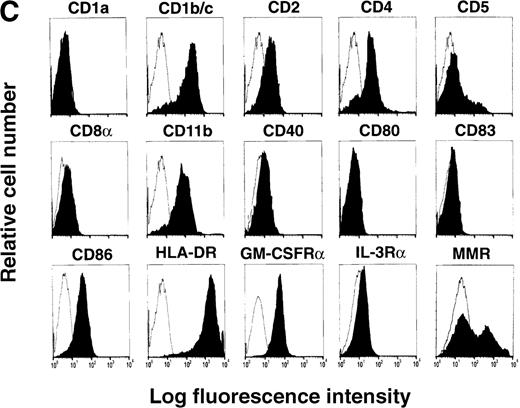
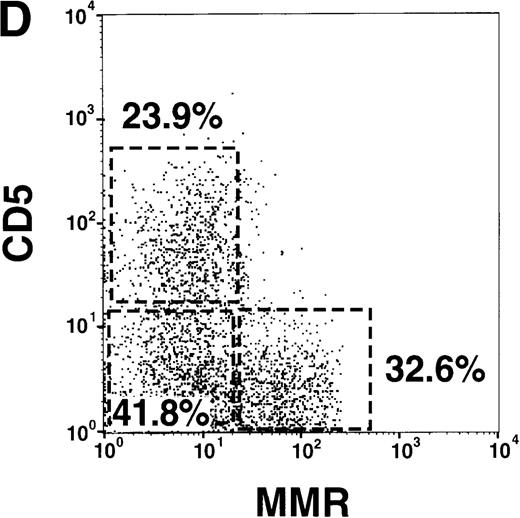
(A) Correlation of lineage-specific marker expression (CD3, CD14, CD19, and CD56) with CD33 or HLA-DR expression. (B) Correlation of CD14 with CD11c expression. (C) Expression of cell surface molecules on CD11c+ CD14− PBMCs from FL-treated individuals. CD1a, CD1b/c, CD2, CD4, CD5, CD8α, CD11b, CD40, CD80, CD83, CD86, HLA-DR, GM-CSFRα, IL-3Rα, and MMR expression are presented as the shaded histograms. Unshaded histograms represent CD11c+ CD14− cells incubated with isotype-matched controls. (D) Expression of CD5 and MMR on gated CD11c+ CD14− PBMCs. Data are presented from a representative individual treated with FL at 75 μg · kg−1 · d−1. Similar profiles were observed with treatment at 10, 25, 50, and 100 μg · kg−1 · d−1.
Further phenotypic analysis of the FL-generated CD11c+ CD14− PBMCs revealed that they were CD1a−, CD1b/c+, CD2+, CD4+, CD8α−, CD11b+, CD40−, CD80−, CD83−, CD86+, and HLA-DRbright (Figure 1C), a phenotype consistent with PB DCs (hereafter referred to as CD11c+ DCs). Analysis revealed that the gates used for CD11c+ DCs contained less than 1% CD16+ cells, indicating that the CD14low CD16+ monocytes were not represented within this gate (25,26 and data not shown). The expression of CD11b and the low to undetectable levels of CD40, CD80, and CD83 suggested that the circulating CD11c+ DCs were not fully mature.27-31 However, DCs isolated from oncology patients treated with FL up-regulate costimulatory molecules in short-term cultures (15 hours) supplemented with GM-CSF plus IL-4 (manuscript in preparation), indicating that FL-generated DCs can be further matured. The CD11c+ DCs expressed detectable levels of GM-CSFRα but low to negligible levels of IL-3Rα (Figure 1C). A subset of the CD11c+ DCs expressed the lymphoid marker CD5 (Figure 1C). Similarly, a subset of CD11c+ DCs expressed MMR, which is involved in receptor-mediated endocytosis.28 32 Interestingly, expression of CD5 and MMR was mutually exclusive, and there were 3 distinct populations of CD11c+ DCs: CD5+MMR−, CD5− MMR+, and CD5− MMR− (Figure 1D).
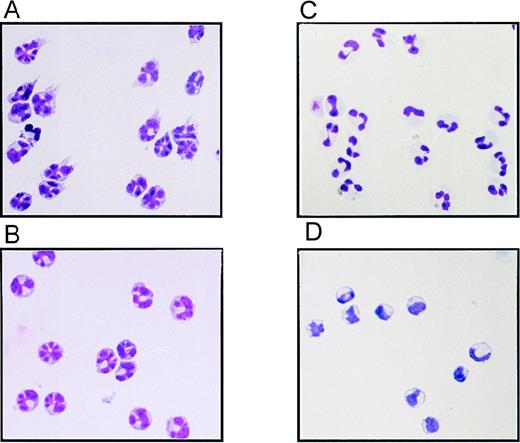
Wright-Giemsa staining of cytospins of the sorted PBMC populations indicated that the FL-generated CD11c+ DCs displayed a distinctive multilobulated nuclear morphology and expressed veiled and dendritic processes, typical of PB DCs (Figure2A). Unlike monocytes from the placebo-treated individuals (Figure 2D), the CD14+monocytes from FL-treated individuals (Figure 2B) also contained multilobulated nuclei but did not express dendritic processes, suggesting that FL treatment had altered the morphology of monocytes within the CD11c+ CD14+ fraction. Finally, the CD11cdull CD14dull cells from FL-treated individuals (Figure 1B) were identified as neutrophils based on their polymorphonuclear morphology and size (Figure 2C).
Morphology of sorted PBMCs from FL- or placebo-treated volunteers.
(A) CD11c+ CD14− DC fraction from an FL-treated individual. (B) CD11c+ CD14+monocyte fraction from an FL-treated individual. (C) CD11cdull CD14dull neutrophil fraction from an FL-treated individual. (D) CD11c+ CD14+monocyte fraction from a placebo-treated individual. Cytospins were prepared from the sorted PBMC populations depicted in Figure 1B and stained with Wright-Giemsa stain.
FL-generated CD11c+ PB DCs stimulate Ag-specific T-cell proliferation
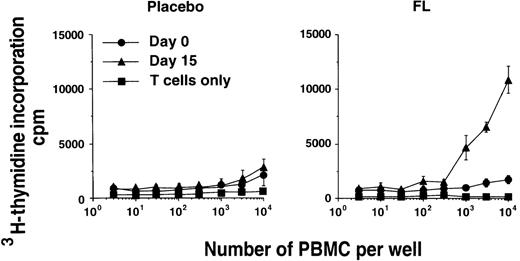
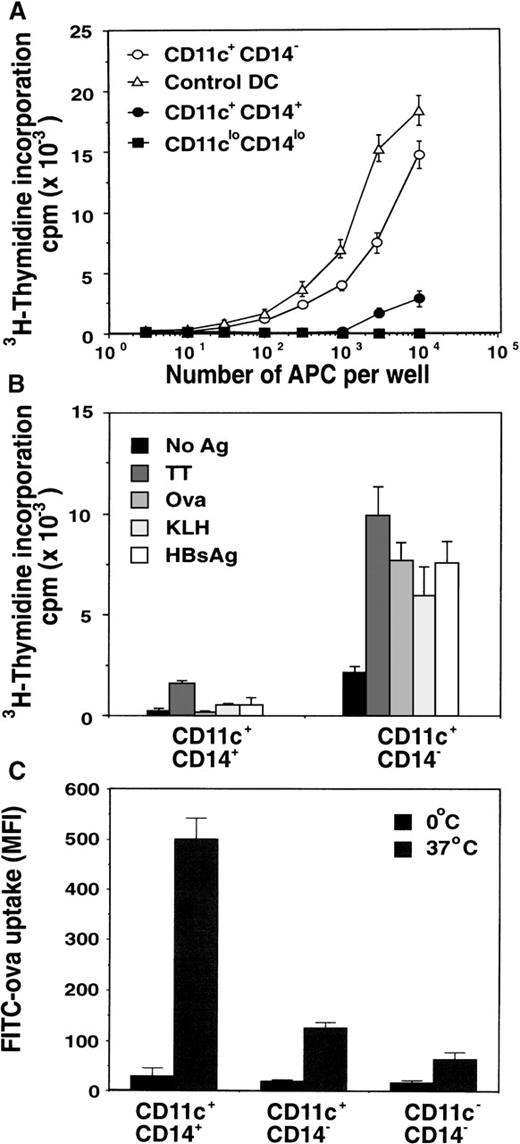
Various PBMC subsets were examined for their capacity to stimulate the proliferation of alloreactive T cells in vitro in MLC.First, total PBMCs taken before and after FL treatment from the same donor were compared. PBMCs containing maximal numbers of circulating DCs (day 15 of FL treatment) contained significantly higher MLC stimulatory capacity than PBMCs derived from the pretreatment sample (day 0 of FL treatment) (Figure 3). This suggests that the increased number of circulating DCs after FL treatment resulted in enhanced MLC-stimulating capacity of the PBMCs. To demonstrate definitively that this enhancement was due to the increased numbers of DCs in FL-treated volunteers, we sorted DCs on the basis of CD11c, HLA-DR, and lack of CD14 expression. These sorted DCs were compared with sorted CD1a+ DCs generated by culturing CD34+ BM cells in GM-CSF, IL-4, FL, and TNF-α for 14 days for their capacity to stimulate alloreactive T-cell proliferation in vitro. The CD11c+ DCs from an FL-treated individual were 30- and 300-fold more efficient at stimulating alloreactive T cells to proliferate than the autologous CD11c+ CD14+monocyte fraction or the CD11clo CD14loneutrophil fraction, respectively (Figure4A). Interestingly, the CD11c+DCs from FL-treated donors were 3-fold less efficient than CD1a+ BM-derived DCs. Although the DCs generated from the BM and the PB were not derived from the same donors, and therefore direct comparison of APC potency is difficult, the trend in a number of experiments was always for the BM-derived DCs to stimulate higher levels of proliferation in the MLC experiments. In addition, CD11c+ DCs from an FL-treated individual were more efficient than CD11c+ CD14+ monocytes at stimulating the proliferation of autologous CD4+ T cells to recall Ag (TT) and were the only cells capable of inducing T-cell proliferation to the nominal Ags Ova, KLH, or HBsAg (Figure 4B). These data suggest that FL-generated PB DCs can capture, process, and present protein or peptide Ag to naive and memory autologous T cells and induce their expansion in vitro.
Function of in vivo FL-generated PBMCs.
Alloreactive T-cell–stimulating capacities of PBMCs from day-0 (•) and day-15 PB (▴) samples from the same donor were compared. Data represent the mean ± SEM of triplicate wells. Results from a representative FL-treated donor and the corresponding placebo-treated individual from the 25-μg/kg cohort are presented. Similar results were seen with PBMCs from other FL-treated donors.
Function of in vivo FL-generated DCs.
(A) Comparison of alloreactive T-cell–stimulating capacity of the various PBMC populations depicted in Figure 1B. Sorted CD11c+ CD14+ monocytes (•), CD11c+ CD14− DCs (○), and CD11clo CD14lo neutrophils (▪) from day-15 PB samples were compared with control CD1a+ DCs generated in vitro from CD34+ BM progenitors (Δ). Data represent the mean ± SEM of triplicate wells. Results are representative of 4 separate experiments. (B) Comparison of Ag-induced T-cell proliferation by purified CD11c+ CD14− DCs and CD11c+CD14+ monocytes from FL-treated individuals. CD11c+ CD14− DCs or CD11c+CD14+ monocytes were isolated by flow cytometry and cultured with purified autologous T cells derived from cryopreserved PB samples taken before commencement of the study, in the presence of recall Ag (TT) or nominal Ags (Ova, KLH, or HBsAg peptide). Data represent the mean ± SEM of triplicate wells. Results are representative of 3 separate experiments. (C) Comparison of Ag uptake by PBMCs from FL-treated individuals. PBMCs were cultured with FITC-Ova at either 0°C or 37°C for 30 minutes and then incubated with anti-CD14–APC and anti-CD11c–PE. CD11c+CD14− DCs, CD11c+ CD14+monocytes, and the enriched lymphocyte fraction (CD11c− CD14−) were examined by flow cytometry for internalized FITC-Ova. Cells incubated at 0°C were used to discriminate between nonspecific cell surface staining and active uptake at 37°C. The data are presented as the mean fluorescence intensity (MFI) ± SEM from 3 FL-treated individuals. Results are representative of 3 separate experiments.
FL-generated DCs exhibit low fluid-phase uptake
To assess the capacity of FL-generated DCs to capture soluble Ag by fluid-phase endocytosis and macropinocytosis, we incubated the cells with 2 mg/mL FITC-Ova for 30 minutes. Examination of the various PBMC subsets revealed that the FL-generated CD11c+ DCs were capable of internalizing soluble Ova, albeit less efficiently than circulating CD14+ monocytes (Figure 4C). As expected, the lymphocyte-enriched fraction (CD11c−CD14−) was inefficient at uptake of soluble FITC-Ova (Figure 4C). Because immature DCs are highly efficient at uptake of small solutes28 32-34 (eg, Ova), these data suggest that FL-generated CD11c+ DCs are not immature and may represent a more intermediate phenotype.
Kinetics of in vivo expansion of CD11c+ DCs with FL
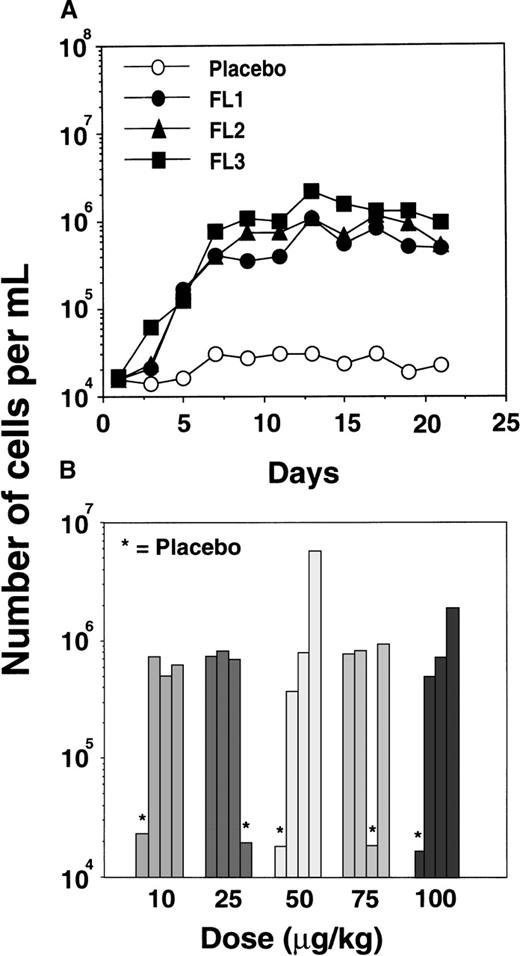
FL-mediated expansion of DCs in mice has been shown to be transient and reversible, with increased DC numbers detectable 3 days after initiating FL treatment and a return to basal levels within 7 days of the last FL injection.19 An increase in circulating human CD11c+ DCs was detected by day 5 of FL treatment, peaking at an average 44-fold above basal or placebo control levels by day 9 (Figure 5A). Seven days after the last FL injection, CD11c+ DC numbers remained well above placebo levels.
Expansion of CD11c+ DCs in the PB of FL-treated individuals.
(A) Increase in total numbers of CD11c+ DCs over time in FL-treated (•, ▴, ▪) and placebo-treated (○) individuals from the cohort receiving a dose of 100 μg · kg−1 · d−1. Similar results were obtained in the cohorts receiving 10, 25, 50, and 75 μg/kg. (B) Number of CD11c+ DCs detected at day 15 in each FL-treated or placebo-treated (*) individual from each dose cohort.
Interestingly, there was no apparent dose response in the number of DCs attained after 14 days of FL treatment at a dose ranging from 10 to 100 μg · kg−1 · d−1, suggesting that even the lowest dose (10 μg/kg) was capable of generating maximal numbers of circulating CD11c+ DCs (Figure 5B). In the 15 FL-treated volunteers, there was a mean 44-fold increase in the absolute number of circulating CD11c+ DCs, with DCs constituting approximately 15% of PBMCs or 8.8 × 10⁵ DCs per milliliter of blood (Table1). Over the same period, the proportion or absolute number of circulating DCs did not change in the 5 placebo-treated individuals, in whom DCs constituted approximately 1.0% of PBMCs or 1.8 × 10⁴ DCs per milliliter of blood (Table 1).
Detection of CD11c+ and CD11c− DC subsets in FL-treated individuals
| Individual . | Day . | Percent of PBMCs . | Number of cells (×10−6/mL) . | ||
|---|---|---|---|---|---|
| CD11c+ . | CD11c− . | CD11c+ . | CD11c− . | ||
| FL | 1 | 1.06 ± 0.2 | 0.83 ± 0.2 | 0.020 ± 0.007 | 0.016 ± 0.003 |
| 15 | 14.74 ± 3.7 | 3.10 ± 0.6 | 0.879 ± 0.325 | 0.185 ± 0.018 | |
| Placebo | 1 | 1.04 ± 0.2 | 0.75 ± 0.2 | 0.017 ± 0.007 | 0.012 ± 0.003 |
| 15 | 1.02 ± 0.3 | 0.82 ± 0.2 | 0.018 ± 0.009 | 0.014 ± 0.004 | |
PBMCs were isolated from the blood of FL-treated and placebo-treated individuals at days 1 and 15 and analyzed by flow cytometry for the proportion and total number of CD11c+IL-3R-α− and CD11c−IL-3R-α+ DCs per milliliter of blood. The data represent the mean ± SEM of 15 FL-treated and 5 placebo-treated individuals from all groups tested.
FL increases circulating CD11c− DC precursors in vivo
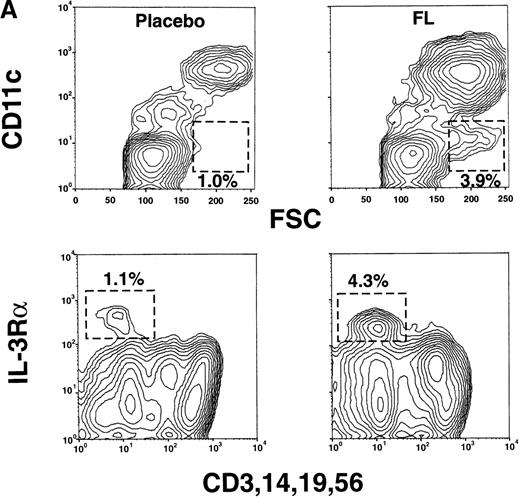
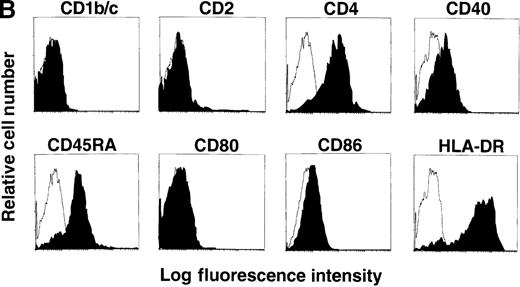
A recent report described the isolation of CD4+, CD11c−, CD45RA+ cells, termed plasmacytoid T cells,11 from human tonsils. These cells are also in the PB of normal individuals.12-14 They lack surface expression of mature lineage markers (CD3, CD14, CD19, and CD56) and CD33 but express high levels of IL-3Rα and HLA-DR.11,12 When cultured in IL-3 and CD40L, these cells develop into functional DCs. Furthermore, once matured, these CD11c− DCs appear to differentially regulate the cytokine repertoire of naive T cells, preferentially generating IL-4–, IL-5–, and IL-10–secreting T cells as compared with CD11c+ DCs, which induce interferon (IFN)-γ–secreting T cells.14 We examined whether the 4% of PBMCs in FL-treated individuals that were Lin−CD11c− CD33− HLA-DR+(Figure 1A) expressed IL-3Rα. The CD11c− PBMC fraction in FL-treated individuals contained an increased proportion of large cells (based on forward light scatter) lacking mature lineage markers and expressing high levels of IL-3Rα (Figure6A). These cells were increased approximately 3-fold as a proportion of PBMCs compared with placebo-treated individuals (or baseline levels). These CD11c− cells were CD4+, CD40low, CD45RA+, CD86low, and HLA-DR+ and lacked CD1b/c, CD2, and CD80 expression (Figure6B). Thus, the Lin− CD11c−CD33− HLA-DR+ PBMCs detected in Figure 1A represent the CD11c− IL-3Rα+DC precursor subset. The lineage derivation of these CD11c− DC precursors remains unclear. A lymphoid relationship has been proposed because of their responsiveness to IL-3 but not to GM-CSF.11,13,14 However, others have suggested that this subpopulation may be of myeloid origin, distinct from that of the Lc-DC or monoDC pathways.12
Detection of CD11c− IL-3R+DCs in FL-treated but not placebo-treated individuals.
(A) PBMCs from FL-treated (100 μg · kg−1 · d−1) or placebo-treated individuals (day 15) were analyzed by flow cytometry for large (FSChigh) CD11c− cells (shown gated) or cells that lacked the mature lineage markers CD3, CD14, CD19, and CD56 but expressed high levels of IL-3Rα. (B) Expression of CD1b/c, CD2, CD4, CD40, CD45RA, CD80, CD86, and HLA-DR on CD11c− IL-3Rα+ PBMCs from an FL-treated individual. Results are representative of 4 separate experiments.
Discussion
In this phase I clinical study, increasing doses of FL were administered subcutaneously to healthy volunteers over 14 consecutive days to evaluate the safety of FL and its effect on the number of circulating DCs. FL administration was well tolerated and resulted in a dramatic increase in the numbers of at least 5 types of DCs or DC precursors. These included: a 44-fold increase in CD11c+ PB DCs (which can be subdivided into CD5+MMR−, CD5− MMR+, and CD5− MMR− subsets) (Figure 1A, B, D; Table 1), a 12-fold increase in CD11c−IL-3Rα+ DC precursors (Figure 6A; Table 1), and a 10-fold increase in CD14+ monocytes (Figure 1B). Although CD5 and MMR expression has been detected on blood DCs and on in vitro–generated monocyte-derived DCs,28,32,35 it is unclear whether expression of CD5 or MMR defines the maturational status or ontogenic derivation of the FL-generated CD11c+DCs. However, the conspicuous absence of a CD5+MMR+ intermediate subset suggests that the CD5+MMR− and CD5− MMR+ DCs may represent distinct DC subpopulations rather than DCs progressing along a maturational continuum. The lack of CD16 expression by the CD11c+ DCs argues against the MMR+ subpopulation representing contaminating CD14low CD16+ MMR+monocytes,25,26 as these were excluded by the stringency of gating. Howard et al36 have identified CD5+MMR− and CD5− MMR+ DC subsets in the afferent lymph of cattle. Although these 2 DC subsets are equivalent in their capacity to stimulate Ag-specific CD4+ T cells, the CD5− MMR+DCs are more efficient at priming naive respiratory syncytial virus–specific T cells. These 2 DC subsets may therefore play distinct roles in the induction of primary immune responses.36
Interestingly, cells in the CD14+ monocyte fraction from FL-treated individuals were morphologically distinct from monocytes isolated before treatment and those from placebo control individuals (Figure 1B, D). The appearance of these morphologically distinct cells within the CD14+ PBMC fraction may represent de novo–generated CD14+ monocytes or CD14+ myelomonocytic precursors that accumulate in the PB of FL-treated individuals. This would be consistent with the previously reported myelopoietic effects of FL treatment in mice.37
It is generally believed that immature DCs are specialized in Ag uptake and processing, and mature DCs are specialized in T-cell priming and stimulation.32,34 FL-generated CD11c+ DCs were capable of fluid-phase Ag uptake, but not to the degree that the CD14+ monocytes were (Figure 4C). The CD11c+DCs were also able to stimulate alloreactive T cells (although less so than the mature BM-derived DCs) and could stimulate proliferation in response to a recall Ag (TT) and to the nominal Ags KLH, Ova, and HBsAg peptide. These data suggest that on the basis of their low uptake of fluid-phase Ag, the FL-generated CD11c+ DCs are relatively mature compared with immature monoDCs, which are very efficient at Ag uptake.28,32-34 However, although the levels of Ag capture exhibited by FL-derived DCs are low, they were sufficient to drive T-cell proliferative responses, perhaps indicating that these DCs have other specialized Ag presentation features. It is possible that FL-generated DCs could have matured during the in vitro culture period with T cells (4 days), acquiring the capacity to efficiently stimulate T-cell proliferation. In this regard, recent experiments using DCs generated in FL-treated cancer patients have indicated that these blood DCs mature rapidly (15 hours) upon in vitro culture, up-regulating CD80, CD83, CD86, and HLA-DR expression (manuscript in preparation). Spontaneous maturation of blood DCs in vitro has also been reported.38 Although this could explain the apparent discrepancy between immature surface phenotype and an intermediate to mature functional capacity, it is also possible that FL-generated blood DCs may be more related to in vitro–generated Lc-DCs, which are less efficient at Ag uptake as compared with in vitro–generated monoDCs.32 FL-generated DCs are, therefore, not completely immature on the basis of their low Ag capture activity, high cell surface major histocompatibility complex class II expression, and efficient Ag presentation, but they are also not fully mature cells because they express low to negligible levels of CD40, CD80, and CD8327-31 33 and do not present alloantigen as efficiently as mature CD1a+, in vitro–generated, BM-derived DCs. Taken together, the data suggest that FL-generated PB DCs are either intermediate in their maturation status or are not functionally equivalent to in vitro–generated monoDCs.
Clinical trials currently examining the safety and efficacy of using DCs to deliver tumor Ag vaccines in vivo are targeting the monocyte-derived DC subset.16 Functional distinctions between Lc-DCs and monoDCs have been reported and suggest that these DC subsets are not equivalent in their capacity to stimulate T- and B-cell responses.17,32 In addition, unlike Lc-DCs or monoDCs, the CD11c− DCs fail to secrete IL-12 upon stimulation and secrete high levels of IFN-α upon viral infection.14,39The CD11c− DCs may also differentially influence the types of cytokines that T cells are induced to secrete.14These studies emphasize how understanding the functional heterogeneity of DC subsets is essential for their appropriate use in immunotherapy. In this respect, the most successful immunotherapy strategies will likely be those that maintain the diversity of DC subsets or those that can specifically target their distinct functional characteristics in vivo.
The ability of FL to expand the number of DCs in vivo for immunotherapy offers an alternative strategy to the use of in vitro–generated DCs. FL treatment of healthy volunteers was safe and well tolerated. Large numbers of functionally competent DCs with various phenotypes were generated in vivo. The ability to expand a diverse repertoire of DC subsets may obviate many of the issues regarding which type of in vitro–generated DC population (monoDCs, Lc-DCs, or lymphoid-related DCs) is most appropriate for the generation of clinically effective immunity in vivo.
FL has been shown to generate effective T-cell and NK cell–mediated antitumor responses in tumor-bearing mice.22 23 Clinical studies using FL to expand DC populations in cancer patients are currently underway. It will be of great interest to determine whether the increase in DC numbers will result in increased immunity to endogenous tumor Ags. As an alternative approach, it may be possible to expand DC subsets by FL treatment, isolate the DCs for transient manipulation with tumor vaccines, and reinfuse them into cancer patients. Thus, FL may be an important cytokine for augmenting antitumor immune responses in vivo.
Acknowledgments
We thank S. Braddy, D. Hirschstein, and A. Alpert for assistance with flow cytometry and Dr K. Shortman from the Walter and Eliza Hall Institute, Melbourne, Australia; and Dr M. B. Widmer, Dr D. H. Lynch, Dr D. E. Williams, and A. Aumell from Immunex Corporation for critical advice and assistance.
Reprints:E. Maraskovsky, The Ludwig Oncology Unit, Ludwig Institute for Cancer Research, 6th Floor, Harold Stokes Building, Austin and Repatriation Medical Center, Studley Rd, Heidelberg VIC 3084 Australia; e-mail: eugene.maraskovsky@ludwig.edu.au.
The publication costs of this article were defrayed in part by page charge payment. Therefore, and solely to indicate this fact, this article is hereby marked “advertisement” in accordance with 18 U.S.C. section 1734.

This feature is available to Subscribers Only
Sign In or Create an Account Close Modal