Abstract
CDR3 of the functional rearranged T-cell receptor variable β region (TCR-Vβ) transcript was sequenced in order to demonstrate for the first time the identity between a long-term cultured T-cell line derived from a cutaneous T-cell lymphoma (CTCL) patient and the malignant T-cell clone present in the blood. The patient's peripheral blood lymphocyte-derived cultured T-cell line had a CD3+Vβ22+CD4+CD8+CD25−phenotype. It was named Pno and had been cultured for more than 1 year. Both fresh and long-term–cultured tumor cells proliferated highly in response to interleukin-7 (IL-7), and exogeneous IL-7 prevented Pno lymphocytes from apoptosis and maintained high levels of Bcl-2 expression. This unique malignant cloned lymphocyte line was further used to carry out functional studies. The results indicated that the CD3/TCR structures expressed by the Pno lymphocytes were functional because an immobilized anti-CD3 monoclonal antibody (mAb) or the combination of a soluble anti-CD3 mAb with submitogenic doses of phorbol 12 β-myristate 13 -acetate induced a proliferative response. Further, the CD2 and CD28 coreceptors were functional because they were able to induce a strong proliferative response upon their specific stimulation. Finally, the Pno T cell line had a Th3-type cytokine profile because it produced high amounts of the immunosuppressor cytokine tumor growth factor–β1 (TGF-β1). This high production of TGF-β1 may inhibit antitumor specific responses in CTCL.
Cutaneous T-cell lymphomas (CTCLs) are a heterogeneous group of usually low-grade lymphomas primarily involving the skin.1 Mycosis fungoides are characterized by skin invasion of clonally-derived malignant CD4+ T lymphocytes that phenotypically resemble mature T-helper cells. A more aggressive form of CTCL occurs when the malignant cells become nonepidermotropic and are associated with extracutaneous involvement. Sézary syndrome (SS) is a more aggressive form of CTCL that is characterized by a clonal expansion of CD4+/CD45RO+ T cells and the appearance of these malignant T cells in the blood.2The biology of the disease remains poorly understood, as it is difficult to identify the malignant cell because of the lack of specific cell surface markers. Thus, in cutaneous lesions it is difficult to distinguish CD4+ CTCL from reactive infiltrating CD4+ T lymphocytes.3-5 An approach to this problem is to establish long-term cultured CTCL lines. The functional characterization of these CTCL lines will allow investigation of the mechanisms that contribute to the down-regulation of the specific antitumor reactivity.6,7 Further, such CTCL lines will represent a fundamental tool for the isolation of characteristic megahistocompatability complex (MHC) class I peptides that are important for the priming of antitumor responses.8-10
Until now, only a small number of tumor T-cell lines have been described, and they were derived from lesional skin or peripheral blood of patients with SS, mycosis fungoides, or cutaneous large T-cell lymphoma.11-15 However, so far no attempt has been made to prove the identity of the cultured T-cell lines with the malignant T-cell clone detected in the skin or blood of CTCL patients. Recently, we reported a CD4+ T-cell line derived from CTCL lesions.5 We found that the T-cell receptor variable β region (TCR-Vβ) gene rearrangement expressed by the tumor cell line was detected within the initial skin tumor cells. Further, we demonstrated the identical size of the CDR3 of the TCR-Vβtranscripts expressed by the tumor T-cell line and by clonal skin tumor T lymphocytes. Thus, our results suggest that the tumor cell line was identical to the in vivo tumor cells.
In the present study, we report for the first time the characterization of a novel long-term cultured CTCL line termed Pno that was developed from a CTCL patient with a CD3+Vβ22+CD4+ CD8αα+CD25−lymphocyte phenotype. We definitively establish its identity to the malignant T-cell clone circulating in the patient blood byTCR-Vβ CDR3 transcript sequencing. The tumor cell line Pno and the freshly isolated circulating tumor cells had an identical cell surface phenotype. In addition, both fresh and long-term cultured tumor cells highly proliferated in response to interleukin 7 (IL-7). We demonstrated that exogeneous IL-7 was able to prevent Pno cells from apoptosis and induced a high level of Bcl-2 expression. We found that an immobilized anti-CD3 monoclonal antibody (mAb) induced proliferation of Pno lymphocytes, and the combination of phorbol 12 β-myristate 13 α-acetate (PMA) with soluble anti-CD3, soluble anti-CD28, or a mitogenic pair of anti-CD2 mAbs induced a potent proliferative response. Further, we found that both Pno lymphocytes and fresh circulating tumor cells secreted Th3-type cytokines. This is the first report of an IL-7–dependent CTCL line with a CD4+CD8αα+ phenotype that exhibited functional CD3/TCR, CD2, and CD28 receptors and secreted high amounts of the immunosuppressor cytokine tumor growth factor–β1 (TGF-β1) upon specific stimulation.
Patient, materials, and methods
Patient
Patient Pno was a 50-year-old woman with a 10-year history of generalized erythroderma. Skin biopsies showed an epidermotropic infiltrate composed of atypical CD4+CD8+lymphocytes with numerous admixed neutrophils. Peripheral blood flow cytometric analysis revealed 50% CD3+CD4+- CD8+TCR-Vβ22+atypical lymphocytes. The bone marrow biopsy, lymph node biopsy, and computed thoracoabdominal tomography were normal. The serology for human T lymphotropic virus–1 (HTLV-1) and human immunodeficiency virus (HIV) were negative. The patient status deteriorated despite topical therapy (nitrogen mustard and PUVA [psoralen and ultraviolet light therapy]) and systemic therapy (interferon [IFN], methotrexate, and multiagent chemotherapy), and the patient died of infection after 4 months.
Tumor cell line
After informed consent and approval by an ethical committee (CCPPRB, Hôpital Henri Mondor), we established the Pno cell line (TCR-Vβ22+) in vitro from a sample of the patient's peripheral blood. Mononuclear cells were isolated by Ficoll-Isopaque (Pharmacia Fine Chemicals, Piscataway, NJ) density gradient centrifugation. The cells were added to culture medium consisting of Roswell Park Memorial Institute medium (RPMI 1640) (GIBCO, Paisley, UK), 2 mmol/L L-glutamine, 100 U/mL penicillin, 100 μg/mL streptomycin, 10% heat-inactivated human serum, and 10 ng/mL IL-7 (gift of Sanofi-Synthélabo Recherche, Labège, France). Lymphocyte expansion was performed by plated cells at a concentration of 3 × 10⁴ cells per well into round-bottomed 96-well plates (Greiner, Nürtingen, Germany). The final volume in each well was 200 μL culture medium. Every 2 days fresh culture medium was added in the wells, whereas the cells were collected each week.
Monoclonal antibodies and flow cytometry studies
Most mAbs were produced by our laboratory or were obtained through the exchanges of the Leukocyte Typing VI International Workshop on white cell differentiation antigens (T cell antigens, Kobe, Japan, November 10, 1996).16 We also obtained anti–TCR-Vβ and anti-CD8αβ (Beckman-Coulter, Marseilles, France) and the mAb L243 (Dr P. Le Bouteiller, INSERM, Toulouse, France), which is reactive with monomorphic determinants shared by HLA-DR, HLA-DP, and HLA-DQ. The mAbs were used as ascites fluid and, when needed, were coupled to fluorescein isothiocyanate (FITC) or biotin. Indirect immunofluorescence analysis was performed by incubating 3 × 10⁵ cells with each mAb for 30 minutes at 4°C. The cells were then washed with phosphate-buffered saline (PBS) supplemented with 1% bovine serum albumin (BSA) and incubated with biotinylated affinity-purified goat antimouse immunoglobulin (Ig) for an additional 30 minutes at 4°C.
After washing, the cells were resuspended in 50 μL streptavidin-phycoerythrin (PE) solution for 30 minutes at 4°C. The cells were then extensively washed before flow cytometric analysis using a single argon flow cytometer analyzer (Epics XL; Beckman-Coulter, Miami, FL). For induction of CD25 by Pno lymphocytes, the cells were activated for several hours with 2 ng/mL PMA (Sigma Biochemicals, St Quentin, France). Isotype control mAbs were used to establish the PMT settings, and singly stained samples allowed compensation for 3-color immunofluorescence tests, which were performed as previously described.17 For intracellular labeling, the cells were fixed in PBS 1% paraformaldehyde for 20 minutes at 4°C, washed, and then permeabilized with staining buffer containing 0.1% saponin. Antihuman Bcl-2 mAb (124; Dako, Glostrup, Denmark) was FITC-conjugated and compared with an isotype control. Apoptosis was detected by the appearance of phosphatidylserine residues at the cell surface by labeling with annexin V (AV) (Annexin V-FITC, Beckman-Coulter, France) and 50 μg/mL propidium iodide for 10 minutes on ice. The population of live lymphocytes was gated by using the morphological criteria of forward and side scatter.
CDR3 size analysis of Vβ transcripts using polymerase chain reaction
To study the Vβ transcripts expressed by the Pno cell line and malignant T lymphocytes freshly isolated from peripheral blood (PBLs), a run-off methodology was used.5 The Vβ and the Cβ specific primers and the procedure used for CDR3 size analysis have been reported previously.5 Briefly, 5 × 10⁶ mononuclear lymphocytes from patient blood and Pno lymphocytes were resuspended in 6 mol/L guanidium thiocyanate buffer. Total RNA was then purified by CsCl gradient centrifugation. For PBLs, total RNA was extracted using a modified guanidium thiocyanate phenol/chloroform method (RNAzol B method). Complementary DNA (cDNA) was prepared by a standard method using reverse transcriptase (RT) and an oligo-dT primer. cDNA copies of 0.1 μg RNA were amplified in 40 cycles of Vβ/Cβ polymerase chain reaction (PCR) in 50, and 2-μL aliquots were copied in 1- to 5-cycle runoff reactions primed with fluorescent-labeled (ABI Fluorophore Fam; Applied Biosystems, Foster City, CA) oligonucleotides specific for Cβ or Jβ fluorophores. Runoff products were then subjected to electrophoresis on an ABI sequencer (Applied Biosystems) in the presence of fluorescent size markers, and they were analyzed with 672 Genescan software (Perkin Elmer SA, Courbevoie, France).
Directed sequencing of PCR products
PCR products were purified using Qiagen columns (Qiaquick PCR purification kit; Qiagen, Hilden, Germany) and resuspended in 20 μL sterile water. The purified products were directly sequenced in both directions with a PRISM ready reaction DyeDeoxy Terminator cycle sequencing kit and a 373A DNA sequencer (Applied Biosystems).
Proliferation assays
The proliferative responses of the tumor cell line and patient PBLs to various stimuli were determined as described elsewhere18by measuring the 3H-thymidine incorporation (cpm) of 50 × 103 responder cells. These tests were carried out in 96-well round-bottomed plates in 0.2 mL culture medium containing 10% inactivated human serum. Cytokines IL-2, IL-4, IL-7, and IL-13 ( gift of Sanofi-Synthélabo) and IL-15 and IL-12 (gift of Dr Chouaib, IGR, Villejuif, France) were used to test the proliferation of Pno lymphocytes and PBLs. The soluble mAbs used for proliferative responses with PMA (Sigma Biochemicals) were the mitogenic pair of anti-CD2 mAbs, CD2 × 11 and GT2 (ascites used as described elsewhere19); 5 μg/mL anti-CD3 mAb OKT3; and 2 μg/mL anti-CD28 mAb 4B10. For anti-CD3–induced proliferation, the wells were precoated for 2 hours at 37°C with 10 μg/mL OKT3 mAb and washed 3 times before the addition of cells with or without IL-2 or IL-7.
Lymphokine assays
We stimulated 1 × 10⁵ cells per microwell with 2 ng/mL PMA with or without 5 μg/mL soluble purified anti-CD3 mAb in a final volume of 200 μL. The supernatants (100 μL per microwell) of the various cultures were harvested 24 hours later and stored at −80°C. The levels of IL-2, IL-4, IL-10, IFN-γ, and TGF-β1 were determined by indirect sandwich enzyme-linked immunosorbent assays (ELISAs) (Beckman-Coulter, France, and R&D Systems Europe, Abingdon, England) employing the conditions recommended by the manufacturers. The assay of biological activity of TNF-α was measured using the WEHI 164 clone 13 cell line as described elsewhere.20 The cells were cultured in RPMI 1640 medium containing 5% fetal calf serum (FCS) at 5 × 10³cells per well in 96-well flat-bottomed plates. When the monolayer became confluent, actinomycin D and serial dilutions of either a known concentration of recombinant TNF-α (rTNF-α) or experimental supernatants were added. After a 24-hour incubation, 125 μg MTT was added to each well and incubated for 2 hours at 37°C. Following gentle aspiration of the supernatant, 100 μL SDS-DMF was added to each well and vigorously shaken for 15 minutes. The absorbance at 570 nm (with reference at 650 nm) was then read, and the measurement for the dilution series was plotted to produce dose-response curves in which the OD read was proportional to the reciprocal of the concentration of biologically active TNF-α.
Results
Patient circulating tumor T lymphocytes and the long-term tumor T-cell line Pno expressed TCR-Vβ22 and coexpressed CD4 and CD8
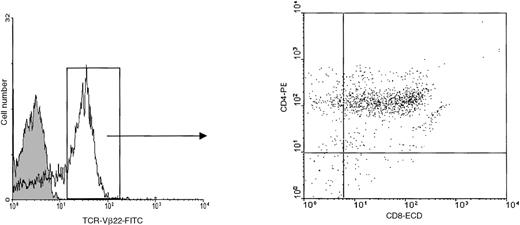
Mononuclear cells were isolated from the peripheral blood of the patient 1 month before death. At this time, the total white blood cell count was 29 000 cells per μL including 15 400 neutrophils and 9600 lymphocytes. Flow cytometric analysis indicated that more than 50% of circulating lymphocytes had the TCR-Vβ22+- CD4+CD8α+phenotype (Figure 1). As very preliminary studies indicated that in short-time cultures, the patient PBLs were capable to proliferate in response to IL-7, we cultured the PBLs in 10 ng/mL IL-7. After expanding in vitro for 6 weeks, the cells stopped dividing and began to decline, they were then plated at 3 × 10⁴ cells per well into 96-microwell plates. The cells started to grow again, thereby constituting the Pno cell line. After 12 months of culture, the Pno cells were still IL-7–dependent and exhibited logarithmic growth, with a doubling time of 72 hours. Similar to the majority of freshly isolated patient PBLs, the Pno cells expressed TCR-Vβ22, CD4, and CD8αα (because they failed to react with an anti-CD8αβ mAb). In addition, both the Pno cell line and PBLs expressed identical cell surface antigens such as the MHC class I antigens, CD2, CD2R, CD28, CD95, CD122, and CD132. However, they failed to express the MHC class II antigens, CD25, CD1a, CD1b, CD1c, and CD30 and the natural killer (NK) receptors (CD94, CD158a, and CD158b) (Table 1).
Expression of TCR-Vβ22 on fresh circulating tumor cells.
We performed 3-color flow cytometric analysis using FITC-conjugated anti–TCR-Vβ22, anti–CD8α-ECD, and anti–CD4-PE mAbs.
Expression of TCR-Vβ22 on fresh circulating tumor cells.
We performed 3-color flow cytometric analysis using FITC-conjugated anti–TCR-Vβ22, anti–CD8α-ECD, and anti–CD4-PE mAbs.
Surface antigens expressed by Pno lymphocytes and patient PBLs
| Surface antigen . | Antibody . | Reactivity* . | |
|---|---|---|---|
| Pno . | Patient PBLs . | ||
| CD3 | IP30 | ++ | ++ |
| TCR-Vβ22 | IMMU 546 | ++ | ++ |
| CD4 | IP34 C | ++ | ++ |
| CD8α | IP48 | ++ | ++ |
| CD8α/β | 2 ST8-5 H7 | − | − |
| CD2 | CD2X11 | ++ | ++ |
| CD2R | GT2 | + | + |
| MHC class I | W6/32 | ++ | ++ |
| MHC class II | L242 | − | − |
| CD25 | BC 96 | − | − |
| CD122 | TU 27 | + | + |
| CD132 | 3B5 | ++ | ++ |
| CD28 | CD28.2 | ++ | ++ |
| CD95 | APO-1 | ++ | ++ |
| CD158a | EB6 | − | − |
| CD158b | GL 183 | − | − |
| CD94 | HP-3B1 | − | − |
| CD1a | L544 | − | − |
| CD1b | O249 | − | − |
| CD1c | L161 | − | − |
| HLA-G | BFL1 | − | − |
| CD30 | By 88.9 | − | − |
The reactivity is the relative intensity of staining compared with isotype controls; ++ indicates strong staining; +, moderate; and −, negative.
Patient circulating tumor T lymphocytes and the tumor T-cell line Pno expressed an identical TCR-Vβ chain junctional region
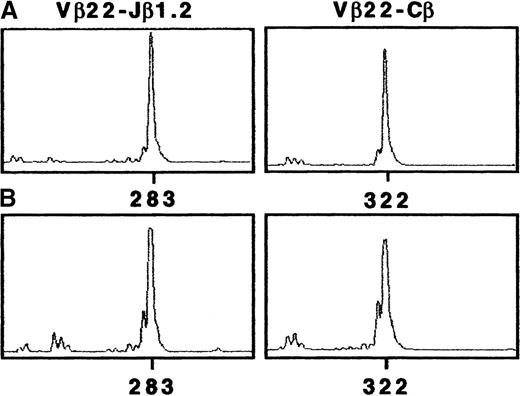
To characterize the TCR-β gene segment in Pno tumor cells, we used an RT-PCR approach and a panel of previously described Vβ and Cβ or Jβ primers. The TCR-β chain structure determination of the Pno cell line showed a unique TCR-Vβ transcript corresponding to Vβ22/Jβ1.2 (Figure 2A). The CDR3-size Vβ distribution in PBLs was also examined. The results obtained with the Vβ22- and fluorescent Cβ-specific primers gave a dominant peak that was highly suggestive of clonal expansion (Figure2B). Further, we found a unique Vβ22/Jβ1.2 rearrangement that had an identical CDR3 size to the Pno cell line. The TCR-Vβ chain junctional region of the Pno cell line and the patient PBLs were then further analyzed by cloning and sequencing amplified Vβ22/Jβ1.2 transcripts. Table 2 shows identical nucleic acid sequences of both the Pno cell line and the patient's circulating malignant lymphocyte junctional regions. These results indicate that the PBLs corresponded to a major TCR-Vβ22+CD4+CD8αα+ clonal population that was identical to the long-term cultured IL-7–dependent Pno T- cell line.
Tumor T-cell line Pno and patient PBLs showed a uniqueTCR-β transcript corresponding to Vβ22/Jβ1.2.
CDR3 size analysis of TCR-Vβ22 transcripts in (A) Pno tumor cells and (B) patient PBLs were analyzed with fluorescent Cβ and Jβ1.2. We amplified cDNA made from total RNA extracted from Pno and PBLs in a PCR reaction primed by Vβ22- and Cβ-specific primers. The unlabeled amplification products were elongated with nested fluorescent Cβ and Jβ1.2. The aliquots were subjected to electrophoresis and analysis on an automated sequencer.
VDJ sequences of Pno lymphocytes and patient PBLs
| Cell . | Vβ . | Framework . | NDβN . | Framework . | Jβ . |
|---|---|---|---|---|---|
| Pno | 22 | TGT GCC AGC AGT | GAC ACT | AAC TAT GGC TAC | 1.2 |
| C A S S | D T | NYGY | |||
| Patient PBLs | 22 | TGT GCC AGC AGT | GAC ACT | AAC TAT GGC TAC | 1.2 |
| C A S S | D T | NYGY |
| Cell . | Vβ . | Framework . | NDβN . | Framework . | Jβ . |
|---|---|---|---|---|---|
| Pno | 22 | TGT GCC AGC AGT | GAC ACT | AAC TAT GGC TAC | 1.2 |
| C A S S | D T | NYGY | |||
| Patient PBLs | 22 | TGT GCC AGC AGT | GAC ACT | AAC TAT GGC TAC | 1.2 |
| C A S S | D T | NYGY |
The tumor T-cell line Pno and patient circulating T lymphocytes proliferated in response to IL-7, IL-4, and IL-2
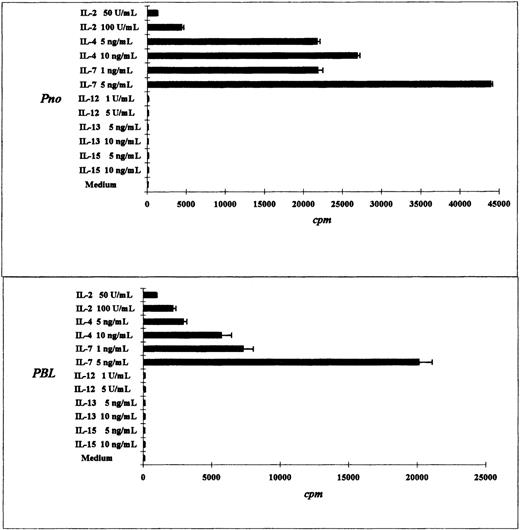
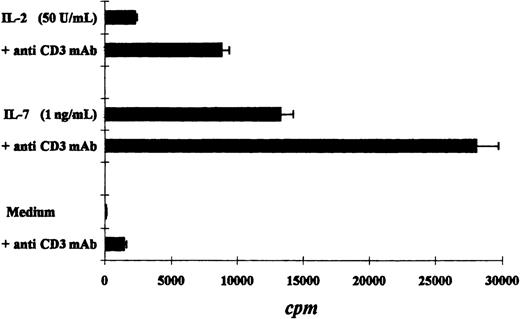
We compared the proliferative response of the Pno T cell line and patient PBLs to various cytokines. As expected, both the Pno cell line and the PBLs exhibited a strong dose-dependent proliferation in response to IL-7. In contrast, a weak proliferation was obtained with IL-2, and no proliferation was induced by IL-12, IL-13, and IL-15 (Figure 3A,B). It should be noted that the Pno cell line and the PBLs weakly differed in their ability to proliferate in response to IL-4, as the Pno cell line exhibited stronger proliferation in the presence of this cytokine. We next tested whether immobilized anti-CD3 mAbs were capable of increasing the Pno lymphocyte proliferation in response to IL-2 and IL-7. The results presented in Figure 4 show that triggering Pno CD3 molecules with specific mAbs resulted in an enhancement of IL-2– and IL-7–induced proliferative responses. It should be noted that immobilized anti-CD3 mAbs alone produced weak but significant proliferative responses in Pno lymphocytes. These results suggest that the CD3/TCR engagement in Pno lymphocytes was functional because it induced a proliferation and increased the response to exogenous cytokines including IL-2.
Tumor T-cell line Pno and patient PBLs proliferated highly in response to IL-7 and IL-4.
The results are expressed as the mean cpm plus or minus SD for tritiated thymidine incorporation by 50 × 103 cells during the last 18 hours of a 3-day culture.
Tumor T-cell line Pno and patient PBLs proliferated highly in response to IL-7 and IL-4.
The results are expressed as the mean cpm plus or minus SD for tritiated thymidine incorporation by 50 × 103 cells during the last 18 hours of a 3-day culture.
Immobilized anti-CD3 mAbs increased cytokine-induced proliferative responses of the tumor T-cell line Pno.
The results are expressed as the mean cpm plus or minus SD.
Immobilized anti-CD3 mAbs increased cytokine-induced proliferative responses of the tumor T-cell line Pno.
The results are expressed as the mean cpm plus or minus SD.
IL-7 prevented spontaneous apoptosis and maintained a high level of Bcl-2 expression in Pno lymphocytes
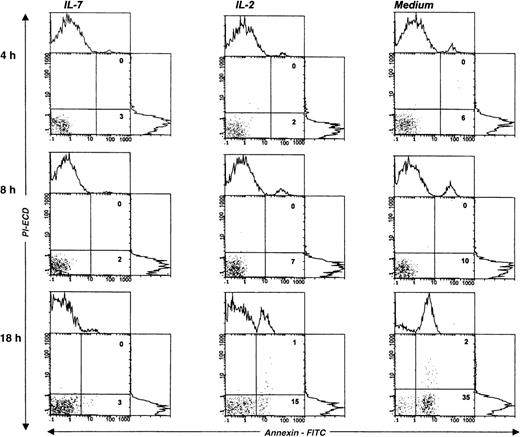
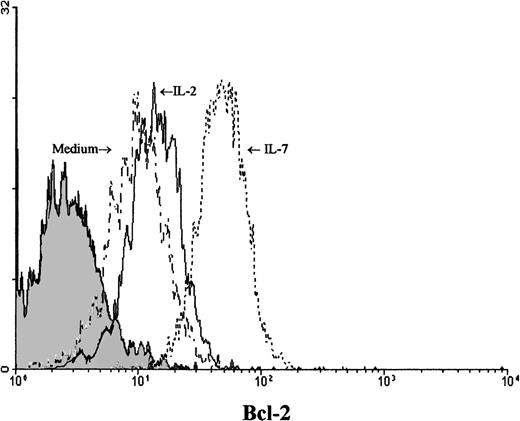
We next studied the survival kinetics of Pno cells cultured in complete medium with or without IL-7 or IL-2. Annexin binding was used to detect the loss of asymmetry of the cell membrane and the appearance of phosphatidylserine residues at the cell surface, which are relatively early cellular events during apoptosis.21 The results presented in Figure 5 indicate that after 18 hours of culture without cytokines, one third of the Pno cells showed annexin V binding, and less than 2% were necrotic cells (propidium iodide uptake). Parallel cultures with IL-2 alone contained 15% of annexin V+ cells, whereas culture with IL-7 failed to contain significant apoptotic cells. Thus, only IL-7 was efficient to prevent Pno lymphocytes from spontaneous apoptosis. Changes in the levels of expression of Bcl-2 have been shown to be correlated with protection from apoptosis in various T-cell populations.22Using flow cytometry to analyze the expression of Bcl-2 in single cells in the live gate, we found that Pno lymphocytes cultured with IL-7 gave a unique peak, with 100% positive cells (Figure6). After 18 hours of culture without IL-7, Bcl-2 expression in viable cells was significantly reduced. These results indicate that the Pno lymphocytes were viable, were able to proliferate, and maintained high levels of Bcl-2 when they were cultured with IL-7. In contrast, in the absence of IL-7, the lymphocytes were apoptotic and expressed low levels of Bcl-2. It is of note that when Pno lymphocytes were cultured with IL-2 alone, the level of Bcl-2 was significantly reduced.
IL-7 prevented spontaneous apoptosis of the tumor T-cell line Pno.
The staining of gated lymphocytes was done at various times of cell cultures, in complete medium with or without cytokines, and with annexin V (abscissa) and propidium iodide (PI) (ordinate). The percentage of apoptotic (annexin V+/PI−) and necrotic (annexin V+/PI+) cells are indicated in the corresponding square.
Viable Pno tumor T cells modulated expression of Bcl-2 in the presence of IL-7.
Intracellular Bcl-2 was measured after 18 hours of Pno lymphocyte culture in complete medium with or without cytokines. Forward and side scatter characteristics were used to gate the population of live T cells. The shaded histogram represents a negative control with the appropriate isotype coupled to FITC.
Triggering with anti-CD2, anti-CD3, and anti-CD28 mAbs induced Pno lymphocytes to proliferate and to express a Th3-type cytokine profile
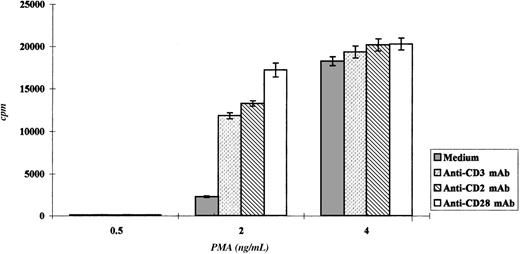
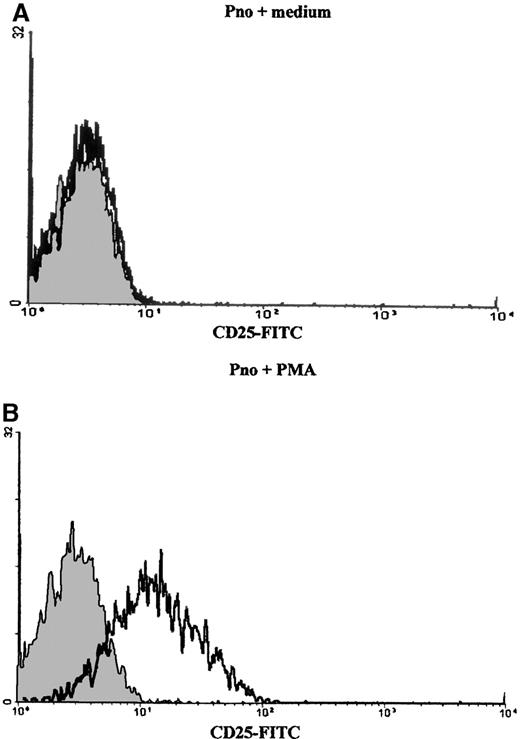
We studied the proliferation of Pno lymphocytes in response to a variety of activation stimuli. We found that the Pno lymphocytes failed to proliferate in response to soluble anti-CD3, anti-CD2 (antigen presenting cell–dependent [APC-dependent] mitogenic pair), and anti-CD28 mAb stimulation alone. In contrast, the combination of 2 ng/mL PMA with each of these soluble antibodies gave a significant proliferation (Figure 7). It must be noted that PMA alone, at a concentration of 2 ng/mL, induced a strong expression of CD25 molecules (Figure 8) and only a minor expression of lymphocyte proliferation (Figure 7). Thus, these results indicate that the CD3/TCR, CD2, and CD28 signaling pathways were functional. It should be noted that 4 ng/mL PMA was capable of inducing significant proliferation. We then studied the secretion of cytokines by the Pno lymphocytes and patient PBLs in response to a submitogenic dose of PMA alone or to the mitogenic combination of PMA/anti-CD3 mAb. The supernatants of the lymphocyte cultures were collected, and the amounts of IL-2, IL-4, IL-10, IFN-γ, and TGF–β1 were determined by ELISA, whereas the amount of TNF-α was determined using a biological assay. The results presented in Table3 showed that 2 ng/mL PMA alone, which induced very low proliferation (Figure 7), did not induce significant amounts of cytokine production. In contrast, the combination of PMA and soluble anti-CD3 mAb induced a significant production of TNF-α and TGF-β1, whereas only small amounts of IL-2 and IL-4 and no IL-10 and IFN-γ were detected in the supernatants. Interestingly, we found a similar Th3-type cytokine profile with the patient PBLs stimulated with PMA and anti-CD3 mAb.
Pno lymphocytes proliferated in response to CD2, CD3, and CD28 molecule stimulation.
The results are expressed as the mean cpm plus or minus SD.
Pno lymphocytes proliferated in response to CD2, CD3, and CD28 molecule stimulation.
The results are expressed as the mean cpm plus or minus SD.
Cytokine profile of Pno lymphocytes and patient PBLs
| PMA3-150 . | IL-2 (pg/mL) . | IL-4 (pg/mL) . | IFN-γ (U/mL) . | IL-10 (pg/mL) . | TNF-α (pg/mL) . | TGF-β1 (pg/mL) . |
|---|---|---|---|---|---|---|
| Pno | ||||||
| Medium | <10 | <10 | <0.1 | <10 | 30 | 40 |
| Anti-CD3 mAb | 44 | 48 | <0.1 | <10 | 118 | 523 |
| Patient PBL | ||||||
| Medium | <10 | <10 | <0.1 | <10 | <10 | <10 |
| Anti-CD3 mAb | 67 | 26 | <0.1 | <10 | 54 | 244 |
PMA was used at a final concentration of 2 ng/mL.
Discussion
Skin lesions in CTCL contain a heterogeneous lymphocytic infiltrate composed of malignant T cells, which are most often CD4+, and nonneoplastic tumor infiltrating T lymphocytes. We previously reported CD4+ cytotoxic tumor infiltrating lymphocytes directed specifically against autologous malignant CD4+cells.5 Thus, aside from the clonotypic TCR-Vβ chain expressed by the tumor cells, there has been no specific cell surface structure identified on CTCL. As a result, it is difficult to distinguish malignant from nonmalignant reactive CD4+lymphocytes. Ex vivo cultured CTCL lines producing unlimited amounts of clonal malignant lymphocytes would have several advantages including (1) the realization of functional and molecular studies in order to understand the biology of the disease and the mechanisms used by the malignant cells to escape to the immune response, (2) the identification of tumor-associated peptide antigens,10,23-26 and (3) the production of specific mAbs characterizing the tumor cells.27,28 In the present study, we report for the first time the functional characterization of a malignant T-cell line derived from the blood of a CTCL patient. Culture with IL-7, as previously reported,29 allowed the generation of an IL-7–dependent T cell line named Pno.
First, we demonstrated that both the malignant clone circulating in the patient blood and the derived cultured T-cell line were identical because they shared the same size and sequence of the TCRβ VDJ region. In addition, both types of cells had the TCR-Vβ22+CD4+CD8αα+ phenotype and were identical for their expression of a large number of surface antigens tested. The Pno lymphocytes and patient PBLs were also capable of responding to IL-4, whereas little responses were obtained with IL-2 despite the fact that they expressed CD122 and CD132. There were no responses found with various cytokines including IL-12 and IL-15.30 Recently, it was shown that IL-12–mediated signal transduction was depressed in patients with SS. This was determined because an IL-12 receptor β2 messenger RNA (mRNA) was not detected, and the levels of STAT4 were highly reduced.31 We found that IL-7 was capable of inducing strong proliferation and high levels of Bcl-2 and therefore prevented spontaneous apoptosis. Surprisingly, IL-2 alone did not prevent the Pno lymphocytes from apoptosis. This may be due to the fact that in the presence of IL-2, the Pno lymphocytes were not actively cycling. CD132 (IL-2Rγ) has been shown to inhibit activated T-cell apoptosis in a variety of situations.32-34 However, this is associated with increased expression of Bcl-2 and Bcl-XL and cell cycling.35 26
We next studied the function of Pno lymphocytes. The Pno lymphocytes were tested for their ability to respond to stimulation of various cell surface molecules including CD3, CD2, and CD28. It must be noted, as expected in the absence of APCs, soluble anti-CD3 mAbs were unable to induce Pno lymphocyte proliferation. Similar results were consistently obtained with normal purified PBL T lymphocytes or T-cell clones.36 In addition, as is the case for normal purified PBL T lymphocytes, the combination of PMA with soluble anti-CD3 mAbs induced a strong proliferation. These results indicate that the CD3/TCR molecules were functional in Pno lymphocytes. This was further supported by the fact that immobilized anti-CD3 mAbs induced a reproducible and significant proliferation that was considerably enhanced by exogenous IL-2 or IL-7. The mitogenic pair of anti-CD2 mAbs, CD2 × 11 and GT2, were originally described to induce proliferation of T lymphocytes only in the presence of monocytes.37 We found that Pno lymphocytes behaved like purified PBL T lymphocytes with respect to stimulation through CD2 molecules using CD2 × 11 and GT2 mAbs because together with PMA, they induced strong proliferative responses. In addition, the combination of PMA with anti-CD28 mAbs was also able to lead to Pno lymphocyte proliferation. Taken together, these results demonstrate that the malignant clonal Pno cell population behaved as normal circulating purified T lymphocytes in terms of CD3, CD2, and CD28 molecule triggering.
It has been reported that CTCL patients show a predominant type-2 immune response that might be responsible for several clinical and immunological abnormalities.38-40 Most of these studies were performed with unpurified CTCL lymphocytes or with so-called malignant cells isolated with an anti–TCR-Vβ mAb. However, reactivity with a single anti–TCR-Vβ mAb of a lymphocyte population is not sufficient to identify the malignant T-cell clone. We have shown that both reactive and malignant cloned T lymphocytes can express the same TCR-Vβ but different CDR3 sequences (Bagot et al, unpublished data, September 1999). Here, we quantified and compared the amount of cytokines secreted by both the Pno CTCL line and patient PBLs before and after anti-CD3 mAb stimulation. The results indicate that there were no differences in the type of cytokines secreted by fresh and long-term cultured patient PBLs. Whereas almost no cytokines were detected in the supernatants of PMA-stimulated malignant lymphocytes, the combination of PMA with anti-CD3 mAbs resulted in a low production of IL-2 and IL-4 and a high production of TNF-α and TGF-β1 in the supernatant. We never detected IFN-γ in the supernatant of both fresh and cultured malignant lymphocytes. The presence of TNF-α in the supernatants suggests that CTCL cells could prevent antitumor reactivity by killing the reactive lymphocytes. In addition, we found that the CTCLs were themselves protected because they were resistant to the lysis mediated by TNF-α (Echchakir et al, unpublished data, November 1999).
In contrast to the suppressor Tr1 clones that secrete large amounts of both IL-10 and TGF-β1,41 we found that Pno lymphocytes secrete a large amount of TGF-β1, but they do not secrete IL-10. The absence of or the small amounts of both IFN-γ and IL-4, together with the high secretion of TGF-β1, characterizes the Th3-type T-cell subset. This Th3 subset is found particularly in mucosa-associated lymphoid tissue. It provides help for IgA production, suppresses Th1/Th2 type responses, and plays a key role in the induction of oral tolerance.42-44 We previously reported another CTCL-derived long-term T-cell line with high amounts of TGF-β1 mRNA (Echchakir et al). In addition, in previous in situ studies45 of cytokine production in CTCLs, an apparent absence of significant IL-4 mRNA production has been noted, which argues against a proliferation of typical Th2 cells. The expansion of these TGF-β1–producing cells during tumor progression would explain the inhibition of specific antitumor immune response. Indeed, the immunosuppressive effect of TGF-β1 on the proliferation, differentiation, and activation of the cytotoxic T lymphocyte (CTL) response has been previously reported in several tumor models.46-51 The functional inhibitory capacity of TGF-β1 involved inhibition of IL-12, the cytokine essential for CTL generation and potentiation, and IL-2 signaling.52,53 Clinical trials have shown that recombinant human IL-12 (rhIL-12) administration in CTCL patients induced regression of the lesions and increased antitumor CTL responses.54
Finally, as shown in this report, the possibility of culturing malignant lymphocytes from CTCL or SS provides a unique opportunity to study the biology of CTCL cells in vitro. As we already reported, these malignant T-cell lines represent an essential tool for expanding specific autologous cytotoxic lymphocytes in order to identify MHC class I–associated tumor antigens. In our previous study, we failed to develop cell lines with several other patients. Consequently, the use of cytokines, such as IL-2 and/or IL-7, does not always lead to the growth of long-term CTCL cell lines. Therefore, it will be important to study the biology of CTCL cells and understand the reasons why it is difficult to grow CTCL cell lines in most patients.
Supported by grants from INSERM, Paris, France; Association de la Recherche contre le Cancer, Villejuif, France; Société Française de Dermatologie, Paris, France; Laboratoires La Roche Posay, LaRoche-Posay, France; and Académie de Médecine, Paris, France.
E.P. and M.B. contributed equally to this work.
Reprints:Armand Bensussan, INSERM 448, Faculté de Médecine de Créteil, 8 rue du Général Sarrail, 94010 Créteil, France; e-mail: bensussan@im3.inserm.fr.
The publication costs of this article were defrayed in part by page charge payment. Therefore, and solely to indicate this fact, this article is hereby marked “advertisement” in accordance with 18 U.S.C. section 1734.

This feature is available to Subscribers Only
Sign In or Create an Account Close Modal