Abstract
Through the application of the NIH/3T3 tumorigenicity assay to DNA from a gastric carcinoma, we have identified a novel transforming gene, designated myeov (myeloma overexpressed gene in a subset of t[11;14]-positive multiple myelomas). Sequence analyses did not reveal any homology with sequences present in the GenBank, except the deduced protein structure predicts a transmembrane localization.Myeov was mapped to chromosome 11q13 and localized by DNA fiber fluorescence in situ hybridization (FISH) 360-kilobase (kb) centromeric of cyclin D1. In 3 of 7 multiple myeloma (MM) cell lines with a t(11;14)(q13;q32) and cyclin-D1 overexpression, Northern blot analysis revealed overexpression of myeov as well. In all 7 cell lines, the translocation breakpoint was mapped within the 360-kb region between myeov and cyclin D1. DNA fiber FISH with a contig of probes covering the constant region of the immunoglobulin heavy chain (IgH) revealed that exclusively in the 3myeov-overexpressing cell lines (KMS-12, KMS-21, and XG-5), either the 5′ Eμ enhancer or the most telomeric 3′ E enhancer was juxtaposed to myeov. Although cyclin D1overexpression represents a characteristic feature of all MM cell lines with t(11;14), our results demonstrate aberrant expression of a second putative oncogene in a subset of these cases, due to juxtaposition to IgH enhancers. The clinical relevance of this dual activation remains to be elucidated.
Illegitimate activity of the recombination machinery is a frequent cause for chromosomal aberrations associated with various B- and T-cell leukemias.1 Translocations involving the immunoglobulin heavy chain (IgH) locus at 14q32.3 are mediated by errors during VDJ-recombination that occur early in development or during class-switch recombination at later stages in B-cell development. The IgH locus contains 2 major types of enhancers: (1) the 5′-IgH intronic μ enhancer (Eμ) that is located between the JH and switch μ sequences, and (2) the 3′ enhancers that are located downstream of each constant-α (Cα) region, Eα1 and Eα2.2,3 In mantle cell lymphomas and follicular lymphomas carrying the t(11;14)(q13;q32) and t(14;18)(q32;q21), respectively, the corresponding oncogenes cyclin D1 and bcl-2 are deregulated because of the juxtaposition to the IgH-5′ Eμ enhancer.4 In sporadic Burkitt's lymphomas, the t(8;14)(q24;q32) leads to deregulation of the myc oncogene because of an illegitimate switch recombination and joining onto the 3′-IgH Eα enhancers.5,6 Translocations involving band 14q32 occur in approximately 20% (karyotype analysis), up to 70% (fluorescence in situ hybridization [FISH]) of multiple myelomas (MM) and plasma cell leukemias (PCL).7-16 The translocations to the IgH locus at 14q32 primarily involve IgH switch regions and various translocation partners.17 Four loci are most frequently involved: cyclin D1/BCL1 on 11q13 in about 30% of the cases,7-13,15,16FGFR3 on 4p16,14,16,18MUM/IRF4 on 6p25,19 andc-maf on 16q23.13,16,20 As a consequence of the translocation to the switch regions, these genes are brought in the proximity of the 3′ Eα enhancers of the IgH locus and, consequently, are up-regulated. Translocations to any of the switch regions separate the IgH-5′ Eμ and the IgH-3′ Eα enhancers and, theoretically, can simultaneously activate 2 different genes on the 2 reciprocal chromosomes. Indeed, in case of t(4;14), 2 genes, FGFR3 and MMSET/WHSC1, are simultaneously dysregulated by the Eα enhancers on der(14) and the Eμ enhancer on der(4), respectively.21 22
Recently, we reported the identification of a novel transforming gene that was isolated by the NIH/3T3 tumorigenicity assay with DNA from a gastric carcinoma.23 Here we describe the isolation and characterization of the full-length complementary DNA (cDNA) of this gene designated myeov, its deduced 313–amino acid protein sequence, and its chromosomal location. Because myeov maps in the vicinity of cyclin D1 on 11q13, we evaluated expression ofmyeov in MM cell lines with t(11;14)(q13;q32). Althoughcyclin D1 was overexpressed in all t(11;14)-positive cell lines, we observed additional myeov overexpression in a subset of the t(11;14)-positive MM cell lines. This was caused by an aberrant class-switch event joining both myeov and cyclin D1 to separate IgH enhancers.
Materials and methods
Cell culture
The MM cell lines ANBL-6, ARK, FLAM-76, H1112, JIM3, JJN3, KMM-1, KMS-11, MM.1, MM-S1, OCI-My-5, OPM-2, SK-MM-1, SK-MM-2, U266,17 and EJM19 were described previously. XG-1, XG-2, and XG-5 were obtained from Dr B. Klein (Montpellier, France) and Dr S. Raynaud (Nice, France), KMS-12 and KMS-21 from Dr T. Otsuki (Okayama, Japan), FR4 from Dr S. Tagawa (Osaka, Japan), KHM-1 and KHM-11 from Dr H. Matsuzaki (Kumamoto, Japan), and LB84-1 from Dr I. van Riet (Brussels, Belgium). The other MM cell lines (HL407, HL461, L363, LP-1, MM-S4, MOLP2, MOLP3, NCI-H929, RPMI-8226, UTMC2), as well as the non-MM cell lines in this study (Figure1), were obtained from the German Collection of Microorganisms and Cell Cultures (Braunschweig, Germany). MM and leukemia cell lines were grown in RPMI 1640, supplemented with 10% to 20% fetal calf serum as indicated by the supplier. The 5 mantle cell lymphomas (p11, p14, p26, p29, and p252) were described previously.24-26
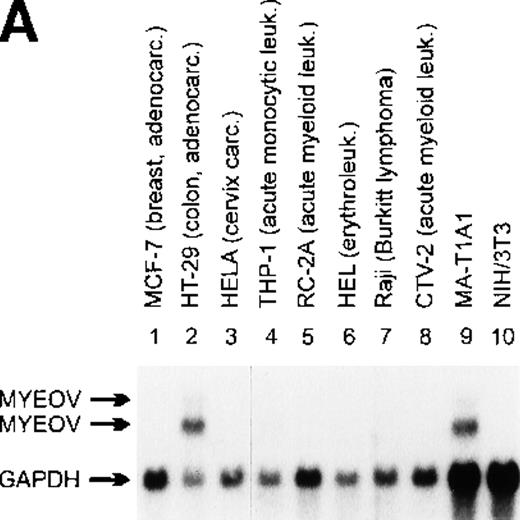
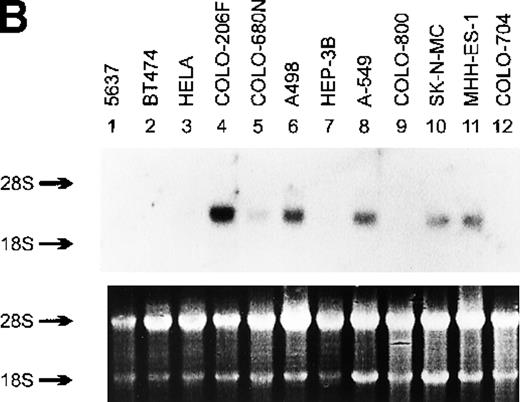
Northern blot analysis of myeov gene expression in various tumor cell lines of human malignancy, a third-cycle mouse tumor (MA-T1A1) and NIH/3T3 recipient cells.
The purported or actual malignancy of the tumor cell lines are as follows: MCF-7, breast adenocarcinoma; HT-29, colon adenocarcinoma; HeLa, cervical carcinoma; THP-1, acute myeloid leukemia (M5); CCRF-CEM, T-cell acute lymphoblastic leukemia; HEL, acute myeloid leukemia (M6); Raji, Burkitt‘s lymphoma; CTV-2, acute myeloid leukemia (M5); 5637, bladder carcinoma; BT474, breast adenocarcinoma; COLO-206F, colon adenocarcinoma; COLO-680N, esophagus squamous cell carcinoma; A498, renal carcinoma; HEP-3B, hepatocellular carcinoma; A-549, lung adenocarcinoma; COLO-800, melanoma; SK-N-MC, neuroblastoma; MHH-ES-1, Ewing’s sarcoma; COLO-704, ovarian adenocarcinoma. Ten micrograms of total RNA isolated from the indicated cell lines, MA-T1A1 tumor cells (lane 9 in A) and NIH/3T3 cells (lane 10 in A), was submitted to Northern transfer. (A) Filters were hybridized simultaneously with a32P-labeled myeov cDNA insert and a murine glyceraldehyde 3-phosphate dehydrogenase (GAPDH) probe. Bothmyeov transcripts of 2.8 and 3.5 kb and the GAPDH transcript are indicated at the left side. Almost equal amounts of RNA were loaded in each lane as indicated by the GAPDH hybridization. The stronger hybridization of the 2 murine RNAs (MA-T1A1 and NIH/3T3, lanes 9 and 10) can be explained by the weaker hybridization of the murine GAPDH probe to the human homolog. (B) Filters were hybridized with the samemyeov cDNA insert; 28S and 18S ribosomal RNA were used as molecular weight markers. The lower panel shows the ethidium bromide-stained gel as a control for the amount of RNA loaded in each lane.
Karyotypes
The following cell lines with a t(11;14)(q13;q32) were selected for this study: XG-1 and XG-5,27 KMS-12,28 SK-MM-2, H1112, and FLAM-7617 and KMS-21 (Otsuki et al; manuscript in preparation). The MM cell line XG-2 was originally reported with a complex t(5;11;14)(q31;q13;q32), but FISH with BCL1/11q13 probes revealed a breakpoint far away from the BCL1/11q13 region27; this is consistent with our finding that its translocation breakpoint maps outside the 750-kilobase (kb) region surrounding cyclin D1 (data not shown). All other MM cell lines were not reported to harbor translocations involving the 11q13 region.
Isolation of a full-length myeov cDNA
A lambda gt10 cDNA library was constructed from polyA+RNA of a gastric carcinoma (MA)–induced tertiary MA-transfectant (MA-T1A1) and screened with the 400-base pair (bp) exon-trap fragment.23 Normal human MA cDNA clones were isolated from a human HeLa cervix carcinoma cell line cDNA library (Clontech, Heidelberg, Germany). Respective clones were plaque purified and the insert DNA was cloned into the EcoR I site of the pT7T3 plasmid vector (Amersham Pharmacia Biotech, Freiburg, Germany). The nucleotide sequence was determined by the dideoxy chain termination method using an ALF-Express (Amersham).
Computer search and programs
Sequence analysis was evaluated with the University of Wisconsin Genetics Computer Group (GCG) sequence analysis package (version 10.0) and with various server facilities; (BLAST;http://www.ncbi.nlm.nih.gov/), (PSORT, http://psort.nibb.ac.jp), BLOCKS (http://www.blocks.fhrc.org), PRODOM (http://www.toulouse.inra.fr/prodom.html), PRINTS (http://www.biochem.ucl.ac.uk/bsm/dbbrowser/), SMART (http://coot.EMBL-Heidelberg.de/SMART), PFAM (http://genome.wustl.edu/pfam), SOSUI (http://www.tuat.ac.jp/∼mitaku/adv_sosui/), TMPRED, PROFILESCAN and PROSITESCAN (http://ulrec3.unil.ch/software/), and PREDICTPROTEIN (http://www.embl-heidelberg.de/predictprotein/).
Northern blot analysis
Total RNA was isolated and purified using urea/LiCl as described previously25 or with TriZol (purchased from GIBCO BRL, Gaithersburg, MD). Northern blot analysis and stripping of the filters were performed as described previously.23,25 Briefly, 10 μg of total RNA was loaded on a 1% to 1.5% agarose gel and blotted onto Nytran 13N membranes (Schleicher & Schuell, Dassel, Germany). RNA filters were hybridized in 3 × SSC (0.45- mol/L sodium chloride, 0.045-mol/L sodium citrate), 5 × Denhardt's, 200 μg/mL−1 denatured salmon sperm DNA, 1% sodium dodecylsulfate (SDS), and 10% dextran sulfate with32P-dCTP–labeled probes at 63°C for 16 hours. Filters were extensively washed in 3 × SSC, 0.1% SDS, and once in 0.1 × SSC, 0.1% SDS at 63°C. Filters were exposed to Kodak X-Omat DS film at −70°C with Ilford intensifier screens. As probes, we used a 1.1-kb 5′ myeov cDNA EcoRI fragment, a 3′-end PRAD1/cyclin D1 probe,29 and for equal RNA loading, a 400-bp murine glyceraldehyde 3-phosphate dehydrogenase (GADPH) cDNA fragment.
RT-PCR analysis of myeov cDNA
Five micrograms of total RNA from a third cycle MA-transfectant were transcribed into cDNA with random hexamers and the Superscript RT, as recommended by the manufacturer (Gibco BRL, Karlsruhe, Germany). One tenth of the cDNA reaction mixture was used in a 100-μL polymerase chain reaction (PCR) reaction with 40-pmol primers and 1-unit Taq polymerase (Amplitaq DNA Polymerase, Perkin Elmer Applied Biosystems, Weiterstadt, Germany). Amplifications were performed in an automated PCR processor (BioMed, Theres, Germany) as follows: 35 cycles comprising denaturation at 92°C for 30 seconds; annealing at 56°C for 60 seconds; primer extension at 72°C for 90 seconds, with an initial denaturation step at 92°C for 3 minutes; and a final extension step at 72°C for 10 minutes. PCR products were electrophoresed in a 2.5% agarose gel and stained with ethidium bromide. For the detection of the alternatively spliced myeovmRNAs, the following primers were used: MA-14BU1 (5′-CCAGTGCTTTCACCAGC-3′) and MA-mg2 (5′-GCGCCCACATAATTTCC-3′).
Chromosomal in situ hybridization
For FISH, we used a 15-kb genomic fragment harboring themyeov gene. Phage DNA was labeled by nick-translation with biotin-16–dUTP. Hybridization was performed on human metaphase chromosome preparations as described previously by Lichter and Cremer.30 The biotinylated λ phage clone was detected using avidin conjugated to fluorescein, and signals were amplified once.31 Chromosomes were counterstained with 4′-6′-diamidino-2-phenylindole (DAPI) and propidium iodide. Chromosomes were analyzed by digital fluorescence microscopy using a Zeiss Axiophot microscope, coupled to a cooled charge-coupled device (CCD) camera (Photometrics, Munich, Germany) equipped with a Kodak 1400 chip.
Interphase FISH
Interphase FISH for detection of t(11;14)(q13;q32) was performed with 2 combinations of cosmid probes: (1) a centromericBCL1/11q13 cosmid (cos6.7) in combination with cosmid cosH1.5 located just telomeric of cyclin D1,32 and (2) cos6.22 carrying the cyclin D1 gene with cosIg6 (from T.H. Rabbitts, MRC, Cambridge, UK) covering the IgH constant gene region.33 Cell lines that show both segregation of the cos6.7/cosH1.5 signals and colocalization of the cos6.22/cosIg6 signals in the majority of 200 evaluated nuclei were considered to carry aBCL1/11q13-IgH breakpoint. Interphase nuclei were prepared and FISH was performed as described elsewhere (Vaandrager et al, submitted for publication). Probes were labeled with biotin-16-dUTP or digoxygenin-11-dUTP (Roche, Mannheim, Germany) by standard nick-translation. Hybridization, immunodetection, and fluorescence microscopy were performed as described previously.26 33
Fiber FISH
DNA fibers were prepared as described previously.26,33Immunodetection and fluorescence microscopy were the same as for interphase FISH. To generate a physical map of the BCL1/11q13 region using DNA fiber FISH, various combinations of DNA clones labeled with either biotin or digoxygenin were hybridized and mapped relative to our previously described set of probes, consisting of P1 clones ICRF700B1587 and ICRF700J0777 and cosmid cos6.22.26,34 The hybridization signal of cos6.22, cos3.62, and cos3.91 with a total length of 113.4 kb, based on restriction mapping35 was used as an internal standard. For the location of myeov, 3 genomic fragments subcloned from the original alu-positive genomic lambda phage clone (genome/18935T1A1 harboring myeov coding sequences) were used: a 2.1-kb EcoRI/SalI fragment (15RS2.1/4600, most 5′-clone), a 1.8-kb EcoRI fragment (10RR1.8/4599), and a 4.5-kb EcoRI fragment (19RR4.5/4598, most 3′-clone) (all in pT7T3). To generate a contig of overlapping clones of the centromeric BCL1/11q13 region, several available and newly generated plasmid, cosmid, P1, and YAC clones reported to map in this region were used: plasmids p11EH and MTC-BCL1a24; cosmids cosH1.5, cos6.31, cos3.3, cos6.7, and cos3.5135; plasmid BCL1/P1.7 (Brookes and Peters, unpublished results); cosmids cCL11-44 and cCL11-505 (JBRC, Tokyo, Japan); YAC yA7D7 (from St Louis Library) and cosmid cCL-GW5536; and 3 P1 clones (9105/11q13, 9106/11q13, and 9107/11q13) obtained by screening a P1-library with 11q13 sequences linked to the Sγ breakpoint in SK-MM-2.37
For mapping of t(11;14) breakpoints in MM, fiber preparations were hybridized with a combination of 11q13 probes and IgH probes. TheBCL1/11q13 probe set consisted of cosmid cCL11-505, a pool of the 3 myeov genomic plasmid subprobes, (19RR4.5/4598, 10RR1.8/4599, and 15RS2.1/4600) P1 clones ICRF700B1587 and ICRF700J0777, and cosmids cos6.22. The IgH probe set (cosmid clones cosU2-2, cos3/64, and cosIg6 and plasmid probes for Cα and Cγ4) was described in detail recently.33 For detection of the μ-enhancer, a 2.7-kb probe Eμ was made by PCR with primers 5′-GTAAGAATGGCCACTCTAGG-3′ and 5′-CTAAAGCCATCTCATTGCCG-3′. This probe was hybridized together with combinations of 11q13 and IgH probes.
GenBank/EMBL accession number
The sequence of the myeov cDNA has been deposited at the EMBL-database under the accession number AJ223366.
Results
Identification and characterization of myeov
Application of the NIH/3T3-transformation/tumorigenicity assay to DNA of a gastric carcinoma (MA) induced tumors in nude mice.23 DNA of a tertiary transfectant was cloned into the EMBL-3 phage vector and probed for human sequences using human alu-repetitive sequences. Exon-trap analysis of genomic subfragments of alu-positive phages revealed a novel sequence with no homology with sequences present in the GenBank.23 Consecutively this 400-bp exon-trap fragment was used for the Northern blot analysis. A prominent 2.8-kb transcript and a weaker RNA species of 3.5 kb were detected in RNA of the third cycle transfectant (MA-T1A1) but not in normal NIH/3T3 cells (Figure 1A, lanes 9 and 10). Similarly sized transcripts were detected in various human tumor cell lines (Figure 1A and B). Subsequently, a cDNA library of the tertiary transfectant was screened with this exon-trap fragment as a probe and it enabled us to identify various positive plaques. Nucleotide sequencing of different cDNA clones representing the 2.8-kb transcript revealed minor splice variants (50- to 200-bp difference), which explains the relatively broad 2.8-kb band after Northern blot analysis. The presence of these minor splice variants was also observed by RT-PCR analysis in human cell lines expressing myeov (data not shown). Because this novel putative transforming gene might be implicated in a subset of human multiple myelomas with a typical t(11;14), the gene was assigned the name myeov (HUGO/GDB Nomenclature Committee) forMYEloma OVerexpressed (in a subset of t[11;14]-positive multiple myelomas).
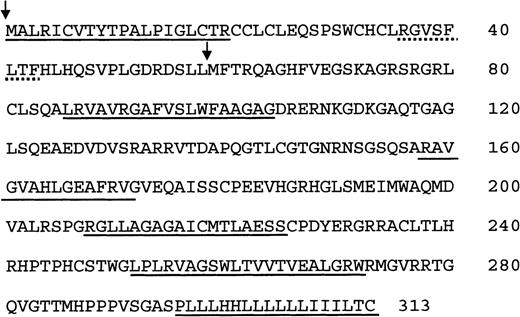
Sequence analysis of several MA-T1A1 cDNA clones revealed the presence of 2 potential open reading frames, 1 of 313 amino acids and a shorter product of 255 amino acids starting with an suboptimal (CTCATGG) and an imperfect (CTCATGT) Kozak sequence, respectively (Figure2).38 The numerous minor splice variants encode either the longer or the shorter product. A sequence homology search for other sequences in the DNA databank, using the full-length 2483-bp cDNA nucleotide (accession number AJ223366) and the deduced protein sequence, was negative, except for 6 expressed sequence tags (ESTs) that are identical to the 3′ end of our cDNA. Extended computer searches for homology with functional domains or protein motifs were negative, except for the detection of an RNP-1 motif present in various RNA-binding proteins39 and some relatively short hydrophobic regions that might function as transmembrane helices (Figure 2). Furthermore, the leucine–isoleucine tail of the protein shows similarities with a class of cytoplasmically exposed membrane proteins with a C-terminal membrane anchor.40
The deduced myeov protein sequence.
Start sites of the 2 possible translation products are marked with an arrow in front of the methionine start codon. An RNP-1 motif is indicated by a dotted line. The 6 regions that might function as a transmembrane domain are underlined.
The deduced myeov protein sequence.
Start sites of the 2 possible translation products are marked with an arrow in front of the methionine start codon. An RNP-1 motif is indicated by a dotted line. The 6 regions that might function as a transmembrane domain are underlined.
Localization of myeov at chromosome 11q13 in the vicinity of the cyclin D1 oncogene
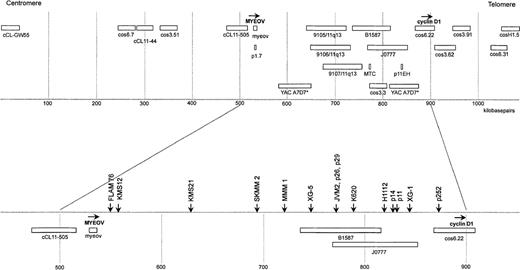
The original alu-positive genomic lambda phage clone (genome/18935T1A1) harboring myeov coding sequences was used as a probe to determine the chromosomal localization using FISH on banded metaphase chromosomes. Myeov was mapped on chromosome 11 band q13.1 (data not shown). Different regions within this band are involved in a variety of disorders, including (1) translocations in mantle cell lymphoma, multiple myeloma, and renal oncocytoma, (2) deletions in multiple endocrine neoplasia type I, and (3) DNA amplification in carcinoma of the head/neck, lung, esophagus, bladder, and breast.41,42 To determine the localization of themyeov gene in more detail, we used DNA fiber FISH with the 3 genomic myeov subfragments (clones 19RR4.5/4598, 10RR1.8/4599, and 15RS2.1/4600). In addition, we extended our previously reported 200-kb BCL1/11q13 fiber-FISH contig26 to 1100 kb using DNA fiber FISH with available and newly generated cosmid, P1, and YAC clones (Figure 3, upper panel). This fiber-FISH map is in good agreement with mapping data obtained with pulse-field gel electrophoresis.35 In thisBCL1/11q13 map, we located myeov 14-kb telomeric of cosmid cCL11-505 (Figure 3), implicating that myeov andcyclin D1 are approximately 360 kb apart.
Map of the myeov–cyclin D1 region at 11q13, constructed by fiber FISH.
The map is an extended version of the previously reported fiber-FISH map.26 The scale was based on restriction mapping of the cosmids cos 6.22, cos 3.62, and cos 3.91, which together were used as internal standard of 113.4 kilobase (kb).35 All available probes in the region are shown in the top part of the figure (see “Materials and methods”). Myeov was detected using a pool of the 3 subclones. The transcriptional orientation of themyeov and cyclin D1 genes is indicated with horizontal arrows. Hybridization of YAC A7D7* revealed an internal deletion that is apparent as 2 separate, discontinuous signals. The bottom part shows the localization of translocation breakpoints in 7 MM cell lines and 5 mantle cell lymphomas (p11, p14, p26, p29, and p252) as determined by fiber FISH. Mapping of the mantle cell lymphoma breakpoints has also been described previously.26
To determine the transcriptional orientation of the myeov gene, we performed fiber-FISH mapping with the 5′ and 3′ genomic subclones (respectively, 15RS2.1/4600 and 19RR4.5/4598) in different colors, combined with cosmid clone cCL11-505. The 5′ subclone (15RS2.1/4600) was closest to cCL11-505 and also overlapped with probeBCL1/p1.7 by Southern blot analysis. BCL1/p1.7 was originally identified from a NotI-jumping library by screening with theMTC/BCL1a probe and was considered to represent a CpG island located 5′ of a putative gene, approximately 350-kb centromeric of cyclin D1 (Brookes and Peters, unpublished results). All these data together suggest that myeov has the same transcriptional orientation as the cyclin D1 gene.
Overexpression of myeov in a subset of t(11;14)-positive multiple myelomas
Northern blot analysis of RNAs from various human cell lines revealed expression of 2.8- and 3.5-kb myeov transcripts in numerous tumor cell lines of divergent cellular origin (eg, Figure 1A and B). A mouse myeov transcript was not detected (Figure 1A, lane 10), either because the gene is normally not transcribed in mouse NIH/3T3 cells or, more likely, because of its lack of sequence conservation during evolution, as revealed by Zoo blot analyses under low-stringency hybridization conditions (data not shown). We hybridized Northern blots containing poly-A+ RNAs from 23 different human tissue samples (Clontech) with an myeov cDNA probe. The gene is expressed in various tissues, albeit at very low levels (data not shown).
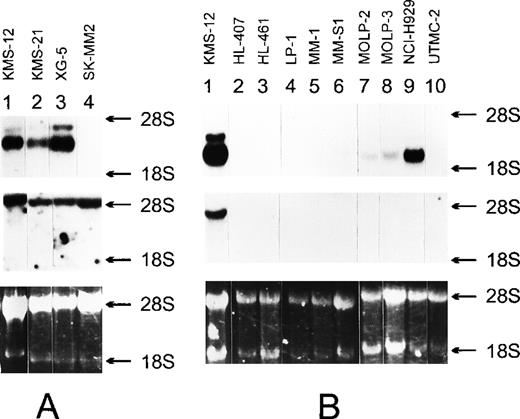
As reported previously,43 the breakpoint on 11q13 in the MM cell line KMS-12 was mapped 330 kb centromeric from the cyclin D1 gene and immediately telomeric of cosmid cCL11-505. Using DNA fiber FISH, we were able to map myeov approximately 10-kb centromeric of the breakpoint in the KMS-12 cell line (Figure 3, lower panel). In this cell line, an illegitimate recombination of the IgH-Sγ2 switch region juxtaposes JH sequences, including the 5′ Eμ enhancer to the translocation allele harboring cCL11-505.37 43 The combined mapping data suggested thatmyeov becomes activated because of its juxtaposition to the Eμ enhancer. As compared with non-MM cell lines, KMS-12 shows very high levels of myeov expression. To evaluate expression levels of myeov in other MM cell lines and its relation to the presence of the t(11;14), we performed Northern blot analysis on a series of 35 MM cell lines, including 7 cases with t(11;14)(q13;q32) (FLAM-76, H1112, KMS-12, KMS-21, SK-MM-2, XG-1, and XG-5) and 28 cases without this translocation (ANBL-6, ARK, EJM, FR4, HL407, HL461, JIM3, JJN3, KHM-1, KHM-11, KMM-1, KMS-11, L363, LB84-1, LP-1, MM.1, MM-S1, MM-S4, MOLP2, MOLP3, NCI-H929, OCI-My-5, OPM-2, RPMI-8226, SK-MM-1, U266, UTMC2, and XG-2). Among the 7 cell lines carrying a t(11;14), overexpression of myeov was observed in 3 MM cell lines, namely, KMS-12, XG-5, and KMS-21 (Figure4A, upper panel). Cyclin D1expression was detected in all of them (Figure 4A, middle panel). Most MM cell lines without t(11;14) showed no detectable or very lowmyeov expression levels, and in 3 MM cell lines (NCI-H929, L363, and KHM-11), moderate expression levels were detected (Figure 4B, upper panel). In the latter cell lines, cyclin D1 was not expressed (Figure 4B, middle panel). Interphase FISH with various probes, spanning a region of 550-kb centromeric of myeov and 250-kb telomeric of cyclin D1 flanked by markers cCL-GW55 and cosH1.5 (Figure 3, upper panel), revealed no breakpoint in the NCI-H929 and L363 cell lines.
Northern blot analysis of the 3 MM cell lines that show high expression of both myeov and cyclin D1 (A) and other MM cell lines (B).
Ten micrograms of total RNA isolated from the indicated cell lines was submitted to Northern transfer. The filters were independently hybridized to a 32P-labeled myeov cDNA insert (upper panel), and a cyclin D1 cDNA insert (middle panel). 28S and 18S ribosomal RNA were used as molecular weight markers. An ethidium bromide–stained gel indicates the amount of RNA loaded into each lane (lower panel).
Overexpression of myeov caused by juxtaposition to an IgH-enhancer
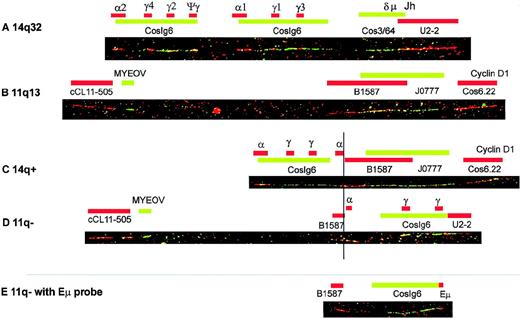
To resolve why only 3 of 7 MM cell lines with a t(11;14)(q13;q32) showed myeov expression, whereas all overexpressed thecyclin D1 gene, we determined the localization of the 11q13 and 14q32 breakpoint and especially the position of the various IgH enhancers relative to myeov and cyclin D1. First, interphase FISH was performed with the 2 cosmids flanking themyeov–cyclin D1 region (respectively, cos6.7 and cos3.62; Figure 3, upper panel). In 6 cases, segregation of these 2 cosmids was observed, indicative of a translocation in this region. In the SK-MM-2 cell line, cosmid cos3.62 (localized just telomeric of cyclin D1) was present twice, whereas the centromeric cosmid (cos6.7) was present only once. Because cosmid cos6.7 colocalized with 1 of the cos3.62 signals and thus represents the normal allele, this observation suggests that the breakpoint occurred between the 2 cosmids with simultaneous loss of the centromeric allele. By using DNA fiber FISH with a combination of BCL1/11q13 and IgH probes,26,34 the position of the breakpoints within the 360-kb myeov–cyclin D1 region was fine mapped (Figure 3, lower panel). Location of PAC clones (9105/11q13, 9106/11q13, and 9107/11q13) that were isolated by hybridization with a probe representing 11q13 sequences linked to the Sγ breakpoint in SK-MM-237 by DNA fiber FISH, confirmed the location of the SK-MM-2 breakpoint in theBCL1/11q13 region (Figure 3). The use of a contig of clones covering the JH/constant region of the IgH locus enabled us to determine exactly what part of the IgH locus was joined to each respective translocation allele. At the same time, it allowed us to study the class-switch recombinations within the IgH locus linked to the BCL1/11q13 allele. An example of such an analysis for the XG-5 cell line is illustrated in Figure 5. To find out whether the Eμ enhancer is juxtaposed either tomyeov or to cyclin D1, we performed independent fiber-FISH experiments using a PCR-generated Eμ probe in combination with 11q13 and other IgH probes (Figure 5 and Figure6, upper panel). A summary of these fiber-FISH experiments for all 7 cell lines with t(11;14) is shown in Figure 6 (lower panel).
Example of t(11;14) breakpoint analysis by DNA fiber FISH of the XG-5 cell line.
Red and green bars represent probes detected with Texas Red and FITC, respectively. Overlapping areas of Texas Red– and FITC-stained probes turn into yellow. From top to bottom, the following DNA fibers are shown: (A) a normal 14q32/IgH locus, (B) a normal BCL1/11q13 locus, (C) the 14q+ translocation product containing the cyclin D1 gene as observed in the XG-5 cell line, and (D and E) the 11q-product containing myeov in XG-5. Fibers A through D show hybridization patterns obtained with the standard IgH and 11q13 probe sets as described in “Materials and methods.” Fiber E, representing the 11q-product, shows the hybridization pattern of a combination of IgH and 11q13 probes optimized for visualization of the Eμ-enhancer probe in this particular cell line. For XG-5, this probe set consisted of the 2.7-kb Eμ probe, 11q13 P1 B1587, and IgH cosmid cosIg6.
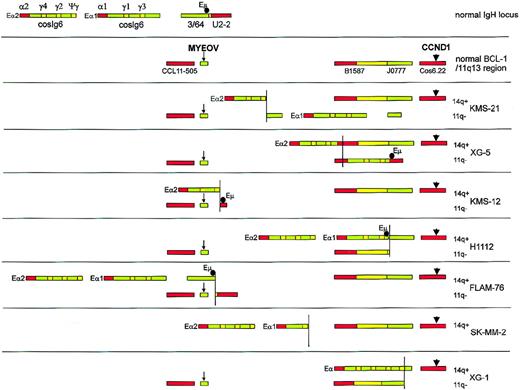
Overview of the results of fiber-FISH mapping of t(11;14) breakpoints in 7 MM cell lines.
Red and green bars represent probes detected with Texas Red and FITC, respectively; yellow indicates areas of overlapping Texas Red– and FITC-stained probes. The top 2 color bar codes show the normal IgH/14q32 and BCL-1/11q13 loci. For each cell line, both 14q+ and 11q-fusion products are shown, and the myeov andcyclin D1 genes are indicated with a small arrow and a larger arrowhead, respectively. The position of the Eμ enhancer, as determined using an Eμ-specific probe in separate experiments, is indicated with a black circle. The position of the 3′ Eα enhancers was not determined by hybridization with a specific probe, but was derived from the presence of the Sα/Cα plasmid probe. Where 2 Sα/Cα probe signals are present, the enhancers associated with upstream signals and downstream signals are labeled Eα1 and Eα2, respectively.
With respect to the 3 cell lines showing myeov overexpression, the following conclusions from the translocation pattern can be drawn: In KMS-21, IgH-Cγ/α signals were detected on both translocation alleles, indicating a switch breakpoint (probably at Sγ2) without concurrent class-switch deletion. Consequently, this results in juxtaposition of the Eα1 enhancer sequences to myeov and the Eα2 enhancer to cyclin D1. In XG-5, the hybridization pattern suggested a break at Cα1/Sα1 juxtaposing Eα enhancer sequences tocyclin D1 (Figures 5 and 6). Hybridization with the Eμ enhancer probe revealed its localization on the myeovtranslocation allele. As previously reported,43 fiber-FISH analysis revealed a breakpoint at switch gamma sequences in KMS-12, resulting in a juxtaposition of the Eα enhancer to cyclin D1. Using radiation-reduced hybrids, we previously reported that switch gamma sequences were linked to 11q13 sequences.37Additional hybridizations with the Eμ enhancer probe showed that this enhancer was indeed joined to myeov. Taken together, the simultaneous overexpression of both myeov and cyclin D1in the 3 MM cell lines (KMS-21, XG-5, and KMS-12), corroborates the identification of IgH-enhancer sequences on both translocation alleles.
On the contrary, in the H1112 and FLAM-76 cell lines, a rearrangement in the JH region or its immediate vicinity was observed resulting in juxtaposition of the two 3′ Eα and the 5′ Eμ enhancers to cyclin D1, whereas no enhancers were brought in the vicinity of myeov. As expected from our interphase FISH results, only 1 translocation allele harboring cyclin D1 and IgH sequences was identified in the SK-MM-2 cell line. Fiber FISH suggested that, because of a Sγ1 break, cyclin D1 was juxtaposed to both 3′ Eα enhancers. Hybridization with the Eμ enhancer probe revealed no signal. These results corroborate the previously determined switch gamma (Sγ1) breakpoint to 11q13 sequences.37 In the XG-1 cell line, IgH-constant sequences with 1 of the 3′ Eα enhancers were juxtaposed to the cyclin D1 gene. On the 11q derivative containing myeov, no IgH signal was visible, nor was it visible after hybridization with the Eμ probe. Taken together, the juxtaposition of the IgH enhancers to the cyclin D1 allele and the concomitant lack of enhancer sequences linked to myeov in SK-MM-2 (whole myeov allele is lost), XG-1, H1112, and FLAM-76 is in accordance with the lack of myeov expression and the activation of cyclin D1. In other B-cell malignancies, ie, 5 mantle cell lymphomas with a breakpoint in the BCL1/11q13 region (Figure 3, lower panel) and juxtaposition to the JH locus, a similar situation was observed, ie, linking of all IgH enhancers (Eμ, Eα1, and Eα2) to cyclin D1 and expression of cyclin D1. In accordance with these data, Northern blot analysis showed no expression of myeov (data not shown).
Discussion
The application of the NIH/3T3 tumorigenicity assay with DNA from a human gastric carcinoma resulted in the identification of a novel putative transforming gene, designated myeov. Chromosomal mapping experiments located myeov within the 11q13 region. This chromosomal region has been implicated in a variety of disorders, including lymphomas, myelomas, renal oncocytomas, and a variety of carcinomas.
We observed numerous alternatively spliced transcripts ofmyeov, and their respective role in tumorigenesis is presently under investigation. Sequence homology searches revealed thatmyeov lacks homology to any known genes. Extended computer searches for functional domains resulted in the identification of an RNP-1 motif that has been observed in various RNA-binding proteins.39,44 Furthermore, some relatively short hydrophobic regions and a C-terminal leucine/isoleucine tail were observed that might function as transmembrane helices, whereas the leucine/isoleucine tail of myeov shows similarities with a class of cytoplasmically exposed membrane proteins with a C-terminal membrane anchor.40 Some of these tail-anchored proteins are endoplasmic reticulum–bound enzymes such as cytochrome b5, heme oxygenase, or microsomal aldehyde dehydrogenase, but also comprise certain viral proteins such as the middle T antigen. The presence of these domains suggests that myeov will be directed to membranes or more specifically to the endoplasmic reticulum. Preliminary intracellular localization experiments with a myeov–GFP protein support this view (data not shown).
DNA fiber FISH enabled us to map myeov 360-kb centromeric of the cyclin D1 oncogene. Thus far, all breakpoints in mantle cell lymphomas26,45,46 and in MM cell lines27,43,47,48 were restricted to this 360-kbBCL1/11q13 region between cyclin D1 and myeov, and correlate with overexpression of cyclin D1. However, in 3 (KMS-21, XG-5, and KMS-12) of the 7 MM cell lines carrying t(11;14) investigated in our current study, overexpression of the oncogenemyeov was also observed. In these 3 cases, myeov andcyclin D1 came under the separate control of different IgH enhancers (3′ Eα1 or Eα2 and Eμ), respectively. A similar situation has been described for the t(4;14)(p16;q32) translocation in MM patients, where the FGFR3 and MMSET/WHSC1 genes are controlled by 2 IgH enhancers, Eα and Eμ, respectively.21 22
In the other MM cell lines with a breakpoint on chromosome 11q betweenmyeov and cyclin D1 and the JH or switch-class recombination sites of the IgH locus, no myeov expression could be detected. In these cases either the myeov-translocation allele was lost (in SK-MM-2) or no IgH-enhancer sequences were juxtaposed to this oncogene. The latter situation is similar to mantle cell lymphomas with t(11;14) arising through an aberrant VDJ-recombination. Consequently, myeov is not activated in mantle cell lymphoma and is restricted to a subset of MM.
In MM patients, the t(11;14) accounts for approximately 30% of the cases with 14q+,7-13,15,16 and the presence of this breakpoint was reported to correlate with a worse prognosis,15,49,50 although others16 could not confirm this correlation. We found simultaneous activation ofmyeov and cyclin D1 in only 3 of 7 t(11;14)-positive MM cell lines, suggesting that activation of cyclin D1 is a more essential step than activation of myeov. However, the fact that high myeov expression in these cell lines was correlated with the juxtaposition of IgH enhancers to the myeov allele suggests that myeov expression can function independently of the activation of cyclin D1. In accordance with this hypothesis, we also detected moderate myeov expression in 3 MM cell lines without t(11;14) and without cyclin D1 expression.
The clustering of the t(11;14)(q13;q32) breakpoints within the 360-kbBCL1/11q13 region between the cyclin D1 andmyeov gene may be of clinical relevance for the diagnosis of B-cell NHL, in particular the diagnosis of mantle cell lymphoma. As we previously reported, an almost perfect (33 of 34 cases) correlation exists between cyclin D1 overexpression and the presence of a breakpoint in the BCL1/11q13 locus centromeric of the cyclin D1 gene.26,45 Assuming that enhancers act on proximal promoter sequences,51 the identification, mapping, and expression pattern of myeov suggest that no other genes are located between cyclin D1 and myeov.Consequently, the BCL-1 breakpoint region is restricted to 360 kb flanked by the cyclin D1 and myeov genes. Therefore, the previously proposed set of probes to determine the presence of anBCL-1/11q13 breakpoint using interphase FISH is indeed suitable for diagnostic purposes.26,32 It might well be that in native myelomas with t(11;14)(q13;q32), the breakpoints are located within the same region. Mapped breakpoints in 4 patient samples with t(11;14) have been reported to fall within the same 360-kbBCL-1/11q13 region identified in the cell lines.47 52
In conclusion, we identified a novel putative transforming gene involved in a subset of myeloma cell lines carrying t(11;14). Whether breakpoints in the BCL-1/11q13 region with concomittant activation of the myeov gene is also observed in native myelomas and whether it has an impact on the clinical behavior will be the subject of an ongoing study.
Acknowledgments
Excellent technical assistance of B. Gschwendt, A. Steenvoorden, A. Wunderlich, U. Spadinger, E. Schuuring-Scholtes, and M. Schmidberger is greatly acknowledged. We thank T. Gibson for help with database searching. We also thank S. Raynaud, B. Klein, C. Theillet, P. Gauddray, G. Peters, T. Rabbitts, S. Tagawa, H. Matsuzaki, and I. van Riet for providing cell lines and DNA clones. We dedicate this article to Professor F. Vogel on the occasion of his 75th birthday.
Part of this work is the subject of the PhD thesis of T.H.
Supported by grants of the Deutsche Forschungsgemeinschaft to J.W.G.J. (Sonderforschungsbereich 322 “Lympho-Hämopoese”) and the Dr Mildred Scheel Stiftung für Krebsforschung (10-1253) to J.W.G.J. and of the Dutch Cancer Society (NKB-RUL96-1647) to E.S.
Reprints:Johannes W.G. Janssen, Institut für Humangenetik, Ruprecht-Karls-Universität Heidelberg, Im Neuenheimer Feld 328, D-69120 Heidelberg, Germany; e-mail:hans_janssen@med.uni-heidelberg.de.
The publication costs of this article were defrayed in part by page charge payment. Therefore, and solely to indicate this fact, this article is hereby marked “advertisement” in accordance with 18 U.S.C. section 1734.

This feature is available to Subscribers Only
Sign In or Create an Account Close Modal