Abstract
We have developed an efficient and rapid method for detection of Epstein-Barr virus (EBV)-specific CD8+ T-cell frequencies both in freshly isolated peripheral blood mononuclear cells (PBMCs) and in vitro established cytotoxic T lymphocyte (CTL) lines. Responder cells are thereby stimulated with an autologous lymphoblastoid cell line for 5 hours and intracellular accumulation of interferon γ (IFNγ) is detected by multiparameter flow cytometric analysis. EBV-specific CD8+ T-cell frequencies ranged between 0.63% and 1.29% in PBMCs of 5 healthy long-term EBV carriers. Using EBV-specific T-cell lines, it was shown that flow cytometric analysis is more sensitive than limiting dilution analysis for CTL precursors and enzyme-linked immunospot assay detecting IFNγ-producing T cells. The class I restriction of IFNγ production was confirmed using an anti-class I monoclonal antibody (MoAb). Information on other cytokine production of EBV-specific CTLs could be obtained using combinations of anti-cytokine MoAbs. The sensitive and rapid nature of the flow cytometric assay for EBV-specific CD8+ T-cell frequency has significant advantages for evaluation of EBV-specific CD8+ T-cell responses in PBMCs of patients with EBV-related diseases.
EPSTEIN-BARR VIRUS (EBV) is well known to be associated with several malignant diseases. These include a proportion of Hodgkin’s lymphomas, nasopharyngeal carcinomas, Burkitt’s lymphomas, and immunoblastic lymphomas seen in immunocompromised hosts.1
Primary infection with EBV is usually asymptomatic, although some may suffer from acute infectious mononucleosis.1 After primary infection, a strong HLA class I–restricted, virus-specific CD8+ cytotoxic T lymphocyte (CTL) response is elicited in healthy individuals.2 This response is believed to play an important role in controlling the virus both during primary infection and in the long-term carrier state whereby EBV persists for life in a subset of B cells.
An increased understanding of the mechanisms by which T lymphocytes recognize virus-specific antigens has stimulated much interest in the use of CTLs as adoptive immunotherapy for EBV-associated disease. An early candidate for such treatment was EBV-associated lymphoproliferative disease (LPD), which is seen in patients receiving allogeneic bone marrow transplantation from mismatched family members or unrelated donors.3,4 The incidence is between 5% and 30%, particularly if marrow was depleted of T cells to prevent graft-versus-host disease.5
Unfractionated populations of lymphocytes from the peripheral blood of donors6,7 or EBV-specific CTL lines from donor lymphocytes have been used for treatment and/or prophylaxis of posttransplant EBV-associated LPD.8,9 However, the utility of unfractionated lymphocyte infusion is limited by potentially fatal communications that arise from alloreactive T cells also present in the infusion. To overcome this problem, infusions of EBV-specific CTL lines from donor lymphocytes have been successfully used, especially as prophylaxis against EBV-associated LPD in transplant recipients considered at high risk.10 Recently, adoptive immunotherapy (using unfractionated lymphocytes or EBV-specific CTLs) has been applied for treatment or prophylaxis of EBV-associated LPD in patients with solid organ transplants,7,11 severe chronic active EBV infection,12 or EBV-positive Hodgkin’s disease.13
In any cases of immunotherapy for EBV-associated diseases, to confirm the effects of the treatment, demonstration of elevation of EBV-specific cellular immunity in the patients is necessary. For this purpose, bulk CTL activities in peripheral blood mononuclear cells (PBMCs) stimulated in vitro with an autologous EBV-infected lymphoblastoid cell line (LCL) or limiting dilution analysis (LDA) for CTL precursors that lysed the LCL have been frequently used.7-13 The disadvantage is that it takes at least approximately 10 days to raise bulk CTL, and the assay is not very quantitative. LDA is one of the established methods for quantitative detection of CTL precursor frequencies in PBMCs of healthy seropositive individuals14 and of patients receiving allogeneic bone marrow transplants.15 However, it again takes 2 to 4 weeks to obtain the results, and the procedures are particularly laborious. In addition, both experiments need γ-irradiating radioisotopes, which are potentially hazardous for the examiners.
Recently, Waldrop et al16 reported that human cytomegalovirus-specific CD4+ T-cell frequencies can be detected by flow cytometry. Kern et al17 showed that CD8+ peptide-specific T-cell frequencies can be measured in samples whose HLA is known. Both methods are based on multiparameter flow cytometric assays that detect rapid intracellular accumulation of cytokines after in vitro antigen stimulation in the presence of intracellular transport blockers such as Brefeldin A.
We report here a highly efficient method to detect whole EBV-specific CD8+ T-cell frequencies irrespective of HLA typing. PBMCs are thereby incubated with an autologous LCL in the presence of Brefeldin A for a short period (5 hours), and the rapid intracellular accumulation of interferon γ (IFNγ) is detected by multiparameter flow cytometric analysis. Using these methods, we found approximately 1% of peripheral CD8+ T cells of seropositive individuals to be EBV-specific. The method is more sensitive and takes less time than LDA for CTL precursors and enzyme-linked immunospot (ELISPOT) assays. In addition, it can provide more information on cytokine production of EBV-specific CD8+ T cells upon natural stimulation when combinations of anticytokine monoclonal antibodies (MoAbs) are used.
MATERIALS AND METHODS
Blood donors.
The blood donors consisted of (1) long-term healthy carriers of EBV defined as having both EBV-viral capsid antigen (VCA)-IgG and EBV nuclear antigen (EBNA) antibodies and (2) EBV-seronegative individuals defined as having no EBV-VCA-IgG antibodies.1 Some donors were tested for their HLA class I typing of PBMCs with classical serological methods. Study design and purpose were fully explained to all donors. Peripheral blood was obtained after informed consent was confirmed.
Preparation of PBMCs, LCLs, and CD8+ EBV-specific CTL lines.
PBMCs were obtained by centrifuging heparinized blood over Ficoll/Hypaque (Pharmacia Biotech AB, Uppsala, Sweden). LCLs were prepared by transforming PBMCs with B95-8 cell culture supernatant as previously described.12 LCLs were cultured in Iscove’s modified Dulbecco’s medium (GIBCO, Grand Island, NY) supplemented with 2 mmol/L L-glutamine, 50 U/mL penicillin, 50 μg/mL streptomycin, 5 × 10⁻⁵ mol/L β-mercaptoethanol, and 10% heat-inactivated fetal calf serum (FCS; Hyclone, Logan, UT; referred to as culture medium). EBV-specific T-cell lines were initiated by culturing 2 × 10⁶ PBMCs and 2 × 10⁵autologous irradiated LCLs in 2 mL of culture medium in each well of 24-well plates. Ten days after the stimulation, CD8+ cells were isolated using immunomagnetic beads (Dynabeads M-450 CD8; Dynal, Oslo, Norway) following the manufacturer’s instructions. Detachment of immunomagnetic beads from isolated cells was achieved using Detachabeads (Dynal). Isolated cells were greater than 95% CD8+ according to flow cytometric analysis. These CD8+ T cells were further stimulated with autologous irradiated LCLs weekly in the presence of 50 U/mL recombinant interleukin-2 (IL-2).
CTL assay.
CTL assays were performed using 51Cr-release as previously described.12 Briefly, CTLs were suspended in fresh culture medium at the desired cell concentration and seeded in wells of V-bottomed 96-well plates (Costar, Cambridge, MA) containing51Cr-labeled LCLs (2,500 cells/well). Each assay was performed in triplicate. After 5 hours of incubation, the supernatants were harvested and radioactivity was counted with a γ-counter. The percentage of specific lysis was calculated as follows: percentage of specific lysis = (experimental lysis − minimum lysis) × 100/(maximum lysis − minimum lysis). Minimum lysis was obtained by incubating the target cells with the culture medium alone. Maximum lysis was obtained by exposing the target cells to 1% Nonidet-P40.
Detection of CTL precursor frequency by LDA.
LDA for cytotoxicity was performed essentially as previously reported.14 15 Isolated CD8+ cells were diluted in 96-well U-bottom plates (24 replicates/dilution). Irradiated autologous LCLs (2 × 10⁴), PBMCs (103), and IL-2 (40 U/mL) were added to each well. On day 7, IL-2 was added to 40 U/mL. CTL assays were performed on day 12. To assay CTL precursor frequency, 100 μL of cell suspension from each well was transferred into a well of 96-well V-bottom plates containing51Cr-labeled 2,500 LCLs. After 5 hours of incubation in a humidified 5% CO2 incubator at 37°C, the supernatant was harvested and radioactivity was counted with a γ-counter. Wells were scored as positive for CTL recognition if the level of specific lysis exceeded 3 standard deviations above the mean spontaneous release from the target cells. The frequency of CTL precursors was estimated at which 37% of the wells were negative from the slope of a regression plot of the log percentage of negative versus input cell numbers.
Detection of IFNγ producing CD8+ T cells in response to LCLs by flow cytometry.
For determination of CD8+ antigen-specific T lymphocyte frequency, intracellular cytokine assessment using flow cytometry was performed as previously described, with slight modifications.16 17 Briefly, PBMCs or EBV-specific CTLs were resuspended at a concentration of 1 × 10⁶/mL in culture medium. Autologous or HLA-disparate LCLs were resuspended at a concentration of 1 × 10⁶/mL in the culture medium. Aliquots of the responder cells (1 mL) and LCL (1 mL) were mixed in 16 × 125 mm culture tubes in the presence of 10 μg/mL Brefeldin A (Sigma Chemical Co, St Louis, MO) and incubated in a humidified 5% CO2 incubator at 37°C for 5 hours. As a control, the same numbers of responder cells and LCLs were separately incubated in the presence of the Brefeldin A and mixed before staining with MoAbs. For blocking experiments, an anti-class I MoAb (clone W6/32; Cedarlane, Hornby, Ontario, Canada) or isotype-matched monoclonal mouse IgG antibodies were used at a final concentration of 47 μg/mL. After the incubation, the cell suspensions were fixed with 4% paraformaldehyde in phosphate-buffered saline (PBS) for 10 minutes at room temperature. After washing with PBS, cells were permeabilized with IC Perm (BioSource International, Camarillo, CA) and stained with PC5-labeled anti-CD8 (Coulter, Miami, FL), phycoerythrin (PE)-labeled anti-CD69 (Coulter), and fluorescein isothiocyanate (FITC)-labeled antihuman IFNγ (Becton Dickinson, San Jose, CA) MoAbs. In some experiments, T cells were stimulated with 50 ng/mL of phorbol myristate acetate (Sigma) and 500 ng/mL of ionomycin (Sigma) and stained with PE-labeled anti–IL-4 or anti–IL-13 MoAbs (Becton Dickinson). Stained cells were analyzed by FACScan (Becton Dickinson) using the LYSIS II software. Live-gating of CD8high lymphocytes was performed, and up to 20,000 events were acquired for each analysis.
ELISPOT assay.
An ELISPOT assay was performed as previously described, with slight modifications,18 19 using 96-well MultiScreen-HA plates with a nitrocellulose base (Millipore, Bedford, MA), coated with 10 μg/mL of anti-IFNγ MoAb (Genzyme, Cambridge, MA). Isolated CD8+ T cells were added in graded numbers of 500, 250, and 125 per well containing autologous irradiated LCLs (1 × 10⁵) and IL-2 (50 U/mL). Each dilution was seeded in triplicate. The plates were incubated in 5% CO2 incubator at 37°C for 28 hours and extensively washed with PBS containing 0.05% Tween-20. A polyclonal rabbit anti-IFNγ antibody (Genzyme) was added to individual wells and left for 90 minutes at room temperature, followed by peroxidase-conjugated goat antirabbit IgG (Genzyme) for an additional 90 minutes. For visualization of IFNγ-specific spots, 100 μL of 0.1 mol/L sodium acetate buffer (pH 5.0) containing 3-amino-9-ethylcarbasole (Sigma) and 0.015% H2O2 was added to each well. After 30 minutes, the reaction was stopped by washing with water and the plates were dried. The bottom membranes were photographed and spots were counted. Only diffuse large spots were considered specific, because wells containing only LCLs gave tiny spots. The percentage frequency of antigen-specific CD8+ T cells was calculated as follows: percentage frequency = numbers of spots × 100/input cell numbers.
RESULTS
We applied a strategy using tricolor analysis for detection of EBV-specific IFNγ-producing T cells. First, the PC5-labeled anti-CD8 MoAb was used for gating the population. Second, the PE-labeled anti-CD69 MoAb was used for enhancement of precise detection of responding T cells. CD69 is upregulated on activated T cells before cytokine production and thus allows more definitive clustering of the true responding fraction.20 As an unstimulated control, we used responder cells and LCLs that had been separately incubated in the same medium with Brefeldin A and mixed and stained after fixing.
Frequency of EBV-specific CD8+ T cells in PBMCs of EBV-seropositive and -seronegative individuals.
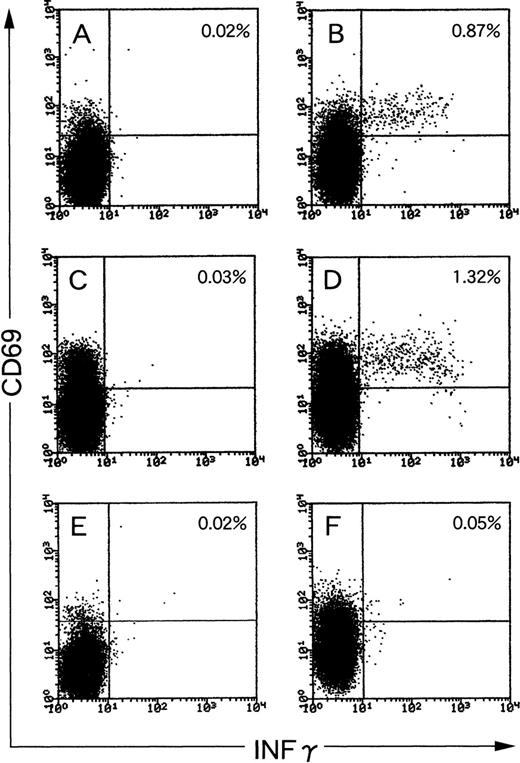
We first tested PBMCs of long-term healthy EBV carriers for the frequency of EBV-reactive IFNγ-producing CD8+ T cells. When PBMCs from seropositive individuals were used, 0.87% and 1.32% of total CD8+ cells produced IFNγ in response to autologous LCLs (Fig 1B and D). We defined the specific frequency (SF) as follows: percentage of a sample stimulated with LCLs − percentage of the same sample unstimulated (note that the unstimulated samples were also incubated with Brefeldin A and mixed with LCLs after fixation for comparable staining conditions). The SFs of donors 1 and 2 were 0.85% (Fig 1A and B) and 1.29% (Fig 1C and D), respectively. Those of the 2 other healthy EBV-carriers were 0.63% and 1.08% (graphic data not shown). In contrast, the SF of antigen-specific T cells in PBMCs of an EBV-seronegative donor was 0.03% (Fig 1E and F), showing the specificity of the assay. Those of the 2 other EBV-seronegative donors were 0.02% and 0.00%, respectively (graphic data not shown). Thus, clustering of IFNγ-producing CD8+ T cells was never found using PBMCs of EBV-seronegative donors. When stimulated with completely HLA class I-mismatched LCLs, IFNγ-producing CD8+ T cells from either seropositive or seronegative individuals ranged between 0.21% and 0.55% (graphic data not shown). Thus, such alloreactive frequency was lower than EBV-specific frequency in PBMCs of seropositive individuals and higher than that of seronegative individuals as far as we tested.
EBV-specific IFNγ-producing CD8+ T cells in PBMCs of EBV-seropositive (A through D) and EBV-seronegative (E and F) individuals. PBMCs were stimulated with autologous LCLs (B, D, and F) at a responder stimulator ratio of 1. After fixation and permeabilization, the cells were stained for CD8, CD69, and IFNγ. CD8+ cells were gated and analyzed by flow cytometry. Unstimulated PBMCs were also incubated, fixed, and then mixed with autologous LCLs before staining (A, C, and E). The frequency of CD8+/CD69high T cells that produced IFNγ is shown as a percentage of the total number of CD8 cells.
EBV-specific IFNγ-producing CD8+ T cells in PBMCs of EBV-seropositive (A through D) and EBV-seronegative (E and F) individuals. PBMCs were stimulated with autologous LCLs (B, D, and F) at a responder stimulator ratio of 1. After fixation and permeabilization, the cells were stained for CD8, CD69, and IFNγ. CD8+ cells were gated and analyzed by flow cytometry. Unstimulated PBMCs were also incubated, fixed, and then mixed with autologous LCLs before staining (A, C, and E). The frequency of CD8+/CD69high T cells that produced IFNγ is shown as a percentage of the total number of CD8 cells.
Comparison of 4 different assays for quantification of EBV-specific CD8+ T-cell frequencies.
Next, we compared the sensitivities of 4 different assays, namely the standard CTL assay, intracellular IFNγ production assay, ELISPOT assay, and standard LDA for CTL precursors, using 2 CD8+EBV-specific CTL lines.
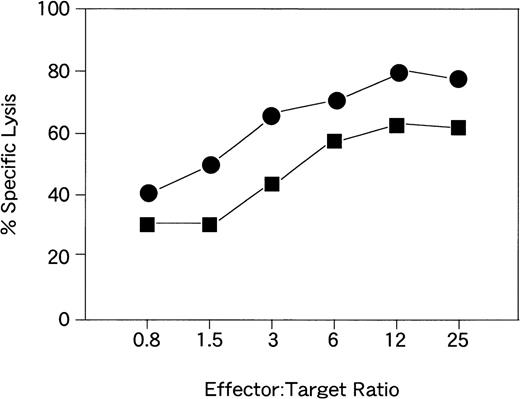
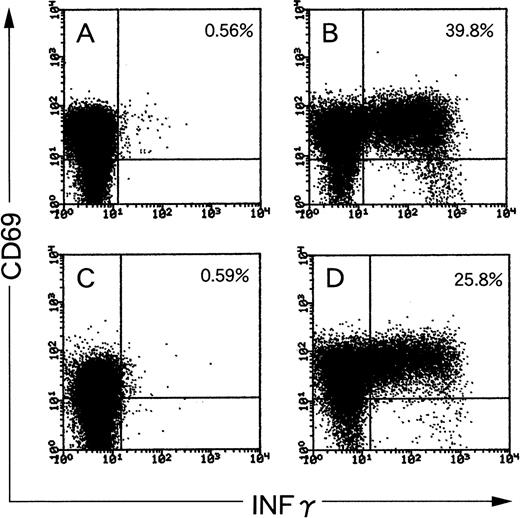
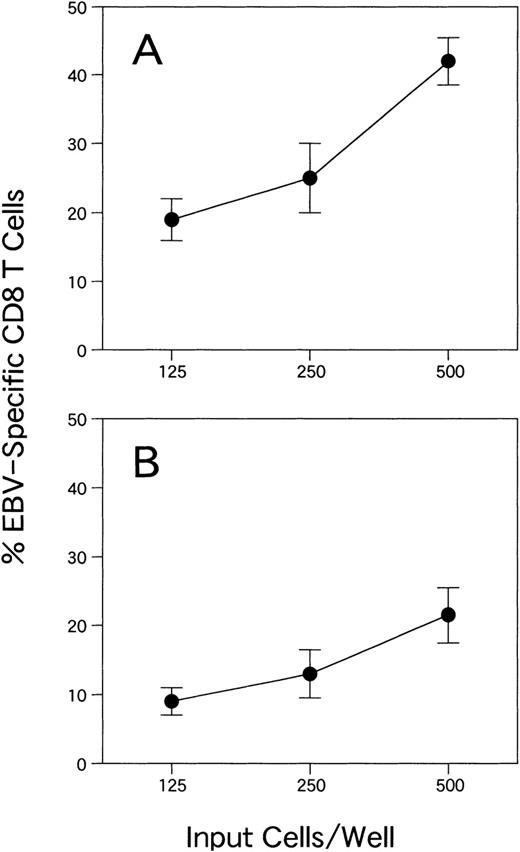
CTL activities of the lines are shown in Fig 2. The effector target ratio that yielded the same percentage of target lysis was 1.5 to 2 times higher for CTLs from donor YI than for those from donor KK. Flow cytometric analysis of EBV-specific T cells for SFs of CTL lines from donors KK and YI were 39.2% and 25.2%, respectively (Fig 3). With the ELISPOT assay, the frequency of CTLs from donor KK was approximately 2 times higher than that from donor YI (Fig 4A and B). The mean (and standard deviation) frequencies of all the wells tested were 11.2% (3.5%) and 5.7% (1.7%), respectively (Table 1). LDA analysis gave values of 2.3% and 0.23% for CTL precursor frequencies (Fig 5A and B). Thus, the values with the 4 assays roughly correlated, except for LDA, which gave a 10-fold difference between the 2 samples (Table 1). The CTL line from donor YI was growing more slowly than that from donor KK, and this might reflect the discrepancy of the data of LDA. Flow cytometric analysis of EBV-specific T-cell frequencies using intracellular IFNγ production gave the highest values.
CTL activities of the EBV-specific CD8+T-cell lines from donors KK (•) and YI (▪).
CTL activities of the EBV-specific CD8+T-cell lines from donors KK (•) and YI (▪).
Flow cytometric analysis of IFNγ production in 2 CD8+ EBV-specific CTL lines from donor KK (A and B) and YI (C and D). (A and C) Unstimulated CTLs; (B and D) CTLs stimulated with autologous LCLs at a responder stimulator ratio of 1. After fixation and permeabilization, the cells were stained for CD8, CD69, and IFNγ. CD8+ cells were gated and analyzed by flow cytometry. The frequency of CD8+/CD69high T cells that produced IFNγ is shown as a percentage of the total number of CD8 cells.
Flow cytometric analysis of IFNγ production in 2 CD8+ EBV-specific CTL lines from donor KK (A and B) and YI (C and D). (A and C) Unstimulated CTLs; (B and D) CTLs stimulated with autologous LCLs at a responder stimulator ratio of 1. After fixation and permeabilization, the cells were stained for CD8, CD69, and IFNγ. CD8+ cells were gated and analyzed by flow cytometry. The frequency of CD8+/CD69high T cells that produced IFNγ is shown as a percentage of the total number of CD8 cells.
ELISPOT assay for detecting IFNγ-producing cells in 2 CD8+ EBV-specific T-cell lines from donors KK (A) and YI (B). The mean and standard deviation are shown for each dilution.
ELISPOT assay for detecting IFNγ-producing cells in 2 CD8+ EBV-specific T-cell lines from donors KK (A) and YI (B). The mean and standard deviation are shown for each dilution.
Summary of Data for Frequencies of CD8+ EBV-Specific T Cells
Abbreviation: IC IFNγ, intracellular IFNγ staining assay.
Percentage frequency.
Mean of percentages of frequency from all of the wells tested.
Class I–restricted production of IFNγ from EBV-specific CD8+ CTLs.
We further examined the class I restriction of the response. EBV-specific CTLs were stimulated by autologous (HLA-A24/A26, B52/B62, and C3) and various allogeneic LCLs (Fig6). Approximately 27% of CTLs produced IFNγ upon stimulation of autologous LCLs (Fig 6A and B). When LCLs sharing HLA-A26, B62, and C3 class I molecules were used as stimulators, 8.8% of CD8+ T cells produced IFNγ (Fig 6C). LCLs sharing A24 and B62 with the CTL stimulated 2.8% of the CD8+ T-cell population (Fig 6D). LCLs sharing only A24 or C3 the CTL stimulated 1.2% and 0.3% of the CD8+ T-cell population (Fig 6E and F). These data indicated that HLA-A24, A26, and B62 are presenting EBV antigens. To confirm that the IFNγ production is class I-restricted, the same CTLs were stimulated by autologous LCLs in the presence of anti-class I MoAb (Fig6G) or isotype-matched mouse MoAb (Fig 6H) as a control. The IFNγ-producing CD8+ T-cell population was drastically reduced (0.36%) with anti-class I MoAb, but not with control MoAb (31%). These results indicate that the IFNγ in the CD8+T cells was produced through authentic recognition of antigens presented by class I molecules.
Class I restriction of the IFNγ production in an EBV-specific CD8+ CTL line. EBV-specific CTLs were stimulated by autologous ([B] HLA-A24/A26, B52/B62, and C3) and various allogeneic LCLs ([C] HLA-A11/A26, B62, and C3/C4; [D] A11/A24, B61/B62, and C4; [E] A2/A24, B7/B61, and C7; [F] A2, B35/B46, and C1/C3). The underlined alleles were shared by CTLs and each LCL line. Unstimulated CTLs were also incubated, fixed, and then mixed with autologous LCLs before staining (A). The same CTLs were also stimulated by autologous LCLs in the presence of an anti-class I MoAb (G) or an isotype-matched MoAb (H). The frequency of CD8+/CD69high T cells that produced IFNγ is shown as a percentage of the total number of CD8 cells.
Class I restriction of the IFNγ production in an EBV-specific CD8+ CTL line. EBV-specific CTLs were stimulated by autologous ([B] HLA-A24/A26, B52/B62, and C3) and various allogeneic LCLs ([C] HLA-A11/A26, B62, and C3/C4; [D] A11/A24, B61/B62, and C4; [E] A2/A24, B7/B61, and C7; [F] A2, B35/B46, and C1/C3). The underlined alleles were shared by CTLs and each LCL line. Unstimulated CTLs were also incubated, fixed, and then mixed with autologous LCLs before staining (A). The same CTLs were also stimulated by autologous LCLs in the presence of an anti-class I MoAb (G) or an isotype-matched MoAb (H). The frequency of CD8+/CD69high T cells that produced IFNγ is shown as a percentage of the total number of CD8 cells.
Dual staining for IFNγ/IL-4 or IL-13 in EBV-specific CD8+ CTLs.
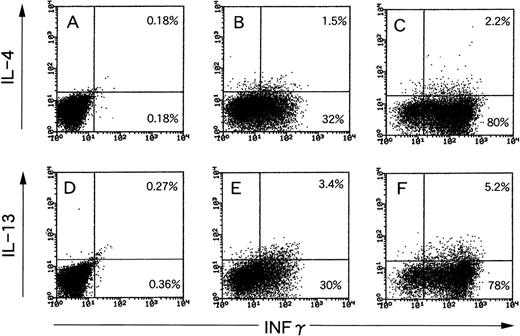
Recently, Nazaruk et al21 reported that EBV-specific CD8+ T cells can be subdivided into 2 subsets: the first of which expresses high levels of IFNγ, but little or no IL-4, whereas the second subset is IFNγ/IL-4 or IL-13 double-positive, paralleling the classically described Th1 and Th2 subsets of CD4+ T cells. They used phorbol myristate acetate and ionomycin for activation of CTLs. This artificial stimulation may give a different outcome compared with physiological T-cell receptor engagements, because a different signal transduction pathway is used.22 Thus, we examined production of the 3 cytokines by EBV-specific CTLs using LCLs as natural ligand stimulators. The results are shown in Fig 7. When an EBV-specific CTL line was stimulated with autologous LCLs, the 2 subsets mentioned above were observed in both combinations of IFNγ/IL-4 (Fig 7B) and IFNγ/IL-13 (Fig 7E). The cell distribution pattern roughly resembled those after stimulation with phorbol myristate acetate and ionomycin (Fig 7C and F), but the proportions were different.
Examination of production of 3 different cytokines by EBV-specific CTLs using LCLs as natural ligand stimulators or phorbol myristate acetate and ionomycin as chemical stimulators. (A and D) Unstimulated CTLs; (B and E) CTLs stimulated with autologous LCL at a responder stimulator ratio of 1; and (C and F) CTLs stimulated with phorbol myristate acetate and ionomycin. After fixation and permeabilization, the cells were stained for CD8, IFNγ, and IL-4 (A through C) or IL-13 (D through F). CD8+ cells were gated and analyzed using flow cytometry.
Examination of production of 3 different cytokines by EBV-specific CTLs using LCLs as natural ligand stimulators or phorbol myristate acetate and ionomycin as chemical stimulators. (A and D) Unstimulated CTLs; (B and E) CTLs stimulated with autologous LCL at a responder stimulator ratio of 1; and (C and F) CTLs stimulated with phorbol myristate acetate and ionomycin. After fixation and permeabilization, the cells were stained for CD8, IFNγ, and IL-4 (A through C) or IL-13 (D through F). CD8+ cells were gated and analyzed using flow cytometry.
DISCUSSION
We introduce here an efficient and rapid method for detection of EBV-specific CD8+ T-cell frequencies both in freshly isolated PBMCs and in vitro established CTL lines. So far, LDA has been used for the detection of CTL precursor frequencies in healthy individuals. The frequency of EBV-specific memory CTL precursors in long-time carriers is thereby usually in the 0.0005% to 0.2% range.14,23,24 We found, although in limited numbers of samples, approximately 1% of peripheral CD8+ T cells in long-term carriers to be EBV-specific. As Waldrop et al16claimed, the increased sensitivity of flow cytometric assays is likely due to a combination of factors, such as (1) the very efficient capture of produced cytokine within the cytoplasm of the secretion-inhibited responding cells; (2) the relatively short-term period (5 hours) that largely precedes the onset of activation-induced apoptosis; and (3) the higher sensitivity of fluorescence detection of cytokines by flow cytometry than by ELISPOT assay. Alternatively, the discrepancy in frequencies between IFNγ-producing CD8+ T-cell and CTL precursors may reflect the existence of noncytolytic CD8+EBV-specific T cells.21 25 Indeed, subpopulations with such a phenotype may increase the sensitivity of assays based on IFNγ production. Practically, however, the flow cytometric assay appears to be useful, if not in all situations, for rough estimation of CTL populations because our results demonstrated that gain of CTL activity of EBV-specific memory T cells with in vitro stimulation by autologous LCLs paralleled the massive increase of antigen-specific IFNγ-producing CD8+ T cells.
Recently, Tan et al26 reported the frequencies of CD8+ T cells specific for EBV antigens in long-term virus carriers, using LDA, ELISPOT assay, and tetrameric major histocompatibility complex-peptide complexes, focusing some CTL epitopes. They demonstrated that values obtained from MHC-peptide tetramer staining were 4.4-fold higher than those obtained from ELISPOT assays, which were, in turn, 5.3-fold higher than those obtained from LDA on the average. In our report, values obtained from IFNγ production using flow cytometry were approximately 4-fold higher than those obtained from ELISPOT assays, which were higher than those obtained from LDA (Table 1). Thus, IFNγ production assay using flow cytometry may have sensitivity comparable with that of MHC-peptide tetramer staining.
EBV has 2 types of replication cycles, namely lytic infection, in which infectious virions are produced, and latent infection, which is represented by LCLs. Some of both cycle proteins are well recognized by CD8+ T cells in PBMCs of patients suffering infectious mononucleosis27 and also in long-term healthy carriers.26 Because the majority of LCLs constitutively express EBV latent cycle antigens, our system may preferentially detect T cells specific to EBV latent cycle proteins, which are therapeutically important to control over posttransplant EBV-associated LPD.
Another advantage of the cytokine production assay using flow cytometry is that it is possible to assess multiple cytokines on an EBV-specific, single-cell basis. Nazaruk et al21 demonstrated that a subset of EBV-specific CD8+ T-cell lines produced IL-4 or IL-13 in addition to IFNγ upon stimulation with phorbol myristate acetate and ionomycin. They claimed that the subset has the ability to activate B cells and promote EBV-associated LPD and lymphoma development in immunocompromised individuals with impaired EBV-specific CTL responses.21 We observed here such a subset of EBV-specific CD8+ T cells upon stimulation with autologous LCLs. Although the cell distribution pattern resembled those stimulated with the drugs, the proportions were slightly different, giving more physiological information because of the natural ligand stimulation used.
Altogether, the method presented here saves time, gives more information, and probably is more accurate than LDA for detecting antigen-specific T cells, as is the case for human cytomegalovirus-specific CD4+ T cells.16 The rapid determination of EBV-specific CD8+ T-cell frequency could have significant advantages in clinical settings in which EBV infection is concerned. For example, the immunological effects of adoptive immunotherapy for EBV-related disease can be monitored easily and rapidly. In some patients with EBV-associated LPD after allogeneic bone marrow transplantation, regression occurs in accordance with elevation of EBV-specific cellular immunity, spontaneously,28 or as a result of reduction of immunosuppression.29 The flow cytometric assay as a tool for realtime monitoring of EBV-specific cellular immunity may be useful in decision making for performing donor leukocyte transfusion, a treatment potentially associated with fatal graft-versus-host disease.30
ACKNOWLEDGMENT
The authors thank T. Yoshida and M. Hirata for technical assistance.
Supported by grants-in-aid for Scientific Research from the Ministry of Education, Science and Culture of Japan (11138268 to T.T. and 11877055 to K.K.) and partly by JSPS-RFTF 97L00703.
The publication costs of this article were defrayed in part by page charge payment. This article must therefore be hereby marked “advertisement” in accordance with 18 U.S.C. section 1734 solely to indicate this fact.
REFERENCES
Author notes
Address reprint requests to Kiyotaka Kuzushima, MD, Laboratory of Viral Oncology, Aichi Cancer Center Research Institute, 1-1 Kanokoden, Chikusa-ku, Nagoya 464-0021 Japan.


![Fig. 6. Class I restriction of the IFNγ production in an EBV-specific CD8+ CTL line. EBV-specific CTLs were stimulated by autologous ([B] HLA-A24/A26, B52/B62, and C3) and various allogeneic LCLs ([C] HLA-A11/A26, B62, and C3/C4; [D] A11/A24, B61/B62, and C4; [E] A2/A24, B7/B61, and C7; [F] A2, B35/B46, and C1/C3). The underlined alleles were shared by CTLs and each LCL line. Unstimulated CTLs were also incubated, fixed, and then mixed with autologous LCLs before staining (A). The same CTLs were also stimulated by autologous LCLs in the presence of an anti-class I MoAb (G) or an isotype-matched MoAb (H). The frequency of CD8+/CD69high T cells that produced IFNγ is shown as a percentage of the total number of CD8 cells.](https://ash.silverchair-cdn.com/ash/content_public/journal/blood/94/9/10.1182_blood.v94.9.3094/4/m_blod42114006x.jpeg?Expires=1767774980&Signature=4uRnagqCbyvW3CioLCzoHwB10roVqx7WQgDDyfqtAsPEPnA~D8dpoBDO50NWy1r03anymcS7q9rlNggBRJw4coaw-nAhneeO52qjaIOzQfiRL82Jp1ZvwiZMEHrUfgZRVoEM8NFaPUFnDz4vql8hp8urpy6LN5nDyXHkoKLm9cXwWqQOBh1iaI8L4z3DChE9i-~-6EUiH50sG1ZFPT6PwEzGQNf6MJIIHOOvw5mE9OMclsJnIB~oN74Crst5x6RhBkDHRuAyjJA~8SU~rAG1p1EJ9l2CgdGlzxEBqpMPVyEkIAo5jIuHVQcLKV6WRBSeFlXZnXP21M2aWt5ks5tLsQ__&Key-Pair-Id=APKAIE5G5CRDK6RD3PGA)
This feature is available to Subscribers Only
Sign In or Create an Account Close Modal