Human immunodeficiency virus (HIV)-infected individuals develop an acquired immune deficiency syndrome (AIDS) due to loss in their lymphocyte numbers and cellular defects in T cells and antigen-presenting cells (APC). HIV infection of the thymus results in deficient replenishment of the peripheral naive T-cell pool. The HIVnef gene was shown to be important for progression towards AIDS and cellular depletion of the infected thymus. Here, we demonstrate by retroviral gene transfer that nef expression, in the absence of other HIV genes, impaired human thymic T-cell development. Thymocytes were generated in reduced numbers and downmodulated CD4 and CD8β cell surface expression. T cells grown from nef-expressing thymocytes were hyperproliferative in vitro upon T-cell receptor triggering. Mature dendritic cells (DC) were functional and had normal surface CD4 levels despite nef expression. Thus, nefexpression alone may contribute to AIDS development by reduced T-cell generation and T-cell hyperresponsiveness.
INDIVIDUALS INFECTED WITH human immunodeficiency virus (HIV) develop an acquired immune deficiency syndrome (AIDS) due to progressive loss of CD4+ T cells, T-helper cell function, and impaired or abnormal antigen-presenting cell (APC) function (reviewed by Levy1). In some long-term nonprogressors, HIV virus containing deletions in the nef gene has been isolated.2-4 Monkeys infected with nefdefective simian immunodeficiency virus (SIV) showed a decreased viral load, did not develop AIDS,5 and mounted a protective immune response against infection with wild-type SIV.6These observations showed that the HIV nef gene facilitates4 or may even be essential for AIDS development.7,8 In the cytoplasma of infected cells, Nef is a phosphorylated and N-myristoylated membrane-associated protein of 27 kD (HIV-1) or 34 kD (HIV-2 and SIV).8 In T-cell lines, it was shown to downregulate cell surface CD4 and major histocompatibility complex (MHC) class I expression by increased endocytosis.9,10 Depending on the study, T-cell receptor (TCR) for antigen-mediated cellular responses were found to be either inhibited or enhanced (reviewed by Harris7).
The inability to replenish the naive T-cell pool in AIDS patients is due to infection of the thymus. Upon highly active antiretroviral therapy, thymus-derived peripheral naive CD4+ T-cell count increases in HIV-infected subjects.11 HIV infection disturbs human T-cell development as seen in seropositive children12 or in the human thymus of severe combined immunodeficiency (SCID)-hu mice infected with HIV.13,14 In this latter model, nef was shown to be required for efficient in vivo viral replication and depletion of thymocytes.15-17However, as nef is known to enhance viral infectivity,7,8 these observations cannot discriminate between virus-mediated or direct cellular effects of Nef in infected thymocytes. Transgenic (Tg) mice expressing nef in thymocytes and T cells have reduced CD4+ thymocyte and T-cell numbers and show altered T-cell activation responses.18-20Moreover, in mice Tg for the HIV genome, expressed in CD4+APC, like macrophages and dendritic cells (DCs) and in CD4+thymocytes and T cells, the observed AIDS-like pathology was due tonef expression.21 22 Observations in Tg mice raised the possibility that nef function, independent of the presence of infectious virus or even other HIV genes, is responsible for human thymocyte depletion and possibly even progression towards AIDS. However, Nef function has never been addressed in human T-cell and DC generation and function.
In this report, we demonstrate that T-cell precursors, expressing HIV-1nef after retroviral gene transfer, were impaired in generating T cells. Transduced thymocytes downmodulated CD4 and CD8β cell surface expression. Generation of CD4+CD8+double positive (DP) thymocytes decreased with increasing nefexpression, resulting in a limited output of predominantly CD3+CD4− cells. T cells expressingnef could be induced to express interleukin (IL)-2, could be expanded on feeder cells, and were hyperproliferative in vitro upon TCR triggering. DCs could be generated from hematopo- ietic precursor cells expressing nef. Mature DCs were functional and expressed normal surface CD4 levels despitenef expression.
Our results indicate that HIV nef expression is responsible for part of the thymic disturbances seen in HIV infection and may contribute to AIDS development by reduced T-cell generation and T-cell hyperresponsiveness. Aberrant mature DC function in HIV infection is unlikely to result from nef expression in DCs.
MATERIALS AND METHODS
Monoclonal Antibodies, Flow Cytometry, and Cell Sorting
Mouse antihuman monoclonal antibodies used were: CD8α (Becton Dickinson Immunocytometry Systems, Mountain View, CA), CD8β (Immunotech, Marseille, France), CD14 (Becton Dickinson), CD25 (Becton Dickinson), CD27 (PharMingen, San Diego, CA), CD40 (PharMingen), CD80 (Becton Dickinson), anti-TCR-αβ (Immunotech), anti-MHC-I (antihuman histocompatibility leukocyte antigens [HLA]-A, -B, -C; PharMingen) and as described previously.23,24 For Annexin-V staining, cells were stained with Annexin-V-biotin (Boehringer Mannheim, Mannheim, Germany) plus streptavidin-phycoerythrin (Becton Dickinson). The cells were analyzed on a FACScan or FACSCalibur flow cytometer (Becton Dickinson). Flow cytometry and cell sorting was performed as described previously.24 Forward light scattering, orthogonal scattering, and 3 or 4 fluorescence signals were stored and analyzed using the CellQuest software (Becton Dickinson).
Cell Culture and Purification of Progenitor Cells
Jurkat and MOLT-4 (American Type Culture Collection, Rockville, MD), Sup-T1 (AIDS Research and Reference Reagent Program, NIH, Bethesda, MD), and other cells were cultured in complete Iscove’s modified Dulbecco’s medium (IMDM) as described previously.24 T-cell culture, DC functional assay, and human-mouse fetal thymus organ culture (FTOC24) were performed in complete IMDM containing 10% heat-inactivated human AB serum (Biowhittaker, Walkersville, MD). CD34−CD4+CD8−CD3−(ISP4+) and CD34+CD4−CD8−CD3−(CD34+) thymocytes were isolated by sorting freshly isolated thymocytes stained for CD34-allophycocyanin (APCy), CD4-phycoerythrin (PE), CD8α-fluorescein isothiocyanate (FITC), and CD3-FITC. CD34+ cord blood (CB) cells were purified by cell sorting as described previously.24 Purity of sorted cells was always at least 99%. Child thymi, removed during cardiac surgery, and CB samples were obtained and used following the guidelines of the Medical Ethical Commission of the University Hospital of Ghent.
Retroviral Gene Transfer
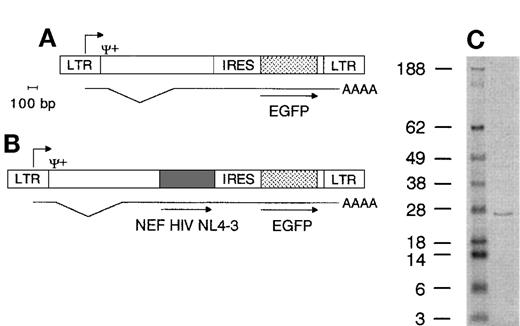
The marker gene Enhanced Green Fluorescent Protein (EGFP) was placed 3′ of an internal ribosome entry site (IRES) sequence in the LZRS retroviral vector.25 In this Nef− control vector (Fig 1A), an EcoRI-BamHI fragment containing the complete HIV-1 NL4-3 nef gene26 amplified by polymerase chain reaction (PCR) (Platinum Taq, Life Technologies, Paisley, Scotland) from the pNL4-3 plasmid (AIDS Research and Reference Reagent Program) was inserted 5′ of the IRES sequence (Fig 1B) to generate the Nef+ vector. Direct sequencing (ABI, Perkin Elmer, Foster City, CA) confirmed that the clone used contained the published26 NL4-3 nef gene sequence. Retroviral supernatants were prepared as described previously.24 The Nef− and Nef+ batches used in this report contained approximately 2.5 × 10⁵ and 6 × 10⁵ transducing units/mL, respectively, titrated on Jurkat cells. For generation of T cells, progenitor cells were transduced once, 1 day (CD34+ CB cells, cultured in medium supplemented with stem cell factor [SCF, 100 ng/mL], ftl3/flk-2 ligand [FL, 100 ng/mL], thrombopoietin (20 ng/mL]) or 2 days (ISP4+ or CD34+ thymocytes, cultured25 in medium supplemented with SCF [10 ng/mL] and IL-7 [10 ng/mL]) after initiation of the culture (all cytokines from R&D Systems Europe, Abingdon, UK). For generation of DCs, sorted CD34+ CB cells were transduced once 2 days after initiation of the culture as described below. For transduction, cells were seeded on RetroNectin (Takara Biomedicals, Otsu Shiga, Japan) coated culture plates with half of the medium volume replaced by retroviral supernatants, supplemented with cytokines to keep final cytokine concentrations constant. After 3 days of culture, cells were harvested to determine transduction efficiency and used in subsequent assays.
Immunoblotting
Cell lysates were run on 4% to 12% Bis-Tris polyacrilamide gels (Nupage, Novex, San Diego, CA) in 2-(N-morpholino) ethane sulfonic acid buffer in reducing conditions and proteins were blotted on polyvinylidene fluoride membranes (Novex). Blots were stained with the HIV-1 Nef monoclonal antibody EH-1 (AIDS Research and Reference Reagent Program) and antimouse IgG alkaline phosphatase conjugate (Sigma, Steinheim, Germany).
Generation of Cell Lineages and Functional Assays
Thymocytes.
About 30,000 ISP4+ or 10,000 CD34+ thymus or CB cells were used in 7 to 30 day FTOC as described previously24 to study in vitro thymic repopulation. To study in vivo thymic repopulation, about 50,000 ISP4+ or 20,000 CD34+ CB cells were injected in the human thymus of SCID-hu mice that were irradiated (0.2 Gy, 0.04 Gy/minute) the day before. SCID-hu mice were obtained by transplantation of human fetal liver and thymus about 5 months before as described previously.23 Inherent to this model, the magnitude of engraftment of the thymus, as measured by the number of donor-derived thymocytes recovered several weeks after injection of progenitor cells, is highly variable27 (and our own unpublished observations). Therefore, calculation of precursor expansion is not possible. Human fetal tissue was obtained following the guidelines of the Medical Ethical Commission of the University Hospital of Ghent. Animals were treated according to the guidelines of the Laboratory Animal Ethical Commission of the University Hospital of Ghent. After 3 weeks (thymi injected with ISP4+ cells) or after 4 to 7 weeks (thymi injected with CD34+ CB cells), mice were killed and thymocytes were phenotyped and in some experiments sorted for EGFP, CD3, and CD27 expression. Sorted thymocytes from thymi injected with CD34+ CB cells were stimulated with phorbol myristate acetate (PMA; 2 ng/mL, Sigma) + phytohemagglutinin (PHA; 2 μg/mL, Murex, Dartford, United Kingdom) as described previously23 to induce cytokine expression. To induce proliferation, thymocytes were stimulated with PHA + IL-2 (Boehringer Mannheim) as described previously23 or with anti-CD3 antibody (OKT3, American Type Culture Collection) + PMA as described below.
T cells.
SCID-hu thymocytes from thymi injected with transduced ISP4+ or CD34+ CB cells were sorted as described above and seeded on freshly isolated and irradiated (2.5 Gy) allogeneic peripheral blood mononuclear cells (PBMCs) in medium supplemented with PHA + IL-2 as described previously.23After 14 days of culture, cells were harvested, phenotyped, and used to induce cytokine expression (7 hours of culture, assay by reverse transcription [RT]-PCR) or proliferation (36 hours of culture, assay by β-counting of DNA incorporated 3H-thymidine after overnight pulsing) in plain flat bottom wells or wells coated with OKT3, in medium with or without PMA.
DC.
Sorted CD34+ CB cells were cultured28 for 5 days (transduction 2 days after initiation of the culture) in complete IMDM supplemented with SCF (100 ng/mL), FL (100 ng/mL), granulocyte macrophage colony-stimulating factor (GM-CSF, 5 ng/mL), and tumor necrosis factor α (TNFα, 10 ng/mL) to generate DC precursors, and for a further 9 days in complete IMDM supplemented with GM-CSF, TNFα, and IL-4 (20 ng/mL) to generate mature DCs. Sorted transduced mature DCs (EGFP+HLA-DR++CD14−) were seeded in various numbers in 96-well round bottom plates and gamma irradiated (2 Gy). On irradiated DCs, 20,000 freshly isolated allogeneic PBMCs (ratio DCs/PBMCs numbers: 1/1 to 1/729) were cocultured for 6 days and then pulsed overnight to assay proliferation by β-counting of DNA incorporated 3H-thymidine.
RESULTS
Retroviral-Mediated Transfer of nef
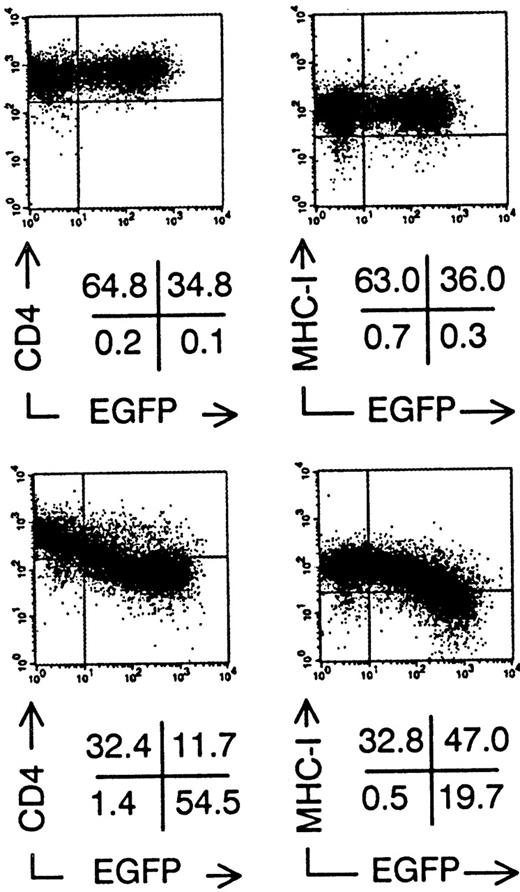
To investigate the effect of nef gene expression on the development and function of human T cells and DCs, we constructed retroviral vectors containing the marker gene EGFP, without (Nef−, Fig 1A) or with (Nef+, Fig 1B) the HIV NL4-3 nefgene.26 Due to the IRES,25 Nef+transduced cells expressed both Nef and EGFP proteins from 1 bicistronic messenger RNA (mRNA). As expected, semiquantitative RT-PCR on sorted Nef+ transduced cells showed a linear correlation between the amount of mRNA for Nef and EGFP fluorescence intensity (data not shown). Nef+ transduced cells expressed a +/− 27 kD Nef protein as shown by immunoblotting (Fig 1C). We transduced established T-cell lines to demonstrate the biological activity of the Nef protein. Sup-T1 cells29 still expressed CD4 and MHC class I after transduction with Nef−retroviral supernatant at the same level as nontransduced cells (Fig 2). In contrast, in Nef+transduced cells, expression levels of both of these surface molecules were up to 10 times lower in function of increasing EGFP expression (Fig 2). Similar results were obtained with MOLT-4 and Jurkat T cell lines (data not shown).
Retroviral vector genomes and Nef protein immunoblot. (A) Nef− genome encodes the EGFP gene 3′ of the IRES under control of the long terminal repeat (LTR) promotor. Ψ+ packaging signal, AAAA poly(A) tail of mRNA, bp, base pairs. (B) Nef+ genome encodes both the HIV NL4-3 nef gene and the EGFP gene. Translation of mRNA produces 2 proteins. Lengths drawn to scale. Scale bar indicates 100 bp length. (C) Immunoblot showing molecular weight marker (first lane, figures indicate weight in kD) and Nef+ transduced cell lysate (second lane), highlighting a protein band of +/− 27 kD.
Retroviral vector genomes and Nef protein immunoblot. (A) Nef− genome encodes the EGFP gene 3′ of the IRES under control of the long terminal repeat (LTR) promotor. Ψ+ packaging signal, AAAA poly(A) tail of mRNA, bp, base pairs. (B) Nef+ genome encodes both the HIV NL4-3 nef gene and the EGFP gene. Translation of mRNA produces 2 proteins. Lengths drawn to scale. Scale bar indicates 100 bp length. (C) Immunoblot showing molecular weight marker (first lane, figures indicate weight in kD) and Nef+ transduced cell lysate (second lane), highlighting a protein band of +/− 27 kD.
Downmodulation of CD4 and MHC Class I surface expression on Sup-T1 cells expressing nef after retroviral gene transfer. Bivariate dot plots of flow cytometric measurement of Nef− transduced cells (top) and Nef+transduced cells (bottom). CD4-PE and MHC Class I-PE expression versus EGFP expression of Sup-T1 cells 3 days after transduction. Quadrants were set to include 99% of stained nontransduced cells in upper left quadrant. Figures indicate percentage of cells present in corresponding quadrants.
Downmodulation of CD4 and MHC Class I surface expression on Sup-T1 cells expressing nef after retroviral gene transfer. Bivariate dot plots of flow cytometric measurement of Nef− transduced cells (top) and Nef+transduced cells (bottom). CD4-PE and MHC Class I-PE expression versus EGFP expression of Sup-T1 cells 3 days after transduction. Quadrants were set to include 99% of stained nontransduced cells in upper left quadrant. Figures indicate percentage of cells present in corresponding quadrants.
Nef Expression Hampers Human T-Cell Development
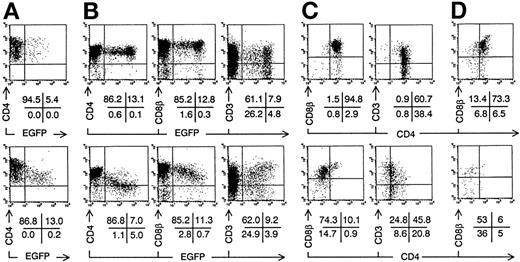
The most immature thymocytes susceptible for HIV infection in vivo are immature CD4 single positive cells (CD4+CD3−CD8−; ISP4+),13,14 the precursors of DP immature thymocytes and single positive (SP) mature thymocytes and T cells. To study the effect of nef expression on human T-cell development, ISP4+ cells were isolated by cell sorting and transduced with Nef− or Nef+retroviral supernatant (Fig 3A). T-cell development from transduced progenitor cells was assayed in vitro in FTOC and in vivo after injection in the human thymus of SCID-hu mice. After 1 week of FTOC, Nef− transduced ISP4+ cells developed into DP cells with comparable cell membrane CD4, CD8β, and the TCR-associated CD3 expression levels as nontransduced cells (Fig 3B), as EGFP expression does not hamper T-cell development.24 25 In contrast, most Nef+transduced thymocytes expressed reduced CD4, CD8β (Fig 3B), and MHC class I levels (data not shown) and were skewed towards higher CD3 levels, all correlating with EGFP and thus with Nef levels. Gating on EGFP+ cells (Fig 3C) showed that the Nef+transduced cells were mainly CD4dim/-CD8β+/dim, so that the DP fraction of Nef+ transduced thymocytes was significantly reduced (Table 1). Mean fluorescence intensities of Nef− versus Nef+ transduced thymocytes (Fig 3C) were for CD4, 125 versus 26; for CD8β, 299 versus 165; for CD3, 95 versus 124. Precursor expansion, ie, the ratio of output transduced thymocyte number to input transduced progenitor number (about 1,500 cells) was on the average 10.0 (range, 6.2 to 17) for Nef− transduced cells compared with 2.5 (range, 1.3 to 3.4), with Nef+ transduced cells (Table 1). In addition, unlike the transduced ISP4+ start population, relatively more Nef+ transduced thymocytes expressed intermediate EGFP levels compared with Nef− transduced cells, possibly indicating a selective disadvantage for cells expressing high levels ofnef (Fig 3). The fraction of CD3+ cells expressing CD4 was diminished (Fig 3C and Table 1). On Nef+ transduced thymocytes, CD8α expression was less reduced than CD8β expression, and similar to Nef−, most Nef+ transduced CD3+ cells expressed an αβ TCR (data not shown). On Nef+ thymocytes, αβ TCR expression increased with EGFP fluorescence intensity, similar to CD3. A minor subset of Nef+ transduced thymocytes expressing normal CD4 and CD8β levels was present (Fig 3C). After additional weeks of culture, the differences in thymocyte generation and phenotype in FTOC started with Nef+ compared with Nef− transduced ISP4+ precursors were even more pronounced (Table 1). After 3 weeks of FTOC, almost no Nef+ DP cells were observed (Fig3D and Table 1). The few remaining Nef+ cells were mostly CD3+CD4dim/-CD8α+ and either CD8β+ or CD8β−. Thus, generation of DP thymocytes from ISP4+ precursors decreases with increasing nef expression.
Intrathymic development of transduced ISP4+progenitor cells in vitro. Bivariate dot plots of flow cytometric measurement of Nef− transduced cells (top) and Nef+ transduced cells (bottom). (A) CD4-PE versus EGFP expression of transduced ISP4+ thymocytes, 1 day after transduction. (B) CD4-APCy, CD8β-PE, and CD3-APCy versus EGFP expression of thymocytes from day 7 FTOC started with cells shown in (A). (C) CD8β-PE and CD3-PE versus CD4-APCy expression from thymocytes shown in (B), gated on EGFP+ cells (> 20 arbitrary fluorescence units). (D) CD8β-PE versus CD4-APCy expression of EGFP+ thymocytes from day 21 FTOC started with cells shown in (A). Quadrants were set to include 99% of cells stained with isotypic controls and EGFP− cells in lower left quadrant, except arbitrarily positioned to delimit DP cells in CD8β versus CD4 stainings. Figures indicate percentage of cells present in corresponding quadrants.
Intrathymic development of transduced ISP4+progenitor cells in vitro. Bivariate dot plots of flow cytometric measurement of Nef− transduced cells (top) and Nef+ transduced cells (bottom). (A) CD4-PE versus EGFP expression of transduced ISP4+ thymocytes, 1 day after transduction. (B) CD4-APCy, CD8β-PE, and CD3-APCy versus EGFP expression of thymocytes from day 7 FTOC started with cells shown in (A). (C) CD8β-PE and CD3-PE versus CD4-APCy expression from thymocytes shown in (B), gated on EGFP+ cells (> 20 arbitrary fluorescence units). (D) CD8β-PE versus CD4-APCy expression of EGFP+ thymocytes from day 21 FTOC started with cells shown in (A). Quadrants were set to include 99% of cells stained with isotypic controls and EGFP− cells in lower left quadrant, except arbitrarily positioned to delimit DP cells in CD8β versus CD4 stainings. Figures indicate percentage of cells present in corresponding quadrants.
Precursor Expansion and Phenotype of Thymocytes Generated in FTOC From Nef− and Nef+Transduced ISP4+ Precursors
| . | Weeks of Culture . | |||||
|---|---|---|---|---|---|---|
| 1 . | 2 . | 3 . | ||||
| Nef− . | Nef+ . | Nef− . | Nef+ . | Nef− . | Nef+ . | |
| Precursor expansion* | 10.0 ± 4.0 | 2.5 ± 0.8 | 12.6 ± 0.8 | 1.7 ± 1.4 | 2.5 ± 1.3 | 0.2 ± 0.2 |
| Phenotype† | ||||||
| CD4+CD8β+ | 93.2 ± 1.2 | 14.4 ± 3.0 | 71.1 ± 1.9 | 5.2 ± 0.6 | 76.1 ± 4.1 | 4 ± 5.2 |
| CD4+CD8βdim/− | 4.0 ± 1.0 | 3.5 ± 2.4 | 22.1 ± 3.8 | 5.2 ± 2.5 | 9.0 ± 3.3 | 2 ± 3.2 |
| CD4dim/−CD8β+ | 1.1 ± 0.4 | 65.1 ± 7.3 | 3.0 ± 2.3 | 48.6 ± 15.1 | 9.1 ± 6.0 | 40 ± 18.4 |
| CD4dim/−CD8βdim/− | 1.7 ± 0.6 | 17.0 ± 2.9 | 3.8 ± 0.5 | 41 ± 13.2 | 5.8 ± 1.4 | 54 ± 26.9 |
| CD3+CD4+ | 64.0 ± 2.8 | 18.2 ± 5.5 | 53.5 ± 8.0 | 9.7 ± 1.3 | 55.0 ± 6.6 | 6 ± 4.5 |
| CD3+CD4dim | 0.9 ± 0.6 | 34.0 ± 4.2 | 9.8 ± 0.4 | 40.4 ± 11.2 | 11.4 ± 0.6 | 26 ± 10.9 |
| CD3+CD4− | 0.9 ± 0.2 | 18.4 ± 7.2 | 2.3 ± 0.4 | 23.8 ± 1.3 | 2.5 ± 0.2 | 49 ± 29.0 |
| CD3+CD8β+/dim | 61.9 ± 1.1 | 61.2 ± 1.3 | ND | ND | 56.1 ± 7.0 | 42 ± 3.9 |
| CD3+CD8β− | 1.3 ± 0.6 | 5.2 ± 1.1 | ND | ND | 8.3 ± 0.5 | 41 ± 6.4 |
Figures indicate average on experiments with 3 different donors +/− standard deviation.
Abbreviation: ND, not determined.
Precursor expansion: ratio of output thymocyte number to input progenitor number.
Phenotype, percentage of cells of corresponding phenotype on total thymocyte population. For CD4 and CD8 β, +, expression above level delimited by quadstat as in Fig 3D; −, expression below level delimited by quadstat as in Fig 3B; dim, expression level between − and +. For CD3, + and −, expression above or below level delimited by quadstat as in Fig 3B.
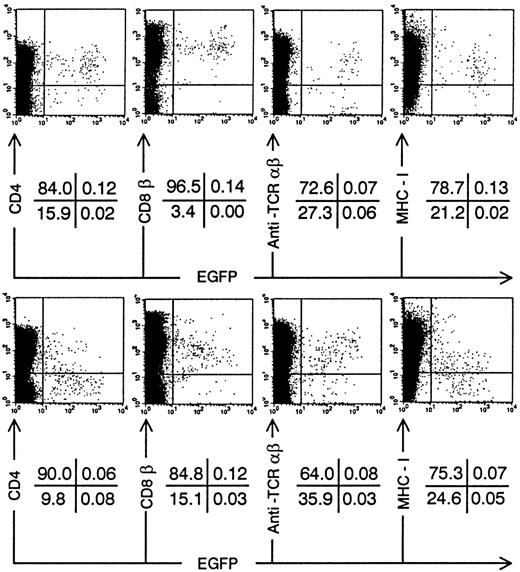
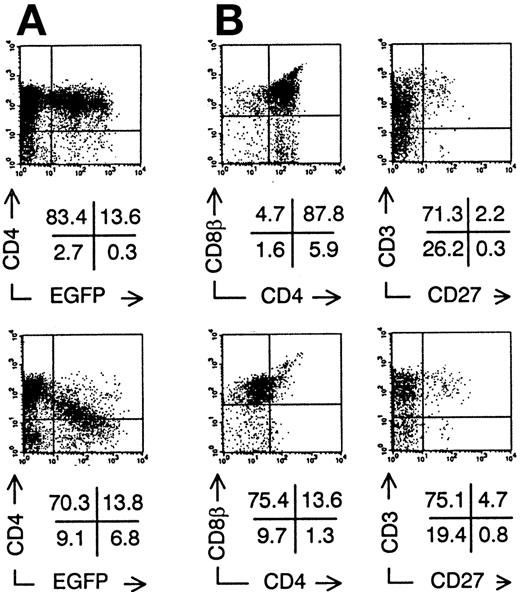
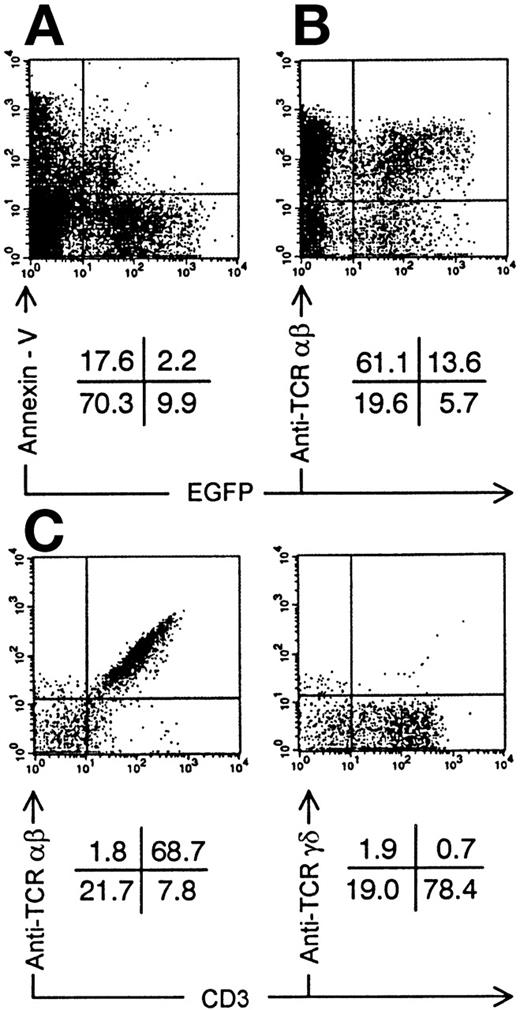
We injected transduced ISP4+ precursor cells in human thymi of SCID-hu mice to study in vivo thymopoiesis. Three weeks after injection of transduced ISP4+ thymocytes, few EGFP+ thymocytes could be recovered from the thymic graft. However, phenotypical alterations of thymocyte development were similar to those observed in FTOC (Fig 4). To generate sufficient mature transduced thymocytes, we chose to repopulate the human thymus with transduced CB CD34+precursors. These cells, which are more readily transducible and have a higher proliferative potential than ISP4+ cells, can generate transduced thymocytes in this model30 (and our own unpublished observations). One month after injection of CD34+ CB precursors, Nef+ transduced thymocytes expressed decreased CD4 levels in function of increasing EGFP expression (Fig 5A). Similar to the experiments with ISP4+ cells, most Nef+transduced thymocytes were CD4dim/-CD8β+/dimand upregulated CD3 (Fig 5B). Mean fluorescence intensities of Nef− versus Nef+ transduced thymocytes (Fig 5B) were for CD4, 109 versus 21; for CD8β, 307 versus 139; for CD3, 50 versus 113. Moreover, a part of the Nef+ transduced CD3+ thymocytes were CD27+, a marker previously shown to correlate with acquisition of functionality by human thymocytes.23 31 Apoptosis was absent in bright EGFP+ thymocytes in SCID-hu thymi injected with either Nef− transduced (data not shown) or Nef+transduced (Fig 6A) CB precursors. EGFP expression was only detected in viable cells, as propidium iodide staining cells were never EGFP+ (data not shown). Nef expression is thus not toxic for developing thymocytes. Similar to Nef− transduced thymocytes, most Nef+transduced thymocytes expressed a TCR-αβ, while a small minority expressed a TCR-γδ (Fig 6B and C). Expression of other markers as CD1 or CD45RA and development of natural killer cells and DCs in the thymus was not affected by nef expression (data not shown).
Intrathymic development of transduced ISP4+progenitor cells in vivo. Bivariate dot plots of flow cytometric measurement of Nef− transduced cells (top) and Nef+ transduced cells (bottom) showing CD4-APCy, CD8β-PE, CD3-APCy, and MHC Class I-PE versus EGFP expression of SCID-hu thymocytes 20 days after injection of transduced ISP4+ cells. Quadrants were set to include 99% of cells stained with isotypic controls and EGFP− cells in lower left quadrant. Figures indicate percentage of cells present in corresponding quadrants.
Intrathymic development of transduced ISP4+progenitor cells in vivo. Bivariate dot plots of flow cytometric measurement of Nef− transduced cells (top) and Nef+ transduced cells (bottom) showing CD4-APCy, CD8β-PE, CD3-APCy, and MHC Class I-PE versus EGFP expression of SCID-hu thymocytes 20 days after injection of transduced ISP4+ cells. Quadrants were set to include 99% of cells stained with isotypic controls and EGFP− cells in lower left quadrant. Figures indicate percentage of cells present in corresponding quadrants.
Intrathymic development of transduced CD34+CB progenitor cells in vivo. Bivariate dot plots of flow cytometric measurement of Nef− transduced cells (top) and Nef+ transduced cells (bottom). (A) CD4-PE versus EGFP expression of SCID-hu thymocytes 30 days after injection of transduced CD34+ CB precursor cells. (B) CD8β-PE versus CD4-APCy and CD3-APCy versus CD27-PE expression of thymocytes shown in (A), gated on EGFP+ cells. Quadrants were set to include 99% of cells stained with isotypic controls and EGFP− cells in lower left quadrant, except arbitrarily positioned to delimit DP cells in CD8β versus CD4 stainings. Figures indicate percentage of cells present in corresponding quadrants.
Intrathymic development of transduced CD34+CB progenitor cells in vivo. Bivariate dot plots of flow cytometric measurement of Nef− transduced cells (top) and Nef+ transduced cells (bottom). (A) CD4-PE versus EGFP expression of SCID-hu thymocytes 30 days after injection of transduced CD34+ CB precursor cells. (B) CD8β-PE versus CD4-APCy and CD3-APCy versus CD27-PE expression of thymocytes shown in (A), gated on EGFP+ cells. Quadrants were set to include 99% of cells stained with isotypic controls and EGFP− cells in lower left quadrant, except arbitrarily positioned to delimit DP cells in CD8β versus CD4 stainings. Figures indicate percentage of cells present in corresponding quadrants.
Annexin-V staining and TCR expression on Nef+ transduced thymocytes. Bivariate dot plots of flow cytometric measurement of Nef+ transduced thymocytes 30 days after injection of transduced CD34+ CB precursor cells. (A) Annexin-V versus EGFP expression. (B) TCR-β-PE versus EGFP expression. (C) TCR-β-PE and TCR-γδ-PE versus CD3-APCy expression of thymocytes also used for staining showed in (B), gated on EGFP+ cells. Quadrants were set to include 99% of cells stained with isotypic controls and EGFP− cells in lower left quadrant. Figures indicate percentage of cells present in corresponding quadrants.
Annexin-V staining and TCR expression on Nef+ transduced thymocytes. Bivariate dot plots of flow cytometric measurement of Nef+ transduced thymocytes 30 days after injection of transduced CD34+ CB precursor cells. (A) Annexin-V versus EGFP expression. (B) TCR-β-PE versus EGFP expression. (C) TCR-β-PE and TCR-γδ-PE versus CD3-APCy expression of thymocytes also used for staining showed in (B), gated on EGFP+ cells. Quadrants were set to include 99% of cells stained with isotypic controls and EGFP− cells in lower left quadrant. Figures indicate percentage of cells present in corresponding quadrants.
T Cells Expressing nef Are Hyperproliferative Upon CD3 Triggering
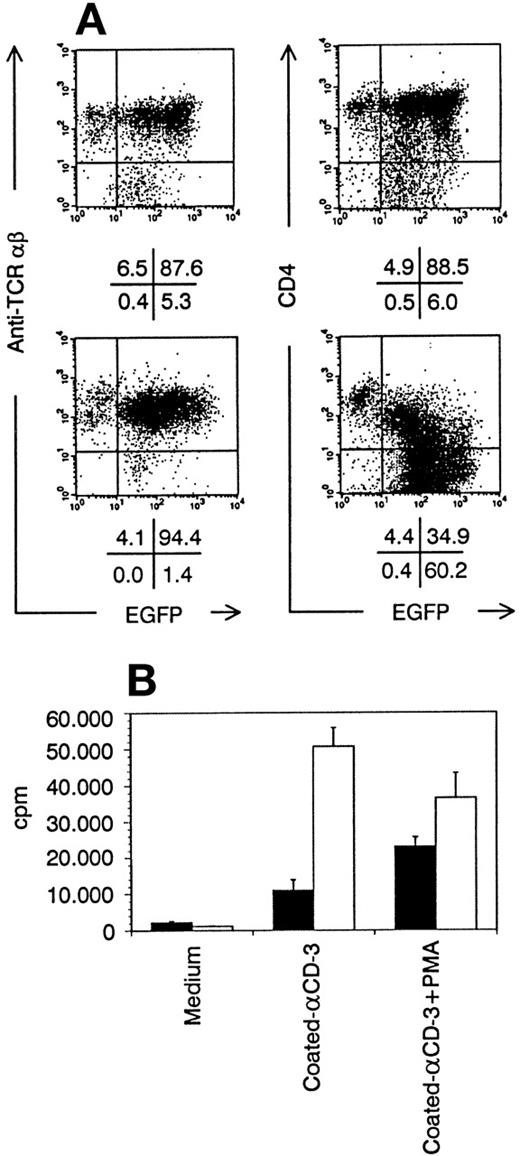
To assess whether nef expressing mature thymocytes were functionally impaired, we purified CD3+CD27+transduced SCID-hu thymocytes by cell sorting. By semiquantitative RT-PCR, no difference in IL-2 induction could be detected between Nef− and Nef+ transduced thymocytes (data not shown). Both Nef− and Nef+ transduced SCID-hu thymocytes could be expanded on irradiated PHA-stimulated PBMCs. Phenotypically, T cells from these cultures showed CD4 downmodulation (Fig 7A), and neither TCR-αβ (Fig 7A), CD8α, or CD25 expression levels (data not shown) were different from that of Nef− T cells. Few cells were CD8β+ (data not shown). As was the case with freshly sorted CD3+CD27+ transduced thymocytes, IL-2 mRNA could be induced as efficient in Nef+ as in Nef− T cells (data not shown). Proliferation upon TCR triggering was more pronounced in Nef+ transduced cultured T cells (Fig 7B). Unlike Nef−, Nef+transduced cultured T cells did not require addition of PMA for maximal proliferation in response to immobilized anti-CD3 antibody (Fig 7B). Functional assays were not different after removal of CD8β+/dim T cells by cell sorting (data not shown).
T cells grown from transduced thymocytes. (A) Bivariate dot plots of flow cytometric measurement of TCR-β-PE versus EGFP and CD4-APCy versus EGFP expression of T cells grown from Nef− transduced thymocytes (top) and Nef+transduced thymocytes (bottom). Quadrants were set to include 99% of cells stained with isotypic controls and EGFP− cells in lower left quadrant. Figures indicate percentage of cells present in corresponding quadrants. (B) Proliferation of Nef−(filled bars) and Nef+ (open bars) transduced T cells shown in (A), measured by 3H-thymidine incorporation. Medium, plain culture medium; coated-CD3, well coated with CD3 monoclonal antibody; cpm, counts per minute. Columns represent average of triplicate wells and error bars indicate standard deviation.
T cells grown from transduced thymocytes. (A) Bivariate dot plots of flow cytometric measurement of TCR-β-PE versus EGFP and CD4-APCy versus EGFP expression of T cells grown from Nef− transduced thymocytes (top) and Nef+transduced thymocytes (bottom). Quadrants were set to include 99% of cells stained with isotypic controls and EGFP− cells in lower left quadrant. Figures indicate percentage of cells present in corresponding quadrants. (B) Proliferation of Nef−(filled bars) and Nef+ (open bars) transduced T cells shown in (A), measured by 3H-thymidine incorporation. Medium, plain culture medium; coated-CD3, well coated with CD3 monoclonal antibody; cpm, counts per minute. Columns represent average of triplicate wells and error bars indicate standard deviation.
Nef Expression Does Not Affect Generation or Function of DCs
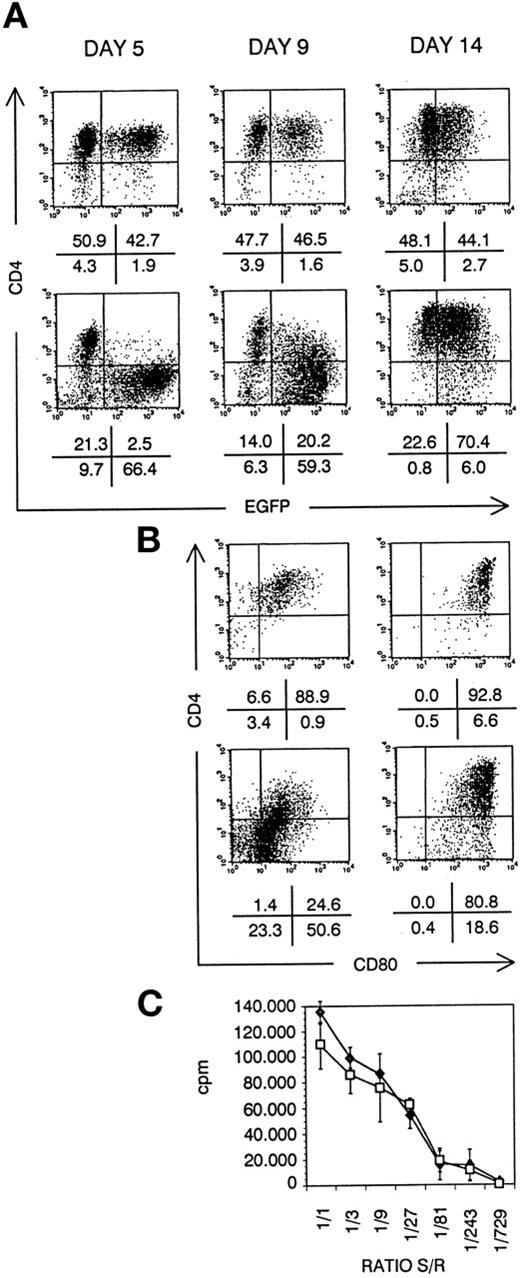
Besides thymocytes and T cells, also CD4+ APC are targets for HIV virus infection.32,33 Activation and aberrant antigen presentation has been reported with HIV-infected APC, such as DCs.34 To study the role of Nef in this process, we have generated DCs from transduced CD34+ CB cells in suspension culture. After 5 days of culture, Nef− transduced cultures contained EGFP+ dendritic cell precursors, expressing CD4. Nef+ transduced DC precursors did not express CD4 (Fig 8A). At day 9, onset of maturation is reflected by CD80 upregulation. On Nef+ transduced DCs, CD4 was concomitantly upregulated (Fig8B). Most Nef+ transduced mature DCs expressed normal CD4 levels (Fig 8A) in coexpression with CD80 (Fig 8B). In addition, more than 90% of both Nef− and Nef+transduced mature DCs were CD1a+CD40+CD80+HLA-DR+CD14−(data not shown). They displayed the same dendritic morphology and were generated in comparable numbers: 20-fold expansion of transduced CD34+ CB precursor cell numbers in 14 days of culture. No defect of Nef+ mature DCs in inducing an alloresponse of PBMCs could be detected (Fig 8C).
DC generated from transduced CD34+ CB cells. Bivariate dot plots of flow cytometric measurement of Nef− transduced cells (top) and Nef+ transduced cells (bottom). (A) CD4-APCy versus EGFP expression of cells at day 5, day 9, and day 14 of culture, as indicated. (B) CD4-APCy versus CD80-PE expression of cells shown in (A), gated on EGFP+ cells at day 9 and day 14 of culture, as indicated. Quadrants were set to include 99% of cells stained with isotypic controls and EGFP− cells in lower left quadrant. Figures indicate percentage of cells present in corresponding quadrants. (C) Proliferation of PBMCs seeded on irradiated sorted mature Nef− (⧫) or Nef+ (□) transduced DCs, measured by 3H-thymidine incorporation. Ratio S/R, ratio between number of DCs (stimulators, S) over number of PBMCs (responders, R); cpm, counts per minute. Points represent average of triplicate wells and error bars indicate standard deviation.
DC generated from transduced CD34+ CB cells. Bivariate dot plots of flow cytometric measurement of Nef− transduced cells (top) and Nef+ transduced cells (bottom). (A) CD4-APCy versus EGFP expression of cells at day 5, day 9, and day 14 of culture, as indicated. (B) CD4-APCy versus CD80-PE expression of cells shown in (A), gated on EGFP+ cells at day 9 and day 14 of culture, as indicated. Quadrants were set to include 99% of cells stained with isotypic controls and EGFP− cells in lower left quadrant. Figures indicate percentage of cells present in corresponding quadrants. (C) Proliferation of PBMCs seeded on irradiated sorted mature Nef− (⧫) or Nef+ (□) transduced DCs, measured by 3H-thymidine incorporation. Ratio S/R, ratio between number of DCs (stimulators, S) over number of PBMCs (responders, R); cpm, counts per minute. Points represent average of triplicate wells and error bars indicate standard deviation.
DISCUSSION
By retroviral gene transfer, we expressed the HIV molecular clone NL4-3nef gene,26 the nef gene used in previous studies on T-cell development in SCID-hu mice13,15-17 and Tg mice,18,19,21,22 in T-cell and DC precursors. We have shown here that expression of the nef gene induced abnormalities of T-cell development. The number of thymocytes generated from ISP4+ cells expressing nef was greatly reduced. Immature thymocytes generated from nef expressing precursor cells were CD4dim/-CD8β+/dim, while mature output was mainly CD3+CD4−CD8α+CD8βdim/-. The observed reduced cellularity and phenotypical alterations are similar to those observed in HIV-infected SCID-hu thymus.13-17 The phenotype of Nef+ transduced thymocytes strikingly resembles that of SCID-hu thymocytes productively infected with a pathogenic reporter NL4-3 HIV virus.13 The reporter virus allows detection of HIV gene expression in infected thymocytes in vivo. One month after infection, most HIV-expressing cells are CD4dim/-CD8+/dim, while a minor subset is DP. As we can reproduce this phenotype by expressingnef as the only HIV gene, phenotypical alterations of infected thymocytes may be primarily due to nef expression. Becausenef expression was shown in our experiments to severely diminish T-cell generation from ISP4+ cells, the attenuated pathogenic potential of nef defective HIV in SCID-hu mice15-17 could therefore be primarily due to the lack of direct cellular effects by Nef. Thymocytes expressing nef were not apoptotic or dead. Reduced T-cell generation in our experiments was therefore probably not caused by simple toxicity of Nef, but by a specific function of Nef in thymocytes. In our experiments, the phenotype and cell number of nontransduced thymocytes (EGFP−) present in the same thymus as Nef+ transduced cells was normal, indicating thatnef expression does not affect nontransduced cells. However, in SCID-hu thymus infection, nef defective HIV still retains some pathogenicity,16 indicating that cellular nefexpression alone is not responsible for all observed phenomena in HIV infection of the thymus.
Tg mice expressing NL4-3 nef driven by transcription control elements of either mouse TCRβ,18 mouse CD3δ,19 or human CD4C regulatory sequences22have been constructed. The thymic phenotypes of these Tg lines differed considerably: DP thymocytes were either found to be almost absent,18 present in reduced numbers,22 or present in normal to even increased numbers.19 However, all investigators observed a decrease of CD4 expression level and a reduced number of mature CD4+ thymocytes. Upon TCR triggering, proliferation19 and tyrosine phosphorylation of several substrates involved in TCR signaling22 was augmented innef transgenic thymocytes. By contrast, in mice Tg for a different nef allele than that of NL4-3, in which expression is controlled by human CD2 transcription control elements,20anti-CD3 + PMA-induced total thymocyte proliferation was reported to be diminished, and DP thymocyte numbers somewhat increased. These conflicting observations could, in part, be due to the difference in transcriptional control or the different nef allele used. Furthermore, observations in murine thymocytes may not mirror HIV Nef function in human thymocytes. Our observation that in vivo generated Nef+ thymocytes contained CD3+CD27+cells suggested that Nef+ transduced human thymocytes can acquire a mature phenotype, as we have previously shown that CD27 is a marker for functionally maturing human thymocytes.23 31Indeed, with purified transduced CD3+CD27+thymocytes, we did not observe an effect of nef expression on either proliferation or IL-2 mRNA induction upon in vitro stimulation (data not shown).
In our experiments, thymic output of Nef+ transduced mature CD4+ and CD8+ thymocytes was reduced. HIV infection of ISP4+ cells implies that both lineages could suffer from HIV-induced depletion. In accordance with this notion, thymic output of both CD4+ and CD8+ naive T cells is decreased in HIV-infected patients.11 In HIV-infected individuals, production of both lineages correlates and increases during highly active antiretroviral therapy.35The mechanism of reduced T-cell generation from nef-expressing precusor cells is unclear. Theoretically, it could be the result of increased negative selection or of an inefficient positive selection36 of immature nef expressing thymocytes. We could not show that nef expressing thymocytes are hyperresponsive upon TCR triggering. This argues against Nef-induced negative selection, as negative selection is expected to result from hyperresponsiveness on TCR triggering in thymocytes.36Also, nef-expressing thymocytes were not apoptotic (Fig 6A) and did not upregulate Fas ligand levels (data not shown). These results are in line with the observation that HIV NL4-3–infected SCID-hu mice do not show increased thymocyte apoptosis in vivo compared with mock-infected mice.37 Alternatively, the reduced generation of nef-expressing T cells could be due to Nef-mediated downregulation of CD4 and CD8β. Loss of coreceptors CD4 or CD8β has been shown to hamper positive selection of the respective lineages, at least in mice.38,39 Most likely, these receptors are also essential in man, so that inefficient positive selection of human thymocytes expressing nef may contribute to a decreased output of T cells. As some of the domains of NL4-3 nef that are important for pathogenicity in SCID-hu thymus have recently been described,17 use of relevant nef mutants could provide some insight into the mechanism of reduced thymocyte generation reported here.
T cells isolated from adult peripheral blood were found to downregulate CD8β, but not CD8α after transduction with Nef+supernatant (data not shown). This indicates that decreased expression of CD8β on Nef+ transduced thymocytes is not merely a reflection of the disturbed thymocyte development, but that it is an intrinsic property of Nef. Earlier reports demonstrated that Nef did not downregulate human CD8α in cell lines,9,40,41 but human CD8β was never addressed. A dileucin motif was found to be essential in the CD4 cytoplasmic tail for Nef-mediated CD4 downregulation.41 Similar to MHC class I, the cytoplasmic tail of CD8β does not contain a dileucin motif.42 In MHC class I, a tyrosine-based motif present in HLA-A and HLA-B, but not in HLA-C, was shown to be essential for Nef-induced downmodulation.43 At least 1 tyrosin residue is present in the cytoplasmic tail of all CD8β splice variants,42 but not in the motif as found in HLA-A and HLA-B.43 The mechanism of TCR upregulation and coreceptor CD8β downmodulation by Nef+ transduced thymocytes remains elusive.
In contrast to CD3+CD27+ thymocytes, we observed increased proliferation upon TCR triggering in Nef+ transduced cultured T cells compared with Nef− transduced cells. Nef-induced TCR hyperresponsiveness may promote virus production in quiescent peripheral T cells.44,45 Rapid progression towards an AIDS-like syndrome, observed in SIV-infected macaque monkeys, was found to be correlated with a nef allele that allowed SIV infection of resting PBMC cultures and that mediated SIV-induced T-cell activation.46 Activation of T cells by HIV renders them prone to apoptosis32 and may contribute to peripheral T-cell loss. It is unclear why cultured T cells, but not mature thymocytes expressing nef, were hyperproliferative upon TCR triggering. Differences in TCR-mediated response in thymocytes, as opposed to T cells, could be at the basis of this observation.47 Direct activation, including Fas ligand upregulation, of Jurkat T cells by Nef was recently shown to involve association with TCR ζ chain.48 It remains to be determined whether this holds true for primary T cells.
Hanna et al21 constructed mice Tg for the NL4-3 HIV genome under control of human CD4C transcriptional control elements. By use of mutant NL4-3 genomes, they showed that the AIDS-like pathology observed in NL4-3 HIV Tg was entirely due to nefexpression.22 These mice express nef not only in CD4+ thymocytes and T cells, but also in cells of the DC/macrophage lineage. Expression of nef in APC may therefore be significant in disease induction. Deficient or aberrant APC function in HIV infection has been reported34 and very likely contributes to AIDS. Immature DCs are targets for productive HIV infection, whereas mature DCs are efficient transmitters of HIV to T cells.33 Here we showed that Nef+ transduced mature DCs were phenotypically similar to Nef−transduced DCs and were not compromised in inducing an alloresponse in PBMCs. DC generation and maturation in suspension cultures and in the thymus was not affected by nef expression. In contrast to DC precursors, Nef+ transduced mature DCs expressed normal CD4 levels, possibly reflecting reduced endocytotic activity.49A minority of the few CD4+ Nef+ transduced thymocytes we observed in our experiments (Figs 3B and 5A) were DCs. By downmodulation of CD4 in immature DCs, nef might prevent or hamper superinfection.8 Our results suggest thatnef does not affect function of mature DCs, which may be relevant for HIV transmission to T cells.33
We thus show here a direct effect of nef expression on human T-cell generation and activation in the absence of any other HIV gene. These results may give clues in understanding HIV-induced immunopathology and provide a rationale for therapeutic interventions to block Nef function in vivo.
ACKNOWLEDGMENT
The authors thank N. Decabooter, C. De Boever, A. Moerman, V. Debacker, M.-J. De Bosscher for technical assistance, A. De Creus, K. Van Beneden, Dr J. Van Emmelo, Dr J. De Boever for expert technical advice, Drs B. Vandekerckhove, G. Leclercq for critical reading of the manuscript and continuous support, the Departments of Obstetrics, Cardiac Surgery, and Pathology for the supply of human tissue, the Department of Radiotherapy and Nuclear Medicine for irradiation facilities, Dr H. Spits and collaborators (The Netherlands Cancer Institute, Amsterdam, The Netherlands) for the gift of the IRES-EGFP construct, Dr G.P. Nolan (Stanford University School of Medicine, Stanford, CA) for the gift of the Phoenix-NA packaging cell line and the LZRS vector. The following reagents were obtained through the AIDS Research and Reference Reagent Program, Division of AIDS, NIAID, NIH: pNL4-3 from Dr Malcolm Martin, HIV-1 Nef Monoclonal Antibody (EH-1) and Sup-T1 cells from Dr J. Hoxie.
Supported by grants from the Gezamelijk Overlegde Actie (GOA) University of Ghent, the Fund for Scientific Research–Flanders (Belgium), and the VIB. B.V. and T.K. are research assistants and D.V. is a postdoctoral research fellow of the Fund for Scientific Research–Flanders (Belgium). E.N. is a VIB employee.
The publication costs of this article were defrayed in part by page charge payment. This article must therefore be hereby marked “advertisement” in accordance with 18 U.S.C. section 1734 solely to indicate this fact.
REFERENCES
Author notes
Address reprint requests to Bruno Verhasselt, MD, Department of Clinical Chemistry, Microbiology and Immunology, University of Ghent, University Hospital of Ghent, 4 Blok A De Pintelaan 185, B-9000 Ghent, Belgium; e-mail: Bruno.Verhasselt@rug.ac.be.

