Abstract
We have previously demonstrated that endothelin-1 (Et-1) induces human central nervous system-derived endothelial cells (CNS-EC) to produce and secrete the chemokine interleukin 8 (IL-8). In the present study, we use specific inhibitors and activators to elucidate the signal transduction pathways involved in this process. Et-1–induced IL-8 production was blocked by ETA receptor antagonist BQ610, but not by ETB receptor antagonist BQ788, demonstrating that CNS-EC activation is initiated by Et-1 binding to the ETA receptor. IL-8 mRNA expression is blocked by the protein kinase C inhibitor bisindolylmaleimide or protein tyrosine kinase inhibitors, genestein and geldanamycin, establishing the involvement of the protein kinase C and protein tyrosine kinase pathways in the activation process. The transcription factor, NF-κB, is involved in Et-1 activation as determined by specific inhibitors of translocation and direct analysis of DNA-binding proteins. Neither inhibition nor activation of cAMP-dependent protein kinase affected IL-8 production in the absence or presence of Et-1. Similarly, no effect was observed upon inhibition of protein phosphatases by okadaic acid. Thus, the signal transduction process induced by Et-1 in CNS-EC, leading to increased mRNA IL-8 expression, is initiated by Et-1 binding to ETA receptor followed by subsequent activation of protein kinase C, protein tyrosine kinase, and NF-κB. Because increased expression of Et-1 is associated with hypertension and stroke and IL-8 is likely to be involved in the accumulation of neutrophils causing tissue damage in ischemic/reperfusion injury, identification of the mechanism involved in the Et-1–induced increase in IL-8 production may have significant therapeutic value.
ENDOTHELIN-1 (Et-1), a 21 amino acid peptide produced by various cell types, including cerebral microvessels, mediates vasoconstriction.1-3 This peptide was reported to be increased in the plasma and cerebrospinal fluid of patients with hypertension, ischemic stroke, and subarachnoidal hemorrhage.4-7 Recent evidence demonstrated the pathologic significance of Et-1, as shown by the correlation between reduced Et-1 activity and decreased lesion size in reperfusion injury after middle cerebral artery occlusion in rats.8 In the investigation of the mechanisms of Et-1–mediated pathology, we found that this peptide induced the production of the chemokine interleukin-8 (IL-8) in human central nervous system-derived endothelial cells (CNS-EC).9
IL-8, an α chemokine, is produced predominantly by macrophages10-12 and endothelial cells13 and is characterized by its potent and selective stimulatory effects on neutrophils, which include chemotaxis,14degranulation,15 respiratory burst,16 cell shape change, exocytosis of secretory vesicles and azurophil granules, expression of surface adhesion molecules, production of superoxide and hydrogen peroxide reactive oxygen metabolites,17,18activation of 5-lipogenase,19 and the release of cell matrix resorbing gelatinase and elastase.18 Studies have shown that ischemic brain injury involves the initial influx of neutrophils and that depletion of these cells or blocking their entry into the brain leads to a significant reduction in ischemic damage.20 21 Et-1–induced IL-8 production may, therefore, be involved in tissue damage during ischemia/reperfusion injury.
In the present work, we addressed the question of the intracellular signal transduction pathway(s) used by Et-1 in inducing increased IL-8 production in CNS-EC. Biological effects of Et-1 are mediated by 2 types of Et receptors, ETA and ETB, and involve multiple intracellular signal transduction pathways, including activation of GTP-binding proteins, phospholipases, protein kinases and phosphatases, and various transcription factors (see Sokolovsky22 and Levin23 for reviews). It has been suggested that a single ET receptor might evoke diverse signaling pathways by activating multiple G proteins; these may, in turn, activate single or multiple effectors, forming a network in which various combinations of receptors and G proteins interact to activate signal transduction pathways optimized for physiological regulation in different cells.24 Moreover, the signal transduction upon Et-1 binding to its receptor may differ among species and tissues. The data presented here demonstrate that, in human CNS-EC, Et-1 induces increased IL-8 mRNA and protein production via ETA receptor, protein kinase C (PK-C)–dependent and protein tyrosine kinase (PTK)-dependent pathways without involvement of the cAMP-dependent pathway.
MATERIALS AND METHODS
Reagents.
The following reagents were purchased: Et-1 (Peninsula Lab, Belmont, CA); ETA receptor antagonist, BQ610, and ETBreceptor antagonist, BQ788, from Alexis Corp (San Diego, CA); cAMP-dependent protein kinase (PK-A) inhibitor, H-89, PK-C inhibitors, bisindolylmaleimide-GF109203-X (GF) and Calphostin C; tyrosine kinase inhibitors, genistein and geldanamycin, and inactive genistein analog daidzen; and phosphoserine/phosphothreonine phosphatase inhibitor okadaic acid from Calbiochem (La Jolla, CA); dibutyryl-cAMP; phorbol-12-myristate-13-acetate (PMA); 4-α-phorbol (inactive analog of PMA) and the NF-kB inhibitor, pyrrolidinedithiocarbamate (PDTC), from Sigma (St Louis, MO). PK-C assay kits were purchased from GIBCO Life Technologies (Gaithersburg, MD).
Cell culture.
CNS-EC were derived from human brain as previously described in detail.25 Cells were cultured in RPMI-1640 medium (GIBCO Life Technologies, Grand Island, NY) supplemented with 100 ng/mL endothelial cell growth factor Endogro (VECTEC, Albany, NY), 2 mmol/L L-glutamine, 10 mmol/L HEPES, 24 mmol/L sodium bicarbonate, 300 USP units of heparin, 1% penicillin/streptomycin, and 10% fetal calf serum (FCS). Endogro-free, 0.1% FCS medium was used 24 hours before the experiment. The purity of CNS-EC (95%) was confirmed by immunocytochemical staining for von Willibrand factor (vWF), glial fibrillary acidic protein (GFAP) for astrocytes, and CD11b for the macrophages, as previously described.25 Cells were used until passage 4 or 5 only, because it was found that with increasing passage number above 7, the intensity of vWF and γ glutamyl transpeptidase decreased.
RNase protection assay (RPA).
The radioactively labeled RNA antisense probes were prepared following the manufacturer’s protocol. Using the In Vitro Transcription Kit (Pharmingen, San Diego, CA), 10 μL of [32P]UTP (3,000 Ci/mmol, 10 mCi/mL; NEN Research,Wilmington, DE) and 1 μL GACU pool were added to the RPA Template Set (HCK-5), a human chemokine multiprobe set including IL-8 and the housekeeping gene, glyceraldehyde-3-phosphate dehydrogenase (GAPDH; Pharmingen); also included were T7 polymerase, dithiothreitol (DTT), RNAsin, and transcription buffer, as suggested by the manufacturer. The reaction was terminated by adding 2 μL of DNase for 30 minutes at 37°C. The probe was then extracted using Tris-saturated phenol:chloroform:isoamylalcohol (25:24:1; GIBCO Life Technologies) and chloroform:isoamylalcohol sequentially and then was ethanol precipitated. The radiolabeled RNA pellet was air-dried and solubilized with hybridization buffer. RNA from 2 to 3 × 10⁶ cultured cells per experimental group was isolated and prepared according to a modification of the acid phenol method using the Trizol reagent (Life Technologies) as specified by the manufacturer. Total RNA (10 μg) together with 6 × 10⁵ cpm of probe was heat-denatured at 90°C and then hybridized overnight at 56°C. Subsequently, the samples were treated with the RNase cocktail, followed by proteinase K cocktails, and then precipitated using ammonium acetate and ethanol. Air-dried samples were solubilized in loading buffer, denatured at 90°C for 3 minutes, and then placed on ice. The protected fragments were resolved in 5% acrylomide 8 mol/L urea gel (24 cm length); the gel was dried and exposed using Hyper film (Amersham Life Science, Arlington Heights, IL) at −70°C . The protected bands were observed for IL-8 (181 bp) and GAPDH (96 bp). The data are presented as the ratios of the spectrophotometric densities of IL-8 to GAPDH bands. The manufacturer’s recommended yeast tRNA negative and positive controls were included in every RPA experiment.
Reverse transcriptase-polymerase chain reaction (RT-PCR) analysis.
Endothelial cells were treated and total RNA was isolated as described above. To synthesize cDNA, 1 μg of denatured total RNA was incubated in 20 μL of reaction buffer (5 mmol/L MgCl2, 50 mmol/L KCl, 10 mmol/L Tris-HCl, pH 8.3) with 2.5 μmol/L oligo(dT) primer and murine leukemia virus reverse transcriptase (RT; 2.5 U/mL), which was purchased as an RT-PCR kit (Perkin-Elmer, Foster City, CA). The reverse transcription reaction was performed in 1 cycle: 42°C for 20 minutes, 99°C for 5 minutes, and 5°C for 5 minutes. PCR reactions were performed using 5 μL of cDNA, which was diluted 1:4 for ETA and ETB receptors and 1:10 for β-actin in the presence of the reaction buffer, a 0.3 μmol/L concentration of each primer (Clontech, Palo Alto, CA), and 2.5 U oftaq polymerase (Perkin-Elmer) in a total volume of 50 μL. These dilution factors were based on the log-linear relationship between the mRNA and the signal intensity of the PCR product. The PCR reaction was performed as follows: 94°C for 1 minute and 45 seconds (1 cycle); 94°C for 15 seconds, 60°C for 30 seconds, and 72°C for 30 seconds (32 cycles); and 72°C for 6 minutes and 4°C for 5 minutes (1 cycle). PCR analysis was performed using the human ETA receptor primers (sense primer [5′], 5′AGC TTC CTG GTT ACC ACT CAT CAA 3′; and antisense primer [3′], 5′ TCA ACA TCT CAC AAG TCA TGA G 3′) and ETB receptor primers (sense [5′], 5′ CGA GCT GTT GCT TCT TGG AGT AG 3′; and antisense [3′], 5′ ACG GAA GTT GTC ATA TCC GTG ATC 3′). The sizes of the ETA and ETB receptor PCR products are 714 and 701 bp, respectively. The human β-actin primer, used as the control, was the following: sense primer (5′), 5′ GTG GGG CGC CCC AGG CAC CA 3′; and antisense primer (3′), 5′ CTC CTT AAT GTC ACG CAC GAT TTC 3′. The size of the PCR product is 548 bp. The reverse transcriptase and PCR reactions were performed in DNA thermal cycles (Perkin-Elmer Gene Amp PCR system 2400). Ten-microliter PCR products were electrophoresed through a 1.5% agarose gel and visualized by ethidium bromide staining. The gel pattern was documented using the signal analytic system and the band intensities were measured using the IP Lab gel program (BT Scientific Technologies, Carlsbad, CA).
PK-C assay.
Endothelial cells were treated as described in the previous sections. The PK-C assays were performed using PK-C assay kits obtained from GIBCO Life Technologies. Briefly, the experimental treatments were terminated by replacing the medium with the cell extraction buffer (20 mmol/L Tris, 0.5 mmol/L EDTA, 0.5 mmol/L EGTA, and 25 μg/mL each of aprotinin and leupeptin, pH 7.5) at room temperature. The cells were then homogenized with a precooled dounce homogenizer and the cytosol and membrane fractions were separated by centrifugation (10,000g for 30 minutes) at 4°C. The supernatants were collected as the cytosol fraction. The pellets were resuspended in 0.5 mL of extraction buffer with the detergent (1% NP-40). Membrane fractions were obtained by centrifugation (10,000g for 10 minutes at 4°C) and collecting the supernatants. PK-C in both membrane and cytosol fraction was partially purified by ion exchange chromatography (DE-52 cellulose column). The determinations of PK-C activity in the cytosol and membrane fractions were performed according to the manufacturer’s instructions. The specific PK-C substrate was a synthetic peptide from myelin basic protein (amino acids 4-14) with an acetylated N-terminal glutamine, and the specific inhibitor was a peptide (amino acids 19-36) derived from the same protein that binds to the pseudo substrate region of the regulatory domain. The specific PK-C activity was determined as the difference between phosphorylation of the PK-C specific substrate in the absence or presence of the specific PK-C inhibitor. The data are presented as ratios of the membrane and the total (cytosol + membrane) PK-C activities.
Electrophoretic mobility shift assay (EMSA).
CNS-EC were grown to confluence in 100-mm Petri dishes (107cells/dish), treated with Et-1 (10−8 mol/L), with tumor necrosis factor (TNF; 10 pg/mL), or left untreated for 1 hour. Cells were then washed twice with ice-cold phosphate-buffered saline (PBS), scraped in 15 mL of PBS/plate, and centrifuged at 1,200 rpm for 10 minutes at 4°C. Cell pellets were then resuspended in 400 μL of buffer A (10 mmol/L HEPES [pH 7.9], 1.5 mmol/L MgCl2, 10 mmol/L KCl, 0.5 mmol/L DTT, 0.5 mmol/L phenylmethyl sulfonyl fluoride [PMSF], 2 μg/mL leupeptin, and 2 μg/mL antipain) and placed on ice for 10 minutes; NP-40 (4%) was added to each tube to reach a final concentration of 0.1%. The tubes were vortexed and centrifuged at 14,000 rpm for 30 seconds at 4°C, and the supernatants were removed. The nuclear pellet was resuspended in 50 μL of buffer C (20 mmol/L HEPES, 25% glycerol, 1.5 mmol/L MgCl2, 300 mmol/L NaCl, 0.25 mmol/L EDTA, 0.5 mmol/L PMSF, 2 μg/mL leupeptin, and 2 μg/mL antipain), vortexed, and placed on ice for 20 minutes. Samples were centrifuged at 14,000 rpm for 10 minutes at 4°C. Protein concentrations were determined using the Bio-Rad protein assay kit (Bio-Rad Laboratories, Hercules, CA) with bovine serum albumin as the standard. Nuclear extracts were diluted to 20 μg/μL with buffer C, aliquoted, and stored at −120°C. EMSA was performed using Gel Shift Systems (Promega, Madison, WI). The double-stranded oligonucleotides containing transcription factor binding sites for NF-κB and AP-1 used in this assay were commercially available (Promega). The NF-κB binding site oligonucleotide was end-labeled with [γ-32P]ATP (ICN Pharmaceuticals Inc, Costa Mesa, CA) by incubation with T4 Polynucleotide Kinase (Promega) at 37°C for 10 minutes. The labeled probe was separated from unincorporated nucleotide using G-25 spin columns (Amersham Pharmacia Biotech, Piscataway, NJ). Nuclear extracts (20 μg) were incubated with 10,000 cpm of labeled probe in a binding buffer containing 10 mmol/L Tris-HCl (pH 7.5), 4% glycerol, 1 mmol/L MgCl2, 0.5 mmol/L EDTA, 0.5 mmol/L DTT, 50 mmol/L NaCl, 0.05 mg/mL poly(dI-dC).(dI-dC) for 30 minutes at 4°C. Unlabeled specific (NF-κB) or nonspecific (AP-1) binding site competitors, at 100-fold excess, were added to the reaction at this time to serve as controls. Reaction products were analyzed by electrophoresis using 5% nondenaturing polyacrylamide gels (0.5× Tris-borate-EDTA buffer) at 4°C for 2 hours. Gels were vacuum-dried and exposed to x-ray film for 1 or 2 days.
Statistics.
Values were presented as the mean ± standard error of the mean (SEM), unless otherwise stated. Statistical significance was evaluated using the unpaired Student’s t-test or ANOVA followed by Bonferroni’s test using ProStat software (Poly Software International, Salt Lake City, UT); P < .05 was considered significant.
RESULTS
Both ETA and ETB receptors are expressed by CNS-EC.
Et-1 action can be mediated via 2 main types of endothelin receptor, ETA or ETB. It was originally postulated that EC predominantly express ETB receptors26; however, the presence of ETA receptors on the surface of human CNS-EC has been reported.27 The RT-PCR results using specific ETA and ETB receptor probes on 3 different primary CNS-EC cell cultures are shown in Fig 1; these data demonstrate the expression of mRNA for both receptor types by human CNS-EC. In contrast, human umbilical vein endothelial cells (HUVECs) expressed only the ETB receptor mRNA (Fig 1).
The expression of ETA and ETBreceptors on CNS-EC and HUVECs. RNA from cells from 3 different CNS-EC cultures and 1 sample of HUVECs was extracted and examined using PCR primers for ETA (lanes 1 through 4), ETB (lanes 5 through 8) receptors, and β-actin (lanes 9 through 12). The CNS-EC are grouped in lanes 1, 5, and 9; 2, 6, and 10; and 3, 7, and 11. HUVEC RNA is shown in lanes 4, 8, and 12. M designates the marker lane.
The expression of ETA and ETBreceptors on CNS-EC and HUVECs. RNA from cells from 3 different CNS-EC cultures and 1 sample of HUVECs was extracted and examined using PCR primers for ETA (lanes 1 through 4), ETB (lanes 5 through 8) receptors, and β-actin (lanes 9 through 12). The CNS-EC are grouped in lanes 1, 5, and 9; 2, 6, and 10; and 3, 7, and 11. HUVEC RNA is shown in lanes 4, 8, and 12. M designates the marker lane.
Et-1 activation in CNS-EC is mediated by the ETAreceptor.
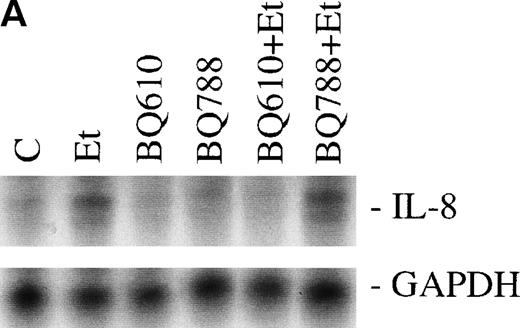
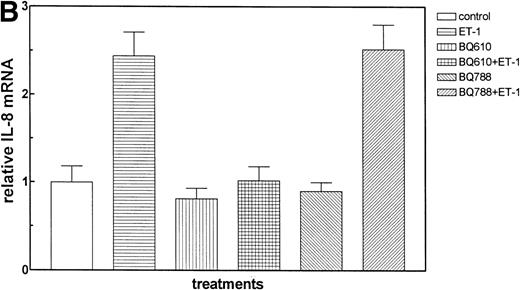
The effect of Et-1 on IL-8 secretion by human CNS-EC has been previously reported.9 We demonstrated that cells incubated with an optimal concentration of Et-1 (100 nmol/L) for 1 hour exhibited an upregulation of IL-8 mRNA expression; Et-1–induced IL-8 protein was detected within 24 hours. To ascertain the identity of the functional Et-1 receptor type(s) in CNS-EC for IL-8 mRNA expression, we used a specific ETA receptor antagonist, BQ610, or ETBreceptor antagonist, BQ788, concomitantly with Et-1. Cells were pretreated with the Et-1 receptor antagonists for 20 minutes, followed by incubation with Et-1 for 1 hour; subsequently, IL-8 mRNA was analyzed using the RPA. The data for this and all other figures were calculated as the ratios of IL-8 mRNA to GAPDH mRNA and are presented in graphic form as relative mRNA values. Concentrations of receptor antagonists, ranging from 200 nmol/L to 1 μmol/L, were previously tested. Figure 2 demonstrates that treatment with BQ610 at the lowest concentration (200 nmol/L) completely abolished the IL-8 mRNA increase by Et-1, whereas BQ788 (200 nmol/L) had no effect. BQ610 and BQ788, at the highest concentration (1 μmol/L), gave essentially identical results. These data demonstrate that Et-1 activation in CNS-EC is mediated by ETA receptor. The data are representative of 3 experiments.
The effect of Et receptor antagonists. The CNS-EC were pretreated with 200 nmol/L ETA receptor antagonist, BQ610, or 200 nmol/L ETB receptor antagonist, BQ788, for 20 minutes, followed by 1 hour of incubation with 100 nmol/L Et-1. In all of the experiments presented, cells were treated with Et-1 for 1 hour. Subsequently, RNA was isolated from the cells, and the RPA was performed. The results are visualized by autoradiography; protected fragments corresponding to IL-8 (181 bp) and GAPDH (96 bp) are shown (A). The data in this and subsequent figures were calculated as the ratios of IL-8 mRNA to GAPDH mRNA and are presented relative to the control values (B). The data presented are representative of 1 of 3 replicate experiments performed. The error bars represent the SEM.
The effect of Et receptor antagonists. The CNS-EC were pretreated with 200 nmol/L ETA receptor antagonist, BQ610, or 200 nmol/L ETB receptor antagonist, BQ788, for 20 minutes, followed by 1 hour of incubation with 100 nmol/L Et-1. In all of the experiments presented, cells were treated with Et-1 for 1 hour. Subsequently, RNA was isolated from the cells, and the RPA was performed. The results are visualized by autoradiography; protected fragments corresponding to IL-8 (181 bp) and GAPDH (96 bp) are shown (A). The data in this and subsequent figures were calculated as the ratios of IL-8 mRNA to GAPDH mRNA and are presented relative to the control values (B). The data presented are representative of 1 of 3 replicate experiments performed. The error bars represent the SEM.
PK-A–dependent pathway is not involved in Et-1–induced IL-8 production.
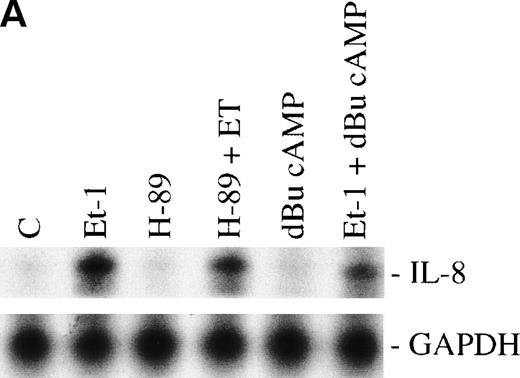
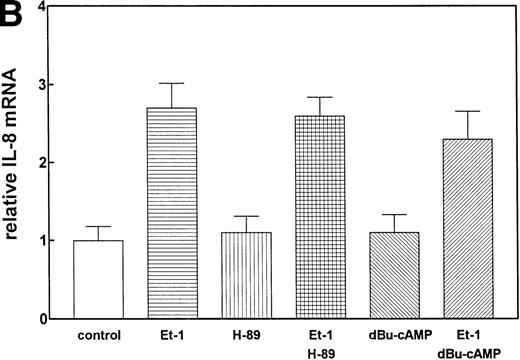
We have previously observed that Et-1 activates PK-A in human CNS-EC,27a and others have shown that agents which increase cAMP increase IL-8 protein production.28 We therefore tested the effects of PK-A activation or inhibition on Et-1–induced IL-8 production in CNS-EC. Confluent cultures of CNS-EC were treated with Et-1 (100 nmol/L) alone or pretreated with the specific PK-A inhibitor, H-89 (0.5 μmol/L), or the PK-A–activating cAMP analog dibutyryl-cAMP (dBu-cAMP; 300 μmol/L) for 30 minutes, followed by the addition of Et-1 for 1 hour (Fig 3). The results show that direct activation of PK-A by dBu-cAMP did not affect IL-8 mRNA expression; moreover, H-89 and dBu-AMP treatments did not modify the Et-1–induced IL-8 mRNA synthesis, demonstrating that the PK-A–dependent pathway is not involved in this effect of Et-1.
The role of cAMP-dependent pathway. The CNS-EC were pretreated for 30 minutes with 0.5 μmol/L of the specific PK-A inhibitor, H-89, or with 300 μmol/L of PK-A–activating cAMP analog dBu-cAMP, followed by 1 hour of incubation with 100 nmol/L Et-1. The autoradiographic (A) and graphic data (B) are presented as described in Fig 2.
The role of cAMP-dependent pathway. The CNS-EC were pretreated for 30 minutes with 0.5 μmol/L of the specific PK-A inhibitor, H-89, or with 300 μmol/L of PK-A–activating cAMP analog dBu-cAMP, followed by 1 hour of incubation with 100 nmol/L Et-1. The autoradiographic (A) and graphic data (B) are presented as described in Fig 2.
Et-1 increases PK-C activity.
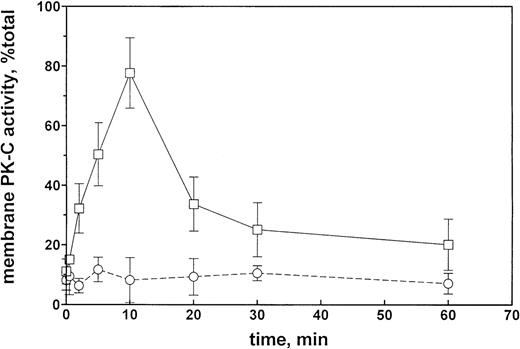
The time course of the effect of 100 nmol/L Et-1 on membrane PK-C activity in CNS-EC is shown on Fig 4. The increase in PK-C activity was significant at 2 minutes, reached a maximum at 10 minutes, sharply decreased by 20 minutes, and thereafter slowly decreased to the longest observed time of 60 minutes, when the activity was still above the control levels (Fig 4). The effect was completely inhibited by the presence of GF (1 μmol/L).
PK-C activity of CNS-EC as a function of the duration of Et-1 treatment. Et-1 concentration was 100 nmol/L, and the GF concentration was 1 μmol/L. PK-C activity is expressed as a ratio of the membrane to total activities. Solid line, in the absence of GF; broken line, in the presence of GF.
PK-C activity of CNS-EC as a function of the duration of Et-1 treatment. Et-1 concentration was 100 nmol/L, and the GF concentration was 1 μmol/L. PK-C activity is expressed as a ratio of the membrane to total activities. Solid line, in the absence of GF; broken line, in the presence of GF.
Involvement of PK-C in increased IL-8 mRNA expression.
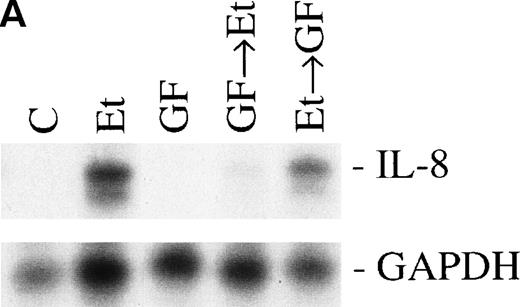
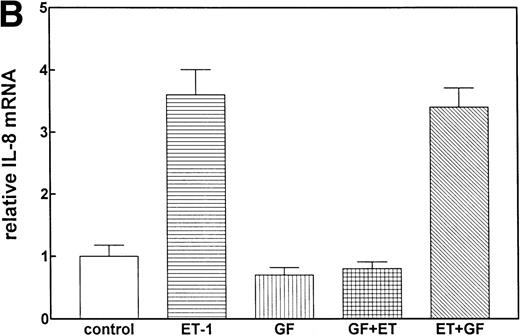
Previous studies have reported that the PK-C–associated signal transduction pathway may regulate IL-8 production in either a positive or negative manner, depending on the cell type and the stimulus involved.29-31 To test the involvement of the PK-C–dependent signal transduction pathway in Et-1–induced IL-8 mRNA expression, human CNS-EC were treated with Et-1 as described above or incubated with the specific PK-C inhibitor GF (1 μmol/L) 30 minutes before exposure to Et-1. The results in Fig5 show that preincubation of the cells with GF completely eliminated the Et-1–induced increase in IL-8 mRNA. Similar results were obtained with another PK-C inhibitor, calphostin C (data not shown). To determine the relevance of the early PK-C activation on the delayed IL-8 response, GF was added to the cells 30 minutes after the initial exposure of the cells to Et-1; the experiment was terminated after 1 hour of incubation, as described previously. The data showed that the addition of GF 30 minutes after exposure to Et-1 had no effect on Et-1–induced IL-8 mRNA expression (Fig 5), demonstrating that the early increase in PK-C activity is necessary and sufficient for IL-8 mRNA induction.
The role of PK-C–dependent pathway. In 1 group (GF+Et), the cells were pretreated for 30 minutes with 1 μmol/L of the specific PK-C inhibitor GF, followed by 1 hour of incubation with 100 nmol/L Et-1. In another group (Et+GF), GF was added 30 minutes after the initial treatment with Et-1. Cells were treated with Et-1 for a total of 1 hour. The autoradiographic (A) and graphic data (B) are presented as described in Fig 2.
The role of PK-C–dependent pathway. In 1 group (GF+Et), the cells were pretreated for 30 minutes with 1 μmol/L of the specific PK-C inhibitor GF, followed by 1 hour of incubation with 100 nmol/L Et-1. In another group (Et+GF), GF was added 30 minutes after the initial treatment with Et-1. Cells were treated with Et-1 for a total of 1 hour. The autoradiographic (A) and graphic data (B) are presented as described in Fig 2.
PTK pathway involved in Et-1 activation.
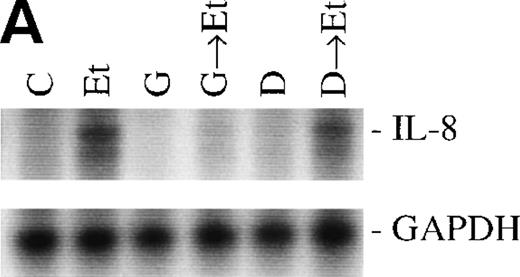
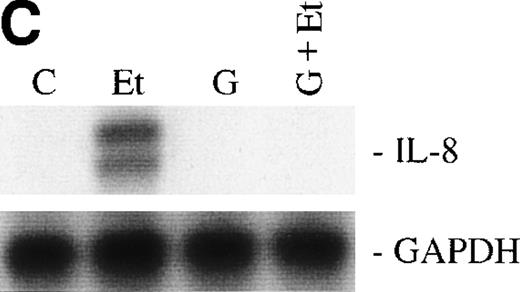
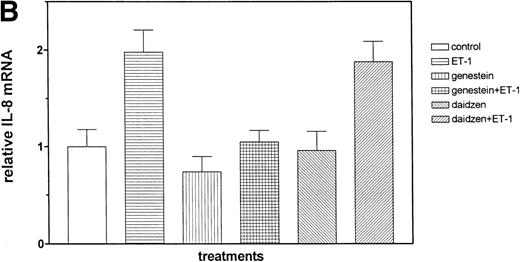
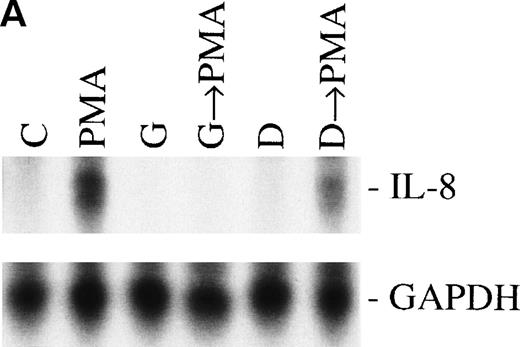
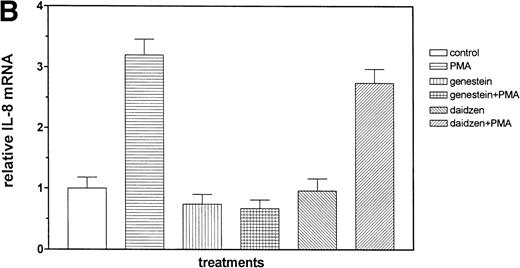
We then examined the role of PTKs in Et-1–induced IL-8 mRNA expression in CNS-EC. Cells were treated with the PTK inhibitor genistein (37 μmol/L) for 15 minutes before the addition of Et-1; after 1 hour of incubation, the experiment was terminated as described above. The data in Fig 6A and B demonstrated that genistein completely abolished the effect of Et-1, whereas the inactive genistein analog daidzen (39 μmol/L) had no such effect. Another PTK inhibitor, geldanamycin (178 nmol/L), which specifically inhibits p60 c-src tyrosine kinase, also inhibited Et-1–induced IL-8 mRNA expression (Fig6C). From these experiments, it was apparent that both the PK-C and PTK pathways were involved in this Et-1 signaling pathway. Further studies were performed to determine whether the effects of PK-C–dependent or PTK-dependent pathways in IL-8 mRNA induction were sequential or parallel. As shown in Fig 7, treatment of CNS-EC for 1 hour with PK-C activator PMA (1 nmol/L) upregulated IL-8 mRNA expression; the inactive PMA analog 4-α-phorbol had no effect (data not shown). Pretreatment (15 minutes) with the PTK inhibitor genistein completely abolished the effect of PMA, demonstrating that PTK activation is downstream from PK-C activation in this process.
The role of PTKs. The cells were pretreated for 15 minutes with the specific PTK inhibitor genistein (37 μmol/L) or the inactive genistein analog daidzen (39 μmol/L), followed by 1 hour of incubation with 100 nmol/L Et-1; data are shown in an autoradiograph (A) and graphically (B). CNS-EC were pretreated with geldanamycin (178 nmol/L) for 16 hours, followed by 1 hour of incubation with 100 nmol/L Et-1. The autoradiograph of the RPA for IL-8 mRNA is shown (C).
The role of PTKs. The cells were pretreated for 15 minutes with the specific PTK inhibitor genistein (37 μmol/L) or the inactive genistein analog daidzen (39 μmol/L), followed by 1 hour of incubation with 100 nmol/L Et-1; data are shown in an autoradiograph (A) and graphically (B). CNS-EC were pretreated with geldanamycin (178 nmol/L) for 16 hours, followed by 1 hour of incubation with 100 nmol/L Et-1. The autoradiograph of the RPA for IL-8 mRNA is shown (C).
Sequential activation of PK-C and PTK. The cells were treated for 1 hour with 1 nmol/L of the PK-C activator PMA or pretreated for 15 minutes with the specific PTK inhibitor genestein (37 μmol/L) or the inactive genestein analog daidzen (39 μmol/L), followed by the PMA treatment. The autoradiographic (A) and graphic data (B) are presented as previously described.
Sequential activation of PK-C and PTK. The cells were treated for 1 hour with 1 nmol/L of the PK-C activator PMA or pretreated for 15 minutes with the specific PTK inhibitor genestein (37 μmol/L) or the inactive genestein analog daidzen (39 μmol/L), followed by the PMA treatment. The autoradiographic (A) and graphic data (B) are presented as previously described.
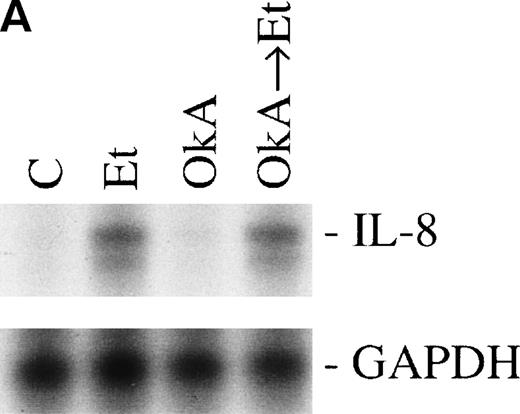
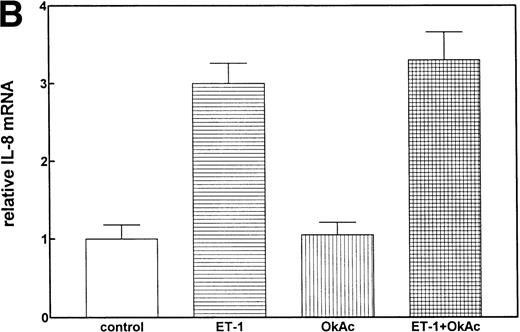
Protein phosphorylation in the signaling process is regulated by both protein kinases and phosphatases. We tested the role of serine/threonine phosphorylation on IL-8 mRNA expression in CNS-EC by treating the cells with okadaic acid, a phosphoserine/phosphothreonine phosphatase inhibitor. CNS-EC were treated with okadaic acid (10 nmol/L) alone or 30 minutes before Et-1 treatment; the cells were then incubated for 1 hour and analyzed for IL-8 mRNA expression. Figure 8 shows that okadaic acid at 10 nmol/L did not modify the IL-8–inducing effect of Et-1.
The role of protein phosphatases. The CNS-EC were pretreated for 30 minutes with 10 nmol/L of the phosphatase inhibitor okadaic acid, followed by 1 hour of incubation with 100 nmol/L Et-1. The autoradiographic (A) and graphic data (B) are presented as previously described.
The role of protein phosphatases. The CNS-EC were pretreated for 30 minutes with 10 nmol/L of the phosphatase inhibitor okadaic acid, followed by 1 hour of incubation with 100 nmol/L Et-1. The autoradiographic (A) and graphic data (B) are presented as previously described.
NF-kB is involved in Et-1–induced IL-8 synthesis.
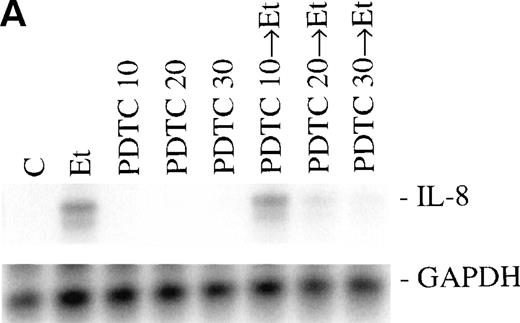
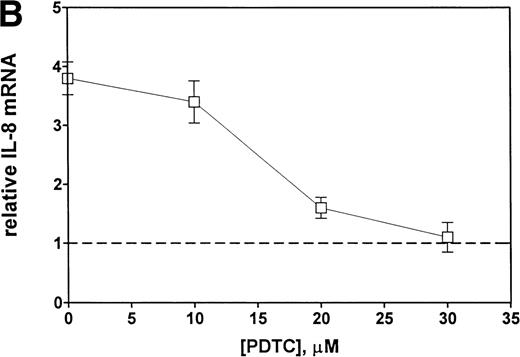
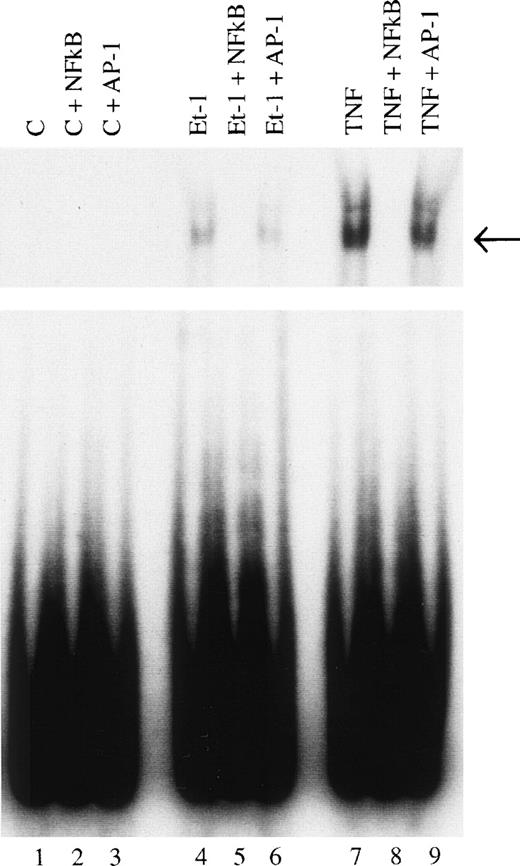
Finally, we examined the involvement of transcription factor NF-κB in the mechanism of Et-1 action. The cells were pretreated for 30 minutes with NF-κB inhibitor PDTC and then with Et-1 as described above. The results in Fig 9 show that PDTC inhibited the Et-1–induced IL-8 mRNA increase in a concentration-dependent manner; complete inhibition was achieved at 30 μmol/L of PDTC. To directly determine whether NF-κB is involved in Et-1 activation, the gel shift assay was performed. Figure 10demonstrates that Et-1activation of CNS-EC induced NF-κB translocation and binding to DNA (lane 4). In the presence of the unlabeled specific competitor, the shift was not observed (lane 5); however, in the presence of the unlabeled nonspecific binding site to transcription factor AP-1, the shift was apparent. TNF activation of CNS-EC served as the positive control. These studies indicate that NF-κB is responsible, at least in part, for the Et-1–induced IL-8 production.
Inhibitors of NF-κB block Et-1 activation. Cells were pretreated for 30 minutes with increasing concentrations of PDTC, followed by 1 hour of incubation with 100 nmol/L Et-1. The autoradiographic (A) and graphic data (B) are presented.
Inhibitors of NF-κB block Et-1 activation. Cells were pretreated for 30 minutes with increasing concentrations of PDTC, followed by 1 hour of incubation with 100 nmol/L Et-1. The autoradiographic (A) and graphic data (B) are presented.
Identification of NF-κB as a transcription factor in Et-1 activation. Nuclear extracts were prepared from CNS-EC incubated in the absence (lanes 1, 2, and 3) or the presence of Et-1 (10−8 mol/L; lanes 4, 5, and 6) or TNF (10 pg/mL; lanes 7, 8, and 9) for 1 hour. A radiolabeled probe was incubated with nuclear extract (10 μg of protein) for 30 minutes and protein-DNA complexed was resolved by electrophoresis. Specific protein-DNA complexes are indicated by arrows. Nuclear extract from lanes 1, 4, and 7 were analyzed for binding activity. Lanes 2, 5, and 8 contained a 100-fold molar excess of unlabeled double-stranded oligonucleotide probe as a competitor. Lanes 3, 6, and 9 contained a 100-fold molar excess of unlabeled nonspecific probe as competitor. The data presented are from 1 of 3 representative experiments.
Identification of NF-κB as a transcription factor in Et-1 activation. Nuclear extracts were prepared from CNS-EC incubated in the absence (lanes 1, 2, and 3) or the presence of Et-1 (10−8 mol/L; lanes 4, 5, and 6) or TNF (10 pg/mL; lanes 7, 8, and 9) for 1 hour. A radiolabeled probe was incubated with nuclear extract (10 μg of protein) for 30 minutes and protein-DNA complexed was resolved by electrophoresis. Specific protein-DNA complexes are indicated by arrows. Nuclear extract from lanes 1, 4, and 7 were analyzed for binding activity. Lanes 2, 5, and 8 contained a 100-fold molar excess of unlabeled double-stranded oligonucleotide probe as a competitor. Lanes 3, 6, and 9 contained a 100-fold molar excess of unlabeled nonspecific probe as competitor. The data presented are from 1 of 3 representative experiments.
DISCUSSION
This work extended our findings that Et-1 induced an upregulation of IL-8 mRNA expression and protein production in human CNS-EC9 by focusing on the elucidation of the intracellular signal transduction pathway(s) involved in this process. We first identified the specific receptor class responsible for the Et-1–induced IL-8 production in CNS-EC. Two distinct ET receptor subtypes, ETA and ETB, have been cloned and sequenced.32 EC in a variety of tissues, ie, liver, kidney, and brain, possess predominantly ETB receptors, which mediate vasodilation by the generation of endothelium-derived relaxing factors and prostacyclins.26,32,33 ETAreceptors are predominantly found in peripheral tissues, especially in vascular smooth muscle cells mediating vasoconstriction. Both types of receptors were found in rat and human brain EC,34-36 where they mediate distinct functions. In agreement with the previous reports, we have found the expression of both receptor types by human CNS-EC. Furthermore, our present results showed that ETAantagonist BQ610, but not ETB antagonist BQ788, inhibits the observed effect of Et-1 effect, demonstrating that here the ETA receptor is responsible for the initiation of the signal transduction pathway to IL-8 production.
We next examined the role of specific signal transduction pathways involved in Et-1–induced IL-8 production. It had been previously reported that increased intracellular cAMP levels caused increased IL-8 protein production in human monocytes,28 whereas in the present work inhibition of PK-A by H-89 did not affect Et-1–induced IL-8 increase. Our results agree with those of others30 who showed that, in human colon epithelial cells, H-89 did not affect the IL-1–induced or TNF-induced IL-8 production; and this chemokine was not stimulated by forskolin, an agent that upregulates cAMP. In addition, White and Lee37 reported that inhibition of PK-A did not affect IL-1–induced IL-8 production by HUVEC. It is interesting to note that we have previously found that Et-1 induces an increase in intracellular cAMP levels and PK-A activity in human CNS-EC.27a However, the present study demonstrates that, in CNS-EC, PK-A activation is not relevant for the Et-1 induction of IL-8 production.
Our results demonstrated rapid activation of PK-C by Et-1. However, activation of PK-C may increase or attenuate IL-8 production, depending on both the cell type and stimulus involved. Thus, PMA induced IL-8 production in HUVEC,37,38 human keratinocytes,29 human colon epithelial cells,30 and human CNS-EC (this study). In HUVEC and human colon epithelial cells, the PK-C inhibitors staurosporine or calphostin inhibited PMA-induced37 or thrombin-induced38IL-8 expression, but these inhibitors did not alter IL-1–induced or TNF-induced IL-8 production,30,37,38 showing that, even in identical cell populations, the same functional response can be achieved by different stimuli via distinct pathways. PK-C inhibitors also block IL-8 mRNA expression in HL-6039 and in fibroblasts.31 In the present study, we showed that human CNS-EC require PK-C activation for Et-1–induced IL-8 mRNA expression, and this activation takes place within the first 30 minutes of stimulation. The addition of the PK-C inhibitor GF 30 minutes after Et-1 stimulation clearly demonstrated that the short burst of PK-C activity induced by Et-1 was necessary and sufficient for the upregulation of IL-8 mRNA expression.
Similarly to PK-C, the role of PTK in inducing the IL-8 production is cell type-dependent. Inhibition of PTK by various agents did not affect IL-1–induced IL-8 production in HUVEC,37 whereas PTK inhibitors did inhibit IL-8 gene induction in a variety of other model systems: by platelet activation factor in fibroblasts,31 by IL-1 or TNF in human colon epithelial cells,30 and by IL-1 in human bone marrow stromal cells.40 The data here show that PTK is involved in the upregulation of Et-1–induced IL-8 mRNA expression in human CNS-EC. Furthermore, we demonstrated that, in these cells, PTK is directly activated by PK-C and PMA-induced IL-8 increase is blocked by PTK inhibitor genistein, which places PK-C activation upstream to PTK in the activation process.
The inhibition of phosphoserine/phosphothreonine phosphatase in IL-8 mRNA expression is also cell type-dependent. Sonoda et al41found that inhibition of phosphatases by okadaic acid or vanadate dramatically increased IL-8 production by HL-60, but not by primary monocytes. In the experiments presented here, okadaic acid alone did not induce IL-8 mRNA increase in CNS-EC; furthermore, the presence of okadaic acid did not affect the Et-1–induced mRNA increase, demonstrating that, in the present system at the concentration of okadaic acid used here (10 nmol/L), at least phosphoserine/phosphothreonine phosphatase 2A is not involved in the observed effects.
We next examined the role of the transcription factor, NF-κB, in the Et-1–induced IL-8 response. The IL-8 gene has several potential binding sites for c-jun, NF-κB, AP2, glucocorticoid receptor, and NF-IL-6.42 It had been suggested that, depending on the cell line, either the combination of NF-κB and AP-1 or NF-κB and NF-IL6 is required.43 It has indeed been shown that, in gastric cell lines, NF-κB and AP-1 are sufficient for the IL-8 gene activation,44 whereas in the fibrosarcoma line the important factors are C/EBP and NF-κB,42 and in epithelial Caco2 cells NF-κB, AP-1, and C/EBP.45 In the present work, we demonstrated that NF-κB activation is also involved in the induction of IL-8 production by Et-1 in CNS-EC; however, other transcriptional factors are also likely to be involved.
In conclusion, this study described, in part, the complex network of intracellular signal transduction pathways used by Et-1 to effect IL-8 production. Both the elicited cellular responses and signal transduction mechanisms used in performing a particular response are cell type-dependent, necessitating the detailed investigation of the pathway(s) involved for each specific response (eg, IL-8 production) and each specific cell type (eg, human CNS-EC) and stimulus. In the present work, we demonstrated that the Et-1– induced IL-8 mRNA increase in human CNS-EC is initiated by binding of Et-1 to the ETA receptor, followed by the subsequent activation of PK-C, PTK, and NF-κB. There are likely to be other enzymes and factors involved in the signal transduction pathway leading to IL-8 production. However, it is only by the systematic characterization of the components of this pathway that new therapeutic targets for the regulation of this chemokine can be identified.
ACKNOWLEDGMENT
The authors thank Dr Mark Fisher for helpful comments and Dr Yueha Zhou for her technical expertise.
Supported by National Institutes of Health Grant No. PO1-NS31946.
The publication costs of this article were defrayed in part by page charge payment. This article must therefore be hereby marked “advertisement” in accordance with 18 U.S.C. section 1734 solely to indicate this fact.
REFERENCES
Author notes
Address reprint requests to F.M. Hofman, PhD, Department of Pathology, University of Southern California, School of Medicine, 2011 Zonal Ave, HMR 312, Los Angeles, CA 90033; e-mail: hofman@hsc.usc.edu.


This feature is available to Subscribers Only
Sign In or Create an Account Close Modal