

Abstract
Patients with Omenn’s syndrome have a form of severe immune deficiency that is associated with pathological features of graft-versus-host disease, except for the lack of foreign engraftment. It has been hypothesized that the disease’s unique clinical features are mediated by an expanded population of autologous self-reactive T cells of limited clonality. In the current study, an investigation of the T-cell receptor (TCR) repertoire was undertaken to identify defects in T-cell rearrangement and development. The TCR repertoire in this group of patients was exquisitely restricted in the number of different TCR clonotypes, and some of these clonotypes seemed to have similar recognition motifs in the antigen-binding region, indicating antigen-driven proliferation of T lymphocytes. The TCRs from some patients lacked N- or P-nucleotide insertions and used proximal variable and joining gene segments, suggesting abnormal intrathymic T-cell development. Finally, abnormal assembly of gene segments and truncated rearrangements within nonproductive alleles suggested abnormalities in TCR rearrangement mechanisms. Overall, the findings suggest that inefficient and/or abnormal generation of TCRs may be a consistent feature of this disease.
OMENN’S SYNDROME was initially described in 1968 by Gilbert Omenn as an immunodeficiency disease with autoimmune features resembling graft-versus-host disease (GvHD).1 The origin of this disease seems to result from a variety of genetic and, perhaps, primary immunologic mechanisms that converge to result in a homogenous pathological picture of autologous GvHD in the context of an oligoclonal expansion of activated T cells. The original reports described the members of a single extended family, in which the inheritance pattern and consanguinity suggested an autosomal recessive inheritance of the disease.1-3 Since that time, cases with similar manifestations but different patterns of inheritance have been described.4-7 For example, a sibling of a patient with severe combined immune deficiency (SCID) developed Omenn’s syndrome, prompting the hypothesis that some patients with Omenn’s syndrome may represent a “leaky” form of SCID.5,8 Arguments that Omenn’s syndrome represents true GvHD in patients with SCID have been discounted by the lack of evidence for engrafted lymphocytes.9,10 Partial recombinase activating gene (RAG) defects have been recently described in many of these patients.11 Here we report, for the first time, an infant with the DiGeorge anomaly and chromosome 22q11 deletion who developed Omenn’s syndrome. Thus, both intrinsic defects in VDJ (variable, diversity, joining) recombination as well as defects in thymic development may lead to SCID with GvHD-like autoimmunity (Omenn’s syndrome).
The primary goal in our investigation was to seek evidence for common abnormalities in T-cell development, T-cell receptor (TCR) repertoire, and assembly of TCRs within these patients by examining the productive and nonproductive TCR transcripts in the circulating T-cell populations. The results showed that the TCR repertoires were not only exquisitely restricted in the number of different TCR clonotypes, but some of these clonotypes seemed to have similar recognition motifs in the antigen-binding region, indicating antigen-driven proliferation of T lymphocytes. Decreased N- and P-nucleotide insertions and usage of proximal gene segments found in some patients may be consistent with abnormal T-cell development. Abnormal assembly of gene elements and truncated rearrangements were found within nonproductive alleles indicative of abnormalities in TCR rearrangement mechanisms.
MATERIALS AND METHODS
Case Reports
A summary of clinical features and peripheral blood T-cell phenotypes is shown in Tables 1 and 2. Cases 3 through 7 have been previously described.7,12 13
Clinical Characteristics
| Cases | |||||||
|---|---|---|---|---|---|---|---|
| 1 | 2 | 3 | 4 | 5 | 6 | 7 | |
| Age of onset (erythroderma) | 2 mo | 2 mo | 2 wk | 4 mo | 4 mo | 2 mo | 2 wk |
| Facial anomalies | + | − | − | +++ | − | − | − |
| Thymic abnormalities | +++ | na* | ++ | +++ | na | na | ++ |
| Erythroderma/exfoliative dermatitis | ++ | ++ | + | +++ | + | + | + |
| Hepatomegaly | ++ | ++ | ++ | ++ | +++ | ++ | + |
| Lymphadenopathy | ++ | ++ | ++ | +++ | +++ | ++ | + |
| Diarrhea | ++ | ++ | ++ | ++ | ++ | +++ | ++ |
| Failure to thrive | + | ++ | + | +++ | ++ | +++ | + |
| Pulmonary edema | ++ | − | − | ++ | − | − | − |
| Lymphocytosis | + | nl | nl | +++ | nl | ++ | + |
| Eosinophilia | + | + | ++ | ++ | nl | + | + |
| IgG | nl | dec | dec | dec | dec | dec | nl |
| IgE | na | inc | inc | na | inc | inc | inc |
Abbreviations: na, not assessed; nl, normal; dec, decreased; inc, increased.
Peripheral Blood T-Cell Subsets (%)
| CD3 | CD4 | CD8 | CD4−/8− * | TCRαβ+ | TCRγδ | |
|---|---|---|---|---|---|---|
| Case 1 | 57 | 16 | 7 | 34 | na | na |
| Case 2 | 59 | 40 | 19 | 0 | 59 | 1.1 |
| Case 3 | 80 | 13 | 12 | 55 | 69 | na |
| Case 4 | 95 | 5 | 24 | 61 | 90 | 3 |
| Case 5 | 50 | 43 | 17 | 0 | 42 | na |
| Case 6 | 50 | 39 | 17 | 0 | 51 | na |
| Case 7 | 68 | 40 | 37 | 0 | 5 | na |
Numbers represent the % of peripheral blood lymphocytes as gated on forward and side scatter.
Abbreviation: na, not assessed.
Calculated value.
Case 1.
A female infant was born with facial features consistent with the DiGeorge syndrome. She had hypocalcemia, absence of a thymic shadow on chest roentgenogram, severe lymphopenia, and absent responses to mitogens. She had no cardiac abnormalities. Fluorescent in situ hybridization analysis showed a deletion within the region of chromosome 22q11. At 2 months of age her lymphocyte numbers increased dramatically, and she developed erythroderma, hepatosplenomegaly, lymphadenopathy, chronic diarrhea, and respiratory distress. Maternal engraftment could not be detected by serological techniques in peripheral blood lymphocytes (PBLs) or by polymerase chain reaction (PCR) analysis of class II HLA alleles in B- and T-cell lines derived from the patient.
Case 2.
A female infant developed exfoliative dermatitis, failure to thrive, and chronic diarrhea at 1 month of age. She subsequently developed progressive lymphadenopathy and splenomegaly. Her laboratory evaluation at 6 weeks of age showed mild lymphopenia (absolute lymphocyte count, 1,100 to 1,500/μL), hypogammaglobulinemia (IgG 236 mg/dL, IgM 27 mg/dL, and IgA <7 mg/dL), and elevated IgE (2,617 U/mL). The phenotype of her peripheral blood T cells was normal and HLA typing showed no engraftment with maternal lymphocytes.
Case 3.
A female infant developed chronic diarrhea soon after birth and dermatitis at 1 month of age.7 A skin biopsy was believed to be consistent with GvHD and the patient was treated with prednisone and CsA with subsequent control of the dermatitis. She subsequently developed recurrent infections (otitis media, conjunctivitis, and bacterial and Candida sepsis), hepatomegaly, lymphadenopathy, eosinophilia, and hemolytic anemia. The family history was significant in that a female first cousin with SCID died after haploidentical T-cell–depleted bone marrow transplantation. Her laboratory evaluation showed normal serum IgG, absent IgA and IgE, and low IgM concentrations. Her PBLs ranged from 1,200 to 4,200/μL and did not respond to T- and B-cell mitogens. The patient’s T-cell phenotype was dominated by TCRαβ+ CD4−CD8− T cells at the time specimens for this study were obtained. Restriction fragment length polymorphism analysis did not detect maternal engraftment.
Case 4.
This previously reported white male was characterized by severe craniofacial anomalies distinct from those described in the DiGeorge anomaly and consisted of malformed ears and external auditory canals, a fish-shaped mouth, and cleft palate.12 13 He had a massive expansion of TCRαβ CD4−CD8− T cells in the peripheral blood, skin, and lymph nodes. He developed chronic sino-pulmonary infections, oral thrush, severe exfoliative dermatitis, pulmonary edema, chronic diarrhea, and massive lymphadenopathy and lymphocytosis. When the patient was placed on CsA, there was a dramatic improvement in the dermatitis, eosinophilia, and lymphocytosis. Karyotyping and lymphocyte typing failed to show engraftment of maternal lymphocytes.
Case 5.
The parents of this male infant were second cousins.7 He was born full term and remained healthy until 4 months of age when he first developed severe oral and perineal candidiasis followed by severe seborrheic dermatitis unresponsive to medical therapy. At 7 months of age he developed Pneumocystis carinii pneumonia (PCP). Laboratory testing showed absent IgG and IgA, depressed IgM, and an elevated IgE, which ranged from 482 to 6,140 IU/mL. Absolute numbers of lymphocytes ranged from 500 to 2,400/μL and eosinophils from 1,160 to 9,100/μL. Isohemagglutinins and titres to diphtheria and tetanus were negative; mitogens were profoundly depressed. Over the next several months the dermatitis progressed to alopecia, and the patient developed massive lymphadenopathy and hepatomegaly. When he was treated with CsA at 15 months of age there was remarkable improvement in skin manifestations, hair regrowth, and a significant reduction in lymph node and liver size.
Case 6.
A male infant experienced failure to thrive since birth and intermittent diarrhea.7 Dermatitis appeared at 2 months of age. Severe PCP and Candida pneumonia were treated during the first 6 months of life. Lymphadenopathy was prominent. IgG, A, and M were decreased, and IgE was elevated. Proliferation to standard mitogens was 5% to 15% of normal. Lymphocyte counts ranged from 1,580 to 6,200/μL. No maternal engraftment was detected. An older brother, who died of opportunistic infections, also had a clinical history consistent with Omenn’s syndrome.
Case 7.
This male infant developed jaundice at 1 week of age followed by chronic diarrhea.7 By 1 month of age he exhibited severe dermatitis and had failure to thrive. At 9 months of age chronic PCP was diagnosed. Absolute lymphocyte counts ranged from 1,500 to 5,000/μL, and eosinophilia was noted. IgG, A, and M were in the normal range, but IgE levels ranged as high as 10,000 IU/mL. Proliferation to mitogens was minimal, and isohemagglutinins and specific antibody titres were negative. The patient subsequently experienced multiple episodes of bacterial (gram negative and positive) sepsis.
Inverse PCR
To estimate the frequency of T-cell clones in the peripheral blood and determine the TCR sequences, inverse PCR was used as described.14 Briefly, total RNA was extracted from PBL using oligo dT-Sepharose chromatography (Pharmacia, Gaithersburg, MD) and cDNA synthesized using reverse transcriptase (GIBCO-BRL, Gaithersburg, MD) and oligo dT priming. Double-stranded cDNA was generated using RNase H, Escherichia coli. DNA polymerase I and DNA ligase were followed by T4 DNA polymerase for blunt ending. The cDNAs were then circularized with T4 DNA ligase and used as a template in the PCR using primers for either the α- or β-chain constant (C) region genes. In most cases, nested primers were used to reamplify products to increase quantity and specificity. The PCR primers used were as follows: Cα inverse, 5′ CCCTGCTATGCTGTGTGTCT 3′; Cα inverse nested primer, 5′ TCCTGCTGCCGATGCCTTCATT 3′; Cα forward, 5′ AGACCTCATGTCTAGCACAGT 3′; Cα forward nested primer, 5′ GCAGACAGACTTGTCACTGGATT 3′; Cβ inverse, 5′ TGCCACCATCCTCTATGAGATC 3′; Cβ inverse nested primer, 5′ GCCATGGTCAAGAGAAAGGAT 3′; Cβ forward, 5′ GCCTTTTCCCTGTGGGAGAT 3′; Cβ forward nested primer, 5′ AACACAGCGACCTCGGGTG 3′.
DNA Sequencing and Analysis
The amplified DNA was then inserted into a bacterial plasmid vector (PCr II; Invitrogen, San Diego, CA), cloned into E coli, and plated onto selective medium. Individual colonies were selected and sequenced using the dideoxy chain-termination method (Amersham, Arlington, Heights, IL). Sequences obtained were compared with a TCR database derived from the GenBank database (National Library of Medicine, Bethesda, MD). Sequence similarities and junctions were identified using a computer search program developed in this laboratory (TCR IDENTIFY program; Steven Jowers, Michael Kulvicki and Edward Brooks, unpublished observation, 1996), which uses algorithms available from Genetics Computer Group (Madison, WI) software package. Nomenclature for the TCR genomic sequences were according to Rowen et al,15 Slightom et al,16Koop et al,17 and Arden et al.18 Analyses of complementarity determining region-3 (CDR3) lengths were calculated as the number of amino acids between the terminal V-region cysteine and the J-region motif, GXG, minus four. Statistical analyses were performed on Quatro Pro software, version 6.0, (Corel Corp, Ottawa, Ontario, Canada).
T-Cell Clones
T-cells were obtained from peripheral blood and cultured in the presence of interleukin-2 (IL-2) and phytohemaglutinin (PHA) as described.19 20 Cultures were stimulated every 2 to 3 weeks with irradiated B-lymphoblastoid cells and PHA in IL-2 containing culture medium. After several months in culture, flow cytometry was performed using fluorescein and phycoerythrin-labeled monoclonal antibodies (Becton Dickinson, San Jose, CA) directed against the TCRαβ (WT31) CD4 (Leu3) and CD8 (Leu2a). Without subcloning, the dominant cells within the cultures were >98% TCRαβ CD4− CD8−. To isolate mRNA as described above, 2 to 5 × 10⁶ cells were used. Only one productive TCR was identified from the T-cell lines obtained from patients 1 and 4. In patient 4, two subclones were isolated that bore identical TCRs. The fact that only one T cell dominated each of the T-cell cultures was consistent with the oligoclonality in these patients.
RESULTS AND DISCUSSION
TCRα and β sequences were obtained from peripheral blood samples from each of the patients described. The results of those analyses are shown in Tables3through 8. Because of the ability of this technique to amplify any mRNA transcript containing the target C region sequences, both productively and nonproductively rearranged TCR alleles were identified and analyzed. All germline VDJ genes were identical to previously described genes, although previously unrecognized polymorphisms could not be excluded. Abnormal recombinations within homologous regions of different V and J genes, previously reported in certain PCR techniques, were not observed.21 22
Productive Sequences: TCRβ
| Clone No. | No. of Unique mRNA Transcripts Identified | Vβ | NDN | Jβ | CDR3 Length3-151 | ||||
|---|---|---|---|---|---|---|---|---|---|
| Case 1 | |||||||||
| 1 | 3 | 3.13-150 | . . . | CASSL | TGG | TEAFFG | . . . | 1.1 | 8 |
| 2 | 2 | 14.1 | . . . | C | MGL | QFFG | . . . | 2.1 | 2 |
| 3 | 1 | 14.13-150 | . . . | CASSL | QG | TEAFFG | . . . | 1.1 | 7 |
| 4 | 1 | 5.13-150 | . . . | CASSL | AGSQRRA | SYEQYFG | . . . | 2.73-150 | 13 |
| 5 | 1 | 5.13-150 | . . . | CASSL | AR | NTEAFFG | . . . | 1.13-150 | 8 |
| 6 | 1 | 5.13-150 | . . . | CASSL | HRGGK | NQPQHFG | . . . | 1.5 | 11 |
| 7 | 1 | ? | . . . | CASS | QGLGKG | EAFFG | . . . | 1.1 | 9 |
| c | — | 17.1 | . . . | CASS | PGQGFG | YNEGFFG | . . . | 2.1 | 9 |
| Case 2 | |||||||||
| 1 | 4 | 12.23-150 | . . . | CAISES | KDRGS | ETQYFG | . . . | 2.5 | 11 |
| 2 | 1 | 8.1 | . . . | CAS | TMDRV | NQPQHFG | . . . | 1.5 | 9 |
| 3 | 1 | 13.3 | . . . | CAS | IMDVF | TEAFFG | . . . | 1.1 | 8 |
| 4 | 1 | 8.13-150 | . . . | CASSL | TAQL | QYFG | . . . | 2.4 | 7 |
| 5 | 1 | 6.5 | . . . | CASS | YGQR | EQYFG | . . . | 2.7 | 7 |
| 6 | 1 | 13.6 | . . . | CASS | LDKAG | TEAFFG | . . . | 1.1 | 9 |
| 7 | 1 | 13.63-150 | . . . | CASSY | VGL | NTEAFFG | . . . | 1.13-150 | 9 |
| 8 | 1 | 2.1 | . . | CSA | PRVG | GELFFG | . . . | 2.2 | 7 |
| 9 | 1 | 21.43-150 | . . . | CASSL | RIT | NTGEIFFG | . . . | 2.23-150 | 10 |
| 10 | 1 | 22.1 | . . . | CAS | TRLTTT | NEQFFG | . . . | 2.1 | 9 |
| Case 3 | |||||||||
| 1 | 14 | 15.13-150 | . . . | CATSDL | GG | NQPQHFG | . . . | 1.5 | 9 |
| 2 | 7 | 11.1 | . . . | CASS | ITGD | TEAFFG | . . . | 1.1 | 8 |
| 3 | 3 | 3.13-150 | . . . | CASSL | GG | YGYTFG | . . . | 1.2 | 7 |
| Case 4 | |||||||||
| 1 | 5 | 3.1 | . . . | CASS | WDN | YEQYFG | . . . | 2.7 | 7 |
| 2 | 1 | 3.13-150 | . . . | CASSL | --- | STDTQYFG | . . . | 2.33-150 | 7 |
| 3 | 1 | 6.7 | . . . | CASS | LRTSRRV | EQYFG | . . . | 2.7 | 11 |
| 4 | 2 | 5.1 | . . . | CASS | PSGGL | NQPQHFG | . . . | 1.5 | 10 |
| c | — | 3.1 | . . . | CASS | RG | TEAFFG | . . . | 1.1 | 7 |
| Case 5 | |||||||||
| 1 | 1 | 6.5 | . . . | CASS | PGTA | NTEAFFG | . . . | 1.13-150 | 9 |
| Case 6 | |||||||||
| 1 | 1 | 6.43-150 | . . . | CASSL | GLGPH | EQYFG | . . . | 2.7 | 9 |
| Case 7 | |||||||||
| — | none | ||||||||
Abbreviations: ---, absence of any D- or N-region–encoded sequences; _, germline D-region–encoded amino acids; c, the TCR was derived from a T-cell clone.
Indicates usage of full-length germline-encoded sequences.
Range, 7 to 13; mean, 8.62; median, 9; variance, 2.5; skew, 0.83; kurtosis, 0.55.
Productive Sequences: TCR
| Clone No. | No. of Unique mRNA Transcripts Identified | Vα | N | Jα | CDR3 Length4-151 | ||||
|---|---|---|---|---|---|---|---|---|---|
| Case 1 | |||||||||
| 1 | 1 | 14.1 | . . . | CS | FMN | TGANSKLTFG | . . . | 564-150 | 9 |
| 2 | 1 | 23.1 | . . . | CA | VL | GGSNYKLTFG | . . . | 54 | 7 |
| Case 2 | |||||||||
| 1 | 4 | 22.1 | . . . | C | GTEIQ | AAGNKLTFG | . . . | 17 | 9 |
| 2 | 3 | 4.2 | . . . | CI | ARD | TGNQFYFG | . . . | 49 | 7 |
| 3 | 2 | 6.1 | . . . | CA | MRELGLD | DYKLSFG | . . . | 20 | 10 |
| 4 | 1 | 11.1 | . . . | CA | VP | GSGNTGKLIFG | . . . | 37 | 9 |
| 5 | 1 | 2.8 | . . . | CV | IPY | TGGFKTIFG | . . . | 9 | 8 |
| Case 3 | |||||||||
| 1 | 1 | 12.1 | . . . | CA | LKE | GYQKVTFG | . . . | 13 | 7 |
| 2 | 8 | 20.1 | . . . | CA | VRG | RDDKIIFG | . . . | 30 | 7 |
| 3 | 6 | 14.1 | . . . | CA | FMRP | GGGADGLTFG | . . . | 45 | 10 |
| 4 | 3 | 28.1 | . . . | CA | V | DRGSTLGRLYFG | . . . | 18 | 9 |
| 5 | 2 | 17.2 | . . . | CA | AS | NSGGSNYKLTFG | . . . | 544-150 | 10 |
| 6 | 1 | 2.5 | . . . | C | VV | NTGNQFYFG | . . . | 494-150 | 6 |
| Case 4 | |||||||||
| 1 | 2 | 23.1 | . . . | CA | VS | GNQFYFG | . . . | 49 | 5 |
| 2 | 1 | 3.1 | . . . | CA | TIEVLG | YQLTFG | . . . | 28 | 8 |
| 3 | 3 | 6.1 | . . . | CA | MRQA | SGGYQKVTFG | . . . | 13 | 10 |
| 4 | 1 | 18.2 | . . . | CA | LPLP | SGGYNKLIFG | . . . | 4 | 10 |
| 5 | 2 | 3.1 | . . . | CA | TAV | FSGGYNKLIFG | . . . | 44-150 | 10 |
| 6 | 2 | 5.1 | . . . | CA | LD | TGGFKTIFG | . . . | 9 | 7 |
| Case 5 | |||||||||
| 1 | 7 | 3.1 | . . . | CA | TC | SNDYKLSFG | . . . | 204-150 | 7 |
| 2 | 1 | 4.3 | . . . | CI | VRVPS | DYKLSFG | . . . | 20 | 8 |
| 3 | 1 | 13.1 | . . . | CA | DRM | NSGGSNYKLTFG | . . . | 544-150 | 11 |
| 4 | 1 | 21.1 | . . . | CA | AIL | SGTYKYIFG | . . . | 40 | 8 |
| 5 | 2 | 17.2 | . . . | CA | ASA | GGGADGLTFG | . . . | 45 | 9 |
| 6 | 1 | 19.1 | . . . | CA | YYWD | GGSQGNLIFG | . . . | 42 | 10 |
| 7 | 1 | 7.4 | . . . | CA | VPLGT | TGKLIFG | . . . | 37 | 12 |
| Case 6 | |||||||||
| 1 | 5 | 18.1 | . . . | CA | LRG | GSNYKLTFG | . . . | 54 | 8 |
| 2 | 6 | 14.1 | . . . | CA | YRSA | TGANSKLTFG | . . . | 56 | 10 |
| 3 | 1 | 14.1 | . . . | CA | YRSV | YNTDKLIFG | . . . | 34 | 9 |
| 4 | 1 | 2.8 | . . . | CV | V | NTGGFKTIFG | . . . | 9 | 7 |
| 5 | 1 | 12.1 | . . . | CA | VL | GGSNYKLTFG | . . . | 54 | 8 |
| Case 7 | |||||||||
| 1 | 3 | 23.1 | . . . | CA | PD | NNDMRFG | . . . | 43 | 5 |
| 2 | 1 | 14.1 | . . . | CA | F | NTGNQFYFG | . . . | 494-150 | 6 |
| 3 | 1 | 14.1 | . . . | CA | YKNRR | NYGGSQGNLIFG | . . . | 424-150 | 13 |
| 4 | 1 | 4.3 | . . . | CI | LRDG | YSGAGSYQLTFG | . . . | 28 | 12 |
| 5 | 1 | 20.1 | . . . | CA | VEG | TTGTASKLTFG | . . . | 44 | 10 |
Indicates usage of full-length germline-encoded sequences.
Range, 5 to 13; mean, 8.4; median, 9; variance, 2.7; skew, 0.13; kurtosis, −.21.
Shared CDR3 Motifs
| Motif | Case | Clone | CDR35-150 |
|---|---|---|---|
| β1 | 2 | 1 | SESKDRGSETQ |
| 2 | 6 | SLDKAGTE A | |
| α1 | 1 | 2 | VLGGSNYKL |
| 6 | 5 | VLGGSNYKL | |
| α2 | 3 | 6 | VNTGNQF |
| 7 | 2 | FNTGNQF | |
| α3 | 6 | 2 | YRSATGANSKL |
| 6 | 3 | YRSVYNTDKL |
| Motif | Case | Clone | CDR35-150 |
|---|---|---|---|
| β1 | 2 | 1 | SESKDRGSETQ |
| 2 | 6 | SLDKAGTE A | |
| α1 | 1 | 2 | VLGGSNYKL |
| 6 | 5 | VLGGSNYKL | |
| α2 | 3 | 6 | VNTGNQF |
| 7 | 2 | FNTGNQF | |
| α3 | 6 | 2 | YRSATGANSKL |
| 6 | 3 | YRSVYNTDKL |
Amino acids shown in bold are identical; conservative differences are underlined. Gaps are introduced to maximize line-up of like amino acids. CDR3s were defined as those amino acids beginning at the third (second for α) amino acid 3′ of the terminal 3′ V-region cysteine and ending three nucleotides 5′ of the J-region motif GXG.
Nonproductive Sequences
| TCRβ | TCRα | |
|---|---|---|
| Case 1 | //BJ2S4/BC2 | AV14S1#AJ55/AC |
| BC1 | AV12S5#AJ54/AC | |
| BD1 5′intron/BC1 | AV2S5#AJ55/AC | |
| //BJ2S5…BJ2S6/BC1 | //AJ49/AC | |
| BC1 exon 4/BC1 exon 1/BC1 | AJ54-AJ53 intron/AC | |
| Case 2 | BV2.1#BJ2.5/BC2 | AV17S2#AJ3/AC |
| …BD1/BJ2S4/BC2 | AV12S1#AJ49/AC | |
| …BD1/BJ1S1/BC1 | AV18S2#AJ32/AC | |
| …BD1/BJ1S5/BC1 | //AJ6/AC | |
| …BD1/BJ1S6/BC1 | //AJ30/AC | |
| …BJ1S5/BC1 | ||
| …BJ2S3/BC2 | ||
| //BJ2S5/BC2 | ||
| //BJ2S2/BC2 | ||
| Case 3 | //BJ2S3/BC2 | AV2S8#AJ49*/AC |
| //AJ45/AC | ||
| //AJ13/AC | ||
| //AJ11/5′ AC intron/AC | ||
| Case 4 | //BD1/BJ1S1/BC1 | AV?#AJ3/AC |
| //BJ2S3/BC2 | AV18S2#AJ18/AC | |
| //BJ2S4/BC2 | AV13S1#AJ29/AC | |
| //BJ2S5/BC2 | AV13.1#AJ55/AC | |
| BC1 intron(exon1-2)/3′ intron/BC1 | AV27.1#AJ3/AC | |
| //BD2/BJ2S5…BJ2S6…BJ2S7/BC2 | AV23.1#AJ29/AC | |
| Case 5 | NONE | AV28.1#AJ49*/AC |
| AV12.1#AJ8/AC | ||
| AV16.1#AJ7/AC | ||
| AV6.1#AJ9/AC | ||
| AV7.4#AJ32/AC | ||
| AV17.1#AJ7/AC | ||
| //AJ30/AC | ||
| //AJ9/AC | ||
| //AC | ||
| Case 6 | …BJ1.5/BC1 | //AJ48/signal seq. .AJ47/AC |
| …BJ1.6/BC1 | …AJ42/AC | |
| //AC | ||
| Case 7 | …BJ2.3/BC2 | AV27.1#AJ58/AC |
| //BJ1.5/BC1 | AV17.2#AJ47/AC | |
| AV14.1#AJ50/AC | ||
| //AJ49/AC | ||
| //AJ43/AC | ||
| …AJ45/AC |
# Indicates an out-of-frame rearrangement, / indicates a productively recombined or spiced site, // indicates a truncated or “broken” gene segment, … indicates continuation of 5′ germline sequence.
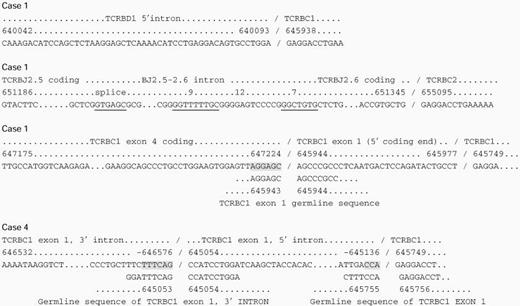
Abnormal TCR Sequences
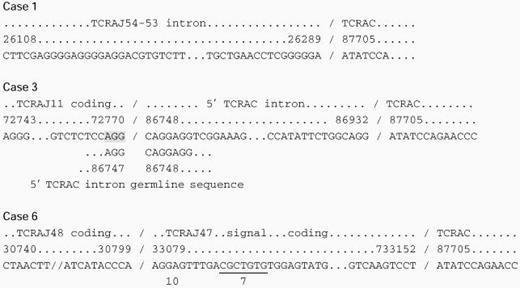 |
|
The top two lines line of each group indicate the homologous genomic segment and sequence number, respectively, Koop et al,14 Rowen et al,15 and Slightom et al,16 and the third line indicates the actual sequence derived from the patients. Where present, the fourth, fifth, and sixth lines indicate putative splice sites within the 3′ gene segments. Shaded regions indicate homologous regions that may direct aberrant splicing.
Analysis of Productive TCR Transcripts
All patients displayed an oligoclonal repertoire of productively rearranged TCRs. Both the α- and β-chain repertoires were limited to a few unique clones. This was indicated by the inability to clone large numbers of unique TCRs within the same patient, and the high frequency with which different cDNAs representing the same clonotype were sequenced. To ensure that repeated sequences were indeed derived from unique mRNA transcripts and not from the amplified products of the same mRNA transcript, the most 5′ end of the cloned VDJC template was sequenced. Because second-strand synthesis by DNA polymerase was primed on RNase-generated fragments of RNA, each amplified cDNA bore a novel 5′ start site caused by random nicking by RNase and subsequent digestion (blunt-ending) of the 5′ end by T4 DNA polymerase. Thus, it could be determined whether each sequence represented a unique mRNA species or simply the amplified products of the same mRNA. In some cases few or no unique mRNA transcripts were amplified (TCRα: case 1 [2 transcripts]; TCRβ: case 5 [1 transcript], case 6 [1 transcript], and case 7 [none]; and TCRα: case 1 [2 transcripts]) (Tables 3 and 4). However, in all patients, an adequate analysis of the complexity of the repertoire was obtained from the amplified sequences of either the α- or β-chains. Reproducibility of the technique was shown in one patient (case 4), in which two different aliquots of the same blood sample were analyzed in separate experiments that yielded nearly identical frequencies of the same TCR transcripts.
In all cases, it can be concluded that there was an expansion of one or several T-cell clones (Tables 3 and 4). This finding is consistent with previous analyses of the TCR repertoire in Omenn’s syndrome by Southern blotting.6 13 Also of note was the preferential usage of certain V genes among the few TCRs expressed in given individuals. For example, in case 1, TCRBV5S1 was used in 3 clones and TCRBV14S1 in 2 of 6 clones. The only other receptor identified in case 1 used TCRBV3S1, which bears extensive sequence homology with TCRBV14. In case 2, TCRBV13 was used in 3 of 10 clones, and in case 4, TCRBV3S1 was used in 2 of 4 clones. The TCR Vα gene usage was less preferential, but some skewing was evident. TCRAV3S1 was used in 2 of 6 clones in case 4, and TCRAV14S1 was used in 2 of 5 clones in case 8 and in 2 of 5 clones in case 6.
It was important to examine the structure of the CDR3 of these TCRs, because this region possesses the highest degree of diversity, and, according to most models, encodes the TCR segment involved in antigen recognition.23-26 The length of the CDR3 may also provide information about the nature of the ligands or the rearrangement process.27,28 This analysis was undertaken for both the α and β CDR3s in this group of Omenn’s patients (Tables 3 and 4), and compared with previous analyses of large pools of TCRs from antigen-specific T cells or a randomly selected pool from normal humans.29,30 In the TCRα chains, the CDR3 lengths were slightly shorter than previous studies (mean, 8.4 v 9.2 [or 10.5]), had a slightly larger range (5 to 13 v 6 to 12), and had similar variance (2.7 v 2.8; skewing, 0.13 v 0.1; and kurtosis, 0.21 v −0.9). Within the TCRβ chains, one CDR3 (case 1, clone 2), which was only two amino acids in length, was excluded from the statistical analysis. The range of lengths was similar to previous reports (7 to 13 v 6 to 12), but the mean lengths were shorter (8.6 v 9.5), with slightly less variance (2.5 v 4), and similar kurtosis (0.55 v0.2).29,30 Based on the findings of a previous study, which found that the length of the CDR3s from thymic T cells, both selected and unselected, differed little from the mature, antigen-specific pool of TCRs, the shorter CDR3 lengths that we detected in the Omenn’s group were probably not the result of selection events.29 Rather, as discussed in more detail below, it is likely that the shorter CDR3 lengths resulted from fewer N or P nucleotide insertions or increased deletion of germline encoded segments within recombinatorial joints.
A few common amino acid motifs within the CDR3s were identified both within individual patients and among different patients (Table 5). For one motif (α1), identical amino acid sequences were observed in two clones. The common sequences encoded by this motif (α1) may have been attributable to identical germline J regions and the lack of N nucleotide insertions.
In three patients, TCRs were identified that predominantly used V and J gene segments that map to genomic regions in close proximity to each other. In cases 1, 3, and 4, TCRBV3S1, 14S1, 11S1, and 15S1, which are the second, third, four, and fifth, respectively, most 3′ V genes in the human TCRB locus on chromosome 7, accounted for the majority (8 of 13) of V genes used (Table 2).15 Some of these same receptors also rearranged to the most 5′ J-region locus (TCRBJ1). Finally, as indicated above, within some of those same TCR clones, no N or P nucleotides were detected so that the junctional regions were encoded solely by germline V-, D-, and J-region nucleotides (case 1, clones 1 and 3; case 3, clones 1 and 3; and case 4, clone 2). This is most pronounced in case 3, where a total of only three nongermline-encoded nucleotides were identified in the three TCRs. Those nucleotides, identified in clone 2, coded for an isoleucine. The apparent nongermline-encoded aspartic acid (D) within that joint was encoded by one germline D-region and two germline J-region nucleotides. Preferential usage of proximal TCRα J genes could be observed in case 1, within both the productive and the nonproductive transcripts (TCRAJ56, 53, and 49), but it could not be determined for the TCRAV locus because that locus has yet to be fully mapped.17However, these TCRs also had decreased numbers of junctional nucleotides in some clones.
Although the enzyme responsible for N nucleotide insertion, terminal deoxynucleotidyl transferase (TdT), seemed to be functional in all patients studied, as indicated by the presence of N nucleotides, it may not have been fully active. Alternatively, the atypical TCRs may have arisen before the full expression of TdT, reminiscent of “immature” TCRs detected in human fetal thymus.28,31Interestingly, the peripheral blood T cells in all three of these patients (cases 1, 3, and 4) with limited N nucleotide insertion were dominated by TCRα/β populations lacking CD4 and CD8. These TCRα/β “double negative” T cells normally comprise a minuscule population in the blood of healthy individuals (0.1% to 2%), but are increased in some autoimmune diseases.13,32-35 In normal humans, TCRα/β double-negative T cells represent populations with oligoclonal TCRs, some of which use similar proximal rearrangements and lack N nucleotides.20,36 Several reports have suggested that these cells may be extrathymically derived.37-42
T-cell clones were generated from two patients and their TCRβ chains were identified (Table 3). The clones derived from the peripheral blood of patient 1 was TCRα/β double negative and used TCRBV17S1 and BJ2s1. TCRBV17S1 is highly homologous to BV14S1 and 3S1 and is also a somewhat proximal gene (seventh nonpseudo gene from the 3′ end of the TCRBV locus). A second TCRα/β double-negative clone was derived from patient 4, which bore TCRBV3s1 rearranged to J1s1, and a short germline-encoded junctional region. These features were in keeping with the abnormalites already described for the other circulating T cells in the patients. The functional activity of this clone has been previously examined and showed proinflammatory and cytotoxic activities that implicated the TCRα/β double-negative T cells in the disease pathogenesis.12,13 19
Analysis of Nonproductive TCR Transcripts
The vast majority of nonproductive transcripts identified seemed to be the result of either normally occurring out-of-frame VDJ/C β-chain and VJ/C α-chain or truncated DJ/C or J/C transcripts (Table 6). However, several observations can be made with regard to the relative proportions of the different types of nonproductive transcripts. First, there seemed to be an abundance of TCRβ J/C as compared with DJ/C nonproductive transcripts. Normally, virtually all truncated β transcripts contain a D to J rearrangement, and thus the TCRβ J/C transcripts may represent unrearranged alleles.43 Also, most (13 of 18) truncated J/C transcripts lacked 5′ signal sequences and the most 5′ germline nucleotides. The altered 5′ ends, appearing as “broken” transcripts (designated as // in Table 6), could be caused by aborted rearrangements, or alternatively, could be attributable to technical loss during second-strand synthesis (see Materials and Methods). The former possibility is supported by the fact that in virtually all cases, only the most proximal 5′ nucleotides of the germline J segment exon were missing, which could represent exonucleolytic loss observed in normal rearrangement processing. Also supporting defective rearrangement mechanisms was an approximately twofold higher number of “broken” nonproductive transcripts within the TCRβ (13 of 32; 0.41 ratio) than in the TCRα (9 of 38; 0.24 ratio) sequences. The increased frequency of broken transcripts in TCRβ may be a result of twice the number of rearrangement events required at the TCRB locus (D to J plus V to D rearrangements in TCRB v only V to J during TCRA rearrangements). The abundance of TCRβ J/C transcripts could thus represent unrearranged alleles or aborted rearrangements. Either of these possibilities is consistent with disordered rearrangement mechanisms.
A second observation was that few out-of-frame rearrangements were detected at the TCRB locus. Because mechanisms of allelic exclusion normally operate to inhibit V to D rearrangements after a productive TCRβ chain is translated, this should result in a consistent ratio of out-of-frame to truncated alleles in the surviving T-cell pool. Mathematically, 2 of 3 of nonproductive transcripts should be out-of-frame and 1 of 3 truncated (DJC).43 However, in the presence of disordered or impaired rearrangement mechanisms, the out-of-frame rearrangements would become progressively diminished in proportion (E.G.B., unpublished observation, 1998). The TCRα transcripts would be affected much less because of lack of strict allelic exclusion. Thus, the decreased ratio of out-of-frame to truncated rearrangements within the TCRβ sequences, with relative preservation within the TCRα sequences, would also be consistent with disordered rearrangement mechanisms.
One of the more interesting findings in several of the patients was the demonstration of abnormal nonproductive transcripts (Tables 6, 7, and8). These included abnormal insertions of J genes into intronic sequences, inclusion of several contiguous J-region introns and exons within otherwise normally rearranged genes, and disordered splicing of C-region exons and introns. In some cases alternative mRNA splicing mechanisms may have created abnormalities, although none of the atypical transcripts identified were similar to those previously reported.44-46 The inability to detect more illegitimate or abnormally rearranged transcripts may be caused by the targeting of those cells for apoptosis because of persistent double-strand breaks or nonviable translocations.
In summary, Omenn’s syndrome may arise from different primary defects, the common endpoint being SCID with clinical and pathological features of GvHD caused by an autologous source of T lymphocytes. The immunologic hallmark of this disease is the expansion of an oligoclonal population of T cells. The identification of two patients with congenital malformations consistent with embryological defects of the pharyngeal pouches, one with classic DiGeorge anomaly and Chromosome 22q11 deletion, suggests that primary thymic defects may be the underlying cause in some patients. Other patients with Omenn’s syndrome have also been reported to have dysplastic thymi, but whether this is primary or secondary to the disease is unknown.12,47 48 The disordered TCRs identified in the patients described here highlight the possibility that defects previously thought to affect only the development of sufficient numbers of T cells, such as the DiGeorge anomaly, may also produce a qualitative defect in the generation of normal TCRs. Previously, defects in antigen receptor rearrangement were thought to result solely from primary defects in those rearrangement mechanisms, such as those identified in murine SCID. The identification of partial RAG defects in Omenn’s patients confirms that primary defects in VDJ recombination causes the thymic dysplasia and abnormal T-cell development in many patients. One of the more intriguing findings in this study was that there were similar abnormalities in the TCRs from the patient with the DiGeorge anomaly. This may imply that intrinsic defects in thymic epithelium may induce abnormalities in TCR rearrangement. Thus, different etiologies may cause Omenn’s syndrome, and common endpoints seem to be the oligoclonal expansion of antigen-driven T cells that bear TCRs, which reflect abnormal development and abnormal TCR rearrangement and assembly. The pathological induction of a GvHD-like illness may require defective T-cell development coupled with other unknown environmental and/or host factors to produce Omenn’s syndrome.
ACKNOWLEDGMENT
We thank Smita Vaidya, PhD for HLA typing; Armond S. Goldman, MD for referral of Case 1; and Harout Dersimonian, PhD and Yasushi Uematsu, MD, PhD for their assistance and protocols in the inverse PCR technique.
Supported by a Clinical Investigator Award, National Institutes of Health K08 AI01064 to E.G.B.
The publication costs of this article were defrayed in part by page charge payment. This article must therefore be hereby marked “advertisement” in accordance with 18 U.S.C. section 1734 solely to indicate this fact.

This feature is available to Subscribers Only
Sign In or Create an Account Close Modal