Abstract
Human herpesvirus 7 (HHV-7) infection of both primary CD4+ T lymphocytes and SupT1 lymphoblastoid T-cell line induced a progressive accumulation of cells exibiting a gap 2/mitosis (G2/M) and polyploid content coupled to an increased cell size. The expression of both cyclin-dependent kinase cdc2 and cyclin B was increased in HHV-7–infected cells with respect to the uninfected ones. Moreover, the simultaneous flow cytometric analysis of cyclin B and DNA content showed that cyclin B expression was not only increased but also unscheduled with respect to its usual cell cycle pattern. However, the levels of kinase activity associated to cdc2 were decreased in HHV-7–infected cells with respect to uninfected cultures. To elucidate the origin of the enlarged HHV-7–infected cells, extensive electron and confocal microscopy analyses were performed. Membrane fusion events associated to cytoplasmic bridges, which characterize the formation of syncytia, were never observed. On the other hand, analysis of serial sections of the same cells strongly suggested that enlarged HHV-7–infected cells contained a single polylobated nucleus. This was confirmed by flow cytometry analysis performed on nuclei isolated from HHV-7–infected cells, which showed multiple peaks with a DNA content >4n. Taken together, these data indicate that giant cells, which represent the hallmark of in vitro HHV-7 infection, arise from single CD4+ T cells undergoing a process of polyploidization.
© 1998 by The American Society of Hematology.
HUMAN HERPESVIRUS-7 (HHV-7) is a recently isolated CD4+ T-lymphotropic herpesvirus1 whose genetic content and organization are closely related to HHV-6 and cytomegalovirus.2-4 HHV-7 was first isolated from the peripheral blood lymphocytes of healthy individuals1,5,6and it turned out to be a prevalent virus toward which the great majority (>90%) of the population is seropositive by adulthood.7-9 At present, the only clinical manifestation clearly associated to primary HHV-7 infection is exanthem subitum.10-13 However, due to its high seroprevalence in the general population,7-9 HHV-7 might represent a potential opportunistic agent in immunocompromised hosts.14,15 Once reactivated, acute HHV-7 infection might worsen the state of immunodeficiency due to its selective tropism for CD4+ T lymphocytes.1,16 In fact, in vitro studies allowed to establish that the CD4 antigen acts as a critical component of the receptor for HHV-7.16 Moreover, HHV-7 induces several cytopathic effects on cultured CD4+ T lymphocytes, such as CD4+downregulation,14,16,17 induction of cell death by necrosis as well as by apoptosis,18 and formation of giant balloon-like cells,1,2,6 18 which represent the most readily observed effect of acute HHV-7 infection.
So far, no studies have been performed to explore the impact of HHV-7 infection on cell cycle control/progression. Two classes of proteins make up the protein-kinase complexes involved in the biochemical control of the cell cycle. The serine/threonine cell division kinases (cdk), also referred to as cyclin-dependent kinases, are the catalytic subunits of these complexes,19 whereas the cyclins function as the regulatory subunits. Cyclins are proteins that undergo dramatic fluctuations in abundance as a function of cell cycle progression and thus regulate the activation of the holoenzyme.20-22 There are at least eight members of the cyclin gene family.23,24Cyclin B is the best understood of the cyclins; it complexes with cdc2 to form M-phase promoting factor (MPF), the mitosis-initiating protein kinase complex.21 25
This study was undertaken to evaluate the potential involvement of cell cycle-associated proteins and protein kinase complexes in the cytopathic effects induced by an acute HHV-7 infection on CD4+ T cells and, in particular, on the formation of giant polyploid cells.
MATERIALS AND METHODS
Cells and HHV-7 infection.
Enriched populations of CD4+ T lymphocytes were derived from the peripheral blood of healthy blood donors. Primary CD4+ T cells were purified by negative immunomagnetic selection, using a mixture of monoclonal antibodies (MoAbs) to CD8, CD14, CD19, CD20, and CD56 (all from Becton Dickinson, San José, CA) and magnetic beads coated with goat antimouse IgG antiserum (Dynal, Great Neck, NY), as previously described.26 Primary cells were cultured in RPMI (GIBCO BRL Life Technologies Inc, Gaithersburg, MD) containing 10% fetal calf serum (FCS; GIBCO BRL) and activated with 5 μg/mL of purified phytohemagglutinin (PHA; Sigma Chemicals, St Louis, MO) plus 20 U/mL of human recombinant interleukin-2 (IL-2; Boeringher Mannheim, Postfack, Germany). After 3 days of culture, cells were washed twice and seeded again in complete medium plus 5 U/mL of IL-2 alone, which was readded every 4 days.
SupT1 lymphoblastoid CD4+ T cells (AIDS Research and Reference Reagent Program, National Institute of Health, Bethesda, MD) were routinely cultured in RPMI 1640 containing 10% FCS.
The HHV-7 isolate AL used in this study and the preparation procedures of viral stock have been previously described.6 SupT1 or preactivated primary CD4+ T cells were either mock-infected or adsorbed with HHV-7 for 10 hours at 37°C at a multiplicity of infection (MOI) of approximately 0.1. After adsorption, cells were washed to remove viral inoculum and diluted to the concentration of 5 × 10⁵ cells/mL with fresh medium in the absence or presence of 100 μg/mL of phosphonoformic acid (PFA; Sigma). In other experiments, HHV-7 infection was performed by coculture of productively infected SupT1 cells with uninfected SupT1 cells at a ratio of 1:10, respectively. The infection was allowed to proceed at 37°C. Viable cells were scored at light microscopy by Trypan blue staining every other day, when cell density was adjusted to 5 × 10⁵cells/mL.
The occurrence of a productive viral infection was monitored by morphological analysis of formation of enlarged (diameter, >20 μm) cells at light microscopy and by indirect immunofluorescence staining by using either a human anti–HHV-7 antiserum (Advance Biotechnologies, Columbia, MD) or a specific HHV-7 MoAb (5E1 MoAb; generously provided by Prof G. Campadelli-Fiume, University of Bologna, Bologna, Italy),27 as previously described.26 27
Preparation of isolated nuclei.
Nuclei were isolated from both uninfected and HHV-7–infected SupT1 cells, as previously described.28 Briefly, cells were centrifuged at 400g for 5 minutes; washed in phosphate-buffered saline (PBS); resuspended in a cell fractionation buffer containing 10 mmol/L Tris-HCl, pH 7.4, 10 mmol/L NaCl, 2 mmol/L MgCl2, and 1 mmol/L phenylmetylsulfonylfluoride (PMSF; all from Sigma) for 2 minutes at room temperature; and then cooled in an ice water bath at 0°C for 5 minutes. Nonidet P-40 (NP40) at 0.5% was then added, and the suspension was passed through a syringe (22G needle, a single up and down stroke). At this stage, all cells were disrupted, the concentration of MgCl2 was adjusted at 5 mmol/L, and the nuclear pellet was collected by centrifugation at 700g for 5 minutes. The nuclei were finally resuspended in a buffer containing 0.25 mol/L sucrose, 10 mmol/L Tris HCl, pH 7.4, 5 mmol/L MgCl2, 10 mmol/L NaCl, and 0.5 mmol/L PMSF.
Flow cytometry.
For cell cycle analysis, samples containing either 5 × 10⁵ primary CD4+ lymphocytes, SupT1 cells, or nuclei isolated from SupT1 cells were harvested by centrifugion at 200g for 10 minutes at 4°C, fixed with cold 70% ethanol for at least 1 hour at 4°C, and treated as previously described.29 Briefly, samples were pelletted, treated with 0.5 μg RNAse (type I-A; Sigma), and resuspended in PBS containing 50 μg/mL propidium iodide (PI). Analysis of PI fluorescence was performed on a FACStar Plus flow cytometer (Becton Dickinson) with the FL2 detector in either a linear (cells) or a logarithmic (isolated nuclei) mode using Lysis II software (Becton Dickinson). Ten thousand to 30,000 events were collected for each sample. Data analysis was performed with Lysis II software (Becton Dickinson). In most experiments performed on primary CD4+ T lymphocytes or SupT1 cells, samples were gated to exclude cells with a subdiploid (<2n) or >4n DNA content and only the inferred gap 1 (G1), synthesis (S) and gap 2+mitosis (G2+M) peaks were further considered. The proportions of cells in the G1, S, and G2+M phases of the cell cycle were calculated as previously described.30 In particular, the S-phase events were divided equally between the G1 and G2+M phases, based on peak channels of fluorescence intensity. For simplicity, the G1 and G2+M values have been provided.
For analysis of cdc2 and cyclin B expression, 10 × 106 cells were harvested by centrifugation at 200gfor 10 minutes at 4°C and fixed with cold 70% ethanol for at least 2 hours at −20°C. Just before staining, ethanol was removed by centrifugation at 400g for 10 minutes and, after washings in wash buffer (PBS + 1% FCS), the cells were incubated in cold 0.25% Triton X-100 wash buffer for 5 minutes. After washings, staining was performed by incubating aliquots of cell suspension with 10 μL of anti-cyclin B (MoAb, clone GNS1; Santa Cruz Biotechnology, Santa Cruz, CA) or anti-cdc2 MoAb (cdc2 p34; Santa Cruz) or isotype control antibody (Pharmiger, San Diego, CA) for 30 minutes at room temperature. After two washings in PBS, 10 μL of goat antimouse IgG directly conjugated to fluorescein (GAM-FITC; Becton Dickinson) was added for 30 minutes at 4°C. For the simultaneous analysis of intracellular cyclin B and DNA content of cells, double staining was performed as described.31
Western blot analysis.
SupT1 cells were lysed at 4°C in RIPA buffer (1% NP40, 1% deoxycholate) containing 1 μg/mL aprotinin, 2 μg/mL leupeptin, 1 mmol/L PMSF, and 1 mmol/L sodium orthovanadate, and protein concentrations were estimated by the Bio-Rad protein assay according to the manufacturer’s protocol (Bio-Rad, Hercules, CA). Equivalent amounts of proteins per sample were subjected to electrophoresis on a 12% sodium dodecyl sulfate (SDS)-acrylamide gel. The gel was then electroblotted onto a nitrocellulose membrane; equal loading of protein in each lane was confirmed by brief staining of the blot with 0.1% Ponceau S followed by destaining before reacting with the specific antibodies. Detection of specific proteins was performed using the following antibodies: anti-cyclin B MoAb (at 1:100 dilution; Santa Cruz), anti-cdc2 kinase MoAb (at dilution 1:100; Santa Cruz), anti–β-tubulin MoAb (at 1:200 dilution; Boeringher Mannheim), antiphosphotyrosine (P-Tyr) MoAb (Upstate Biotechnology Inc, Lake Placid, NY). Immunoreactive bands were visualized after incubation with a peroxidase-conjugated goat antimouse IgG (at 1:5,000 dilution; Amersham Corp, Arlington, UK), using the ECL Detection System (Amersham Corp) according to the manufacturer’s instructions.
Densitometric analysis of immunoreactive bands was performed with an imaging densitometer (Model GS 670; Bio-Rad) using the Molecular Analyst software. The results were expressed in arbitrary units (a.u.).
Immunoprecipitations and histone H1 kinase assays.
Aliquots containing approximately 10 × 106 SupT1 cells were solubilized in RIPA buffer (1% NP40, 1% deoxycholate) containing 1 μg/mL aprotinin, 2 mg/mL leupeptin, 1 mmol/L PMSF, and 1 mmol/L sodium orthovanadate for 30 minutes at 4°C. The suspension was centrifuged at 14,000 rpm for 15 minutes and the proteic content was estimated by the Bio-Rad protein assay. A volume of supernatant containing 5 mg of proteins was incubated at 4°C with 50 μL of protein A-Sepharose together with 20 μL of anti-cdc2 IgG (Santa Cruz). The mixture was then centrifuged at 10,000 rpm for 15 minutes, washed at least three times with lysis buffer, and washed twice with kinase buffer (40 mmol/L HEPES, 8 mmol/L MgCl2). Kinase assays were performed with 18 μL of reaction mixture containing 40 mmol/L HEPES, 8 mmol/L MgCl2, 166 mmol/L ATP, 5 μCi of (γ-32P)ATP (3,000 Ci/mmol; NEN, Boston, MA), 4 μg of histone H1 (Boehringer), and 10 μL of packed protein A-Sepharose. After 20 minutes at 37°C, the reaction was stopped by the addition of SDS sample buffer. The reaction mixture was loaded on SDS-12% polyacrylamide gels, stained with Comassie brilliant blue, dried, and autoradiographed. The spots corresponding to the substrate were excised from the gel and radioactivity was counted in a liquid scintillation counter.
In situ immunocytochemistry.
S-phase labeling was performed by evaluating 5-Bromo-2′-Deoxyuridine (BrdU) uptake, followed by immunocytochemical analysis, as previously described.32Briefly, uninfected and HHV-7–infected cultures were seeded at the same density in fresh medium, followed by incubation with BrdU (final concentration, 10 mmol/L; Sigma) at 37°C for 30 minutes. The medium was then removed, and the cells were washed twice with PBS. Cells (8 × 10⁴) were spun on slides with a Cytospin apparatus, fixed for 10 minutes in 2% para-formaldehyde in PBS, and permeabilized with a saponin buffer (0.1% saponin, 10% FCS in PBS) for 30 minutes at room temperature. DNA was denatured by a treatment with 4 mol/L HCl for 10 minutes. After neutralization in 0.1 mol/L sodium tetraborate and washings in PBS, immunocytochemical detection of BrdU was performed by using an anti-BrdU-FITC MoAb (Boehringer) for 1 hour at room temperature. Identification of HHV-7–infected cells was performed by additional staining with a human anti–HHV-7 antiserum (1:200 dilution; Advance Biotechnologies) at room temperature for 15 minutes. Cells were washed four times in PBS and incubated with Cy3-conjugated donkey antihuman serum (1:2,000 dilution; Jackson ImmunoResearch, Bar Harbor, ME). Ten to 20 fields per experiment (∼300 to 400 cells in total) were scored for labeled nuclei.
Immunocytochemical detection of cyclin B was performed by applying a 1:100 dilution of anti-cyclin B MoAb (Santa Cruz) for 1 hour at 37°C. Cells were washed in PBS and incubated for 1 hour at room temperature with an FITC-conjugated sheep antimouse IgG serum (1:50 dilution; Boehringer).
Negative controls consisted of incubation with normal mouse serum followed by identical second layer labelings as described above. Slides were mounted with DABCO glycerol, observed, and photographed on a Zeiss Axiophot microscope (Zeiss, Oberchocken, Germany).
Morphological studies.
For the ultrastructural studies, SupT1 cells were fixed with 1% glutaraldehyde in 0.1 mol/L PBS, postfixed with 1% osmium tetroxide, and embedded in Epon according to routine techniques, as previously described.18 Serial semithin sections were taken, stained with 1% toluidine blue, and then observed and photographed at light microscopy. Thin sections were mounted on nickel grids and examined by transmission electron microscopy after staining with uranyl acetate and lead citrate.
For confocal microscopy studies, samples were stained with propidium iodide as described above and imaged by a Zeiss LSM410 inverted confocal laser scanning microscope (Zeiss) coupled to a 25-mW Argon ion laser as a light source. Image processing analysis on digitized optical sections was performed on the graphics workstation Indy (Silicon Graphics, Mountain View, CA).
Statistics.
The data are expressed as the mean ± standard deviation (SD) of the mean of at least three separate experiments performed in duplicate. Statistical analysis was performed using the two-tailed Student’st-test.
RESULTS
HHV-7 infection causes abnormalities of the cell cycle progression in both primary CD4+ T lymphocytes and SupT1 lymphoblastoid CD4+ T-cell line.
Both primary CD4+ T lymphocytes and SupT1 CD4+lymphoblastoid T cells were infected with cell-free viral inoculum (MOI 0.1). Aliquots of cells, harvested from both HHV-7–infected and uninfected cultures, were analyzed in a time-course experiment by indirect immunofluorescence to monitor HHV-7 expression (Table 1) and by flow cytometry, after propidium iodide staining, to evaluate the DNA content (Fig 1A and B). Because the aim of this set of experiments was to analyze the different cell cycle phases in HHV-7–infected versus uninfected cells, samples were gated to exclude cells with a subdiploid (<2n) or polyploid (>4n) DNA content. Moreover, the FL2 detector was used in a linear mode, which gives some advantages in distinguishing among gap 1 (G1), synthesis (S), and gap 2+mitosis (G2+M).33 It is noteworthy that the calculated proportion of primary CD4+ T cells seen by flow cytometry in the G1 peak also includes quiescent cells in G0.
HHV-7 Infection of Primary CD4+Lymphocytes and SupT1 Cells: Viral Expression Analysis
| Days p.i. . | HHV-7–Positive Cells (%) . | |
|---|---|---|
| Primary CD4+ T Cells . | SupT1 Cells . | |
| 2 | <5 | <5 |
| 6 | 49 ± 7.5 | 43 ± 6 |
| 12 | 77 ± 9 | 83 ± 8.5 |
| Days p.i. . | HHV-7–Positive Cells (%) . | |
|---|---|---|
| Primary CD4+ T Cells . | SupT1 Cells . | |
| 2 | <5 | <5 |
| 6 | 49 ± 7.5 | 43 ± 6 |
| 12 | 77 ± 9 | 83 ± 8.5 |
The percentage of HHV-7–positive cells was determined at serial time points p.i. by indirect immunofluorescence, analyzing at least four different fields and a total of approximately 200 cells per each sample. Data are expressed as the mean ± SD of four separate experiments.
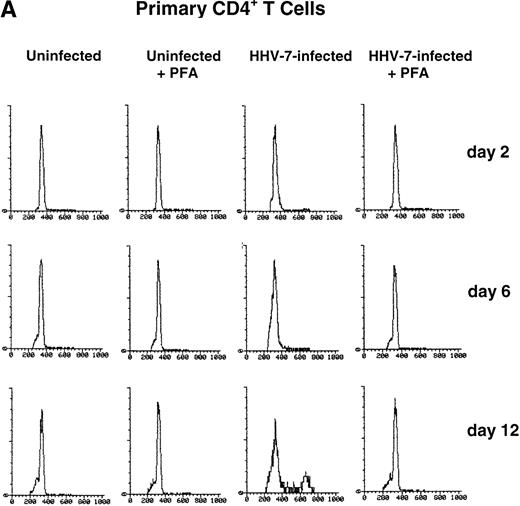
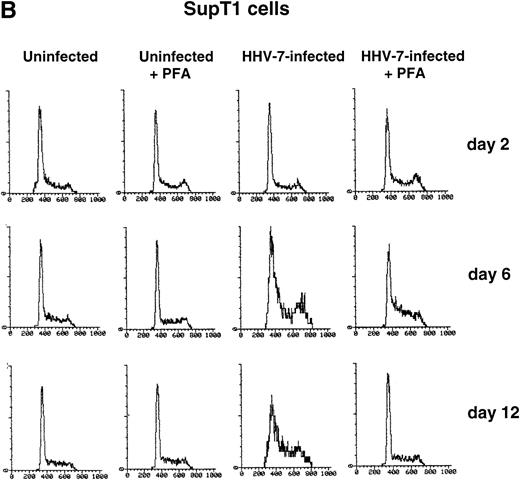
PHA-stimulated primary CD4+ T lymphocytes (A) and SupT1 cells (B) were mock-infected or infected with HHV-7 in the presence or absence of PFA, and cell cycle was analyzed by flow cytometry, at 48-hour intervals, after staining of the DNA content with propidium iodide. The X axis shows the DNA content in a linear scale, determined based on fluorescence due to propidium iodide staining, and the Y axis reflects the relative number of cells. The percentage of cells in the G1(2n) and G2+M(4n) phases of the cell cycle for each experimental point are reported in Tables 2 and3. These results are representative of four separate experiments performed in duplicate.
PHA-stimulated primary CD4+ T lymphocytes (A) and SupT1 cells (B) were mock-infected or infected with HHV-7 in the presence or absence of PFA, and cell cycle was analyzed by flow cytometry, at 48-hour intervals, after staining of the DNA content with propidium iodide. The X axis shows the DNA content in a linear scale, determined based on fluorescence due to propidium iodide staining, and the Y axis reflects the relative number of cells. The percentage of cells in the G1(2n) and G2+M(4n) phases of the cell cycle for each experimental point are reported in Tables 2 and3. These results are representative of four separate experiments performed in duplicate.
Cell cycle analysis showed that, in mock-infected primary CD4+ T lymphocytes, the fraction of cells in G2+M (4n) never exceeded 3.4% (Table 2). On the other hand, the HHV-7–infected primary CD4+ T lymphocyte cultures had a DNA profile that was skewed toward G2+M (4n) accumulation (Table 2). Notably, at days 10 through 12 postinfection (p.i.), a significantly (P < .01) higher fraction of HHV-7–infected cells were in G2+M (4n) with respect to uninfected cultures (Fig 1A and Table 2).
HHV-7 Infection of Primary CD4+ T Lymphocytes: Cell Cycle Analysis
| Cell and Day . | % of Cells . | |
|---|---|---|
| G1(2n) . | G2M(4n) . | |
| Uninfected | ||
| 2 | 98.8 | 1.2 |
| 4 | 98.6 | 1.4 |
| 6 | 98.5 | 1.5 |
| 8 | 97.8 | 2.2 |
| 10 | 97.7 | 2.3 |
| 12 | 96.6 | 3.4 |
| Uninfected + PFA | ||
| 2 | 98.5 | 1.5 |
| 4 | 98.4 | 1.6 |
| 6 | 98.6 | 1.4 |
| 8 | 97.9 | 2.1 |
| 10 | 97.8 | 2.2 |
| 12 | 96.7 | 3.3 |
| HHV-7–infected | ||
| 2 | 98.8 | 1.2 |
| 4 | 98.3 | 1.7 |
| 6 | 96.6 | 3.4 |
| 8 | 94.4 | 5.6 |
| 10 | 88.2 | 11.8 |
| 12 | 73.6 | 26.4 |
| HHV-7–infected + PFA | ||
| 2 | 98.7 | 1.3 |
| 4 | 98.3 | 1.7 |
| 6 | 97.5 | 2.5 |
| 8 | 97.8 | 2.2 |
| 10 | 97.8 | 2.2 |
| 12 | 97.1 | 2.9 |
Data represent the means of four separate experiments. SD were comprised within 15% of the means.
With respect to primary CD4+ T cells, a greater proportion of SupT1 cells was found in the G2+M (4n) phase of the cell cycle during the culture time (Fig 1B and Table 3). However, whereas the G1(2n)/G2+M(4n) ratio remained rather constant in mock-infected SupT1 cells for the duration of the experiment, HHV-7–infected cultures showed a progressive accumulation of cells in G2+M(4n) relative to those in G1(2n) (Fig 1B). The differences between HHV-7–infected and uninfected cells became statistically significant (P < .01) at days 10 through 12 p.i. (Table 3), when the majority of the cells were infected (Table 1).
HHV-7 Infection of SupT1 Cells: Cell Cycle Analysis
| Cell and Day . | % of Cells . | |
|---|---|---|
| G1(2n) . | G2M(4n) . | |
| Uninfected | ||
| 2 | 78.6 | 21.4 |
| 4 | 77.5 | 22.5 |
| 6 | 76.2 | 23.8 |
| 8 | 78.6 | 21.4 |
| 10 | 77.4 | 22.6 |
| 12 | 78.2 | 21.8 |
| Uninfected + PFA | ||
| 2 | 75.3 | 24.7 |
| 4 | 74.5 | 25.5 |
| 6 | 76.0 | 24.0 |
| 8 | 76.9 | 23.1 |
| 10 | 74.2 | 25.8 |
| 12 | 75.9 | 24.1 |
| HHV-7–infected | ||
| 2 | 78.0 | 22.0 |
| 4 | 76.6 | 23.4 |
| 6 | 73.1 | 26.9 |
| 8 | 69.1 | 30.9 |
| 10 | 64.6 | 35.4 |
| 12 | 62.0 | 38.0 |
| HHV-7–infected + PFA | ||
| 2 | 73.1 | 26.9 |
| 4 | 75.6 | 24.4 |
| 6 | 73.8 | 26.2 |
| 8 | 75.3 | 24.7 |
| 10 | 75.5 | 24.5 |
| 12 | 75.7 | 24.3 |
Data represent the means of four separate experiments. SD were comprised within 15% of the means.
To elucidate the role of viral spread in the HHV-7–mediated induction of G2+M (4n) accumulation, cell cycle was also analyzed in cultures supplemented with PFA, a specific inhibitor of herpetic DNA polymerase (Fig 1A and B and Tables 2 and 3). PFA-treated HHV-7–infected cultures exhibited a cell cycle profile very similar to that of PFA-treated mock-infected cultures and significantly (P< .01) different from that of HHV-7–infected cultures at days 10 through 12 p.i.. These data demonstrate the need of HHV-7 replication for the progressive appearance of cell cycle abnormalities. To further characterize this phenomenon, SupT1 cell line was used as a model system for the next experiments.
In consideration of the promiscuity of infected and uninfected cells in HHV-7–infected cultures, a dual-label staining was next used to more specifically analyze the DNA synthesis (S) phase in combination with the presence of viral antigens (Table 4). At day 12 p.i., among the cells staining positively for the expression of viral antigens, the majority stained positive also for BrdU incorporation, resulting in a significantly (P < .05) higher percentage compared with the HHV-7–negative uninfected cells (Table4). It is also noteworthy that, among the HHV-7–infected cells that incorporated BrdU, approximately 55% of these cells were small (diameter, 10 to 20 μm), whereas the remaining 45% showed an increased size (diameter, >20 μm).
BrdU Labeling Index in Uninfected and HHV-7–Infected SupT1 Cell Cultures
| Cell Type . | BrdU Positivity (%) . |
|---|---|
| Uninfected SupT1 cultures | 36 ± 4.5 |
| HHV-7–infected SupT1 cultures | |
| Cells negative for HHV-7 Ag | 34 ± 3.8 |
| Cells positive for HHV-7 Ag | 67 ± 4.1 |
| Cell Type . | BrdU Positivity (%) . |
|---|---|
| Uninfected SupT1 cultures | 36 ± 4.5 |
| HHV-7–infected SupT1 cultures | |
| Cells negative for HHV-7 Ag | 34 ± 3.8 |
| Cells positive for HHV-7 Ag | 67 ± 4.1 |
Data are expressed as the means ± SD of four separate experments performed at day 12 p.i. In each culture, approximately 300 to 400 cells were scored. HHV-7–positive cells have been identified by double staining with an anti–HHV-7 human serum.
HHV-7 infection induces disregulation of the mitotic regulatory proteins cdc2 and cyclin B.
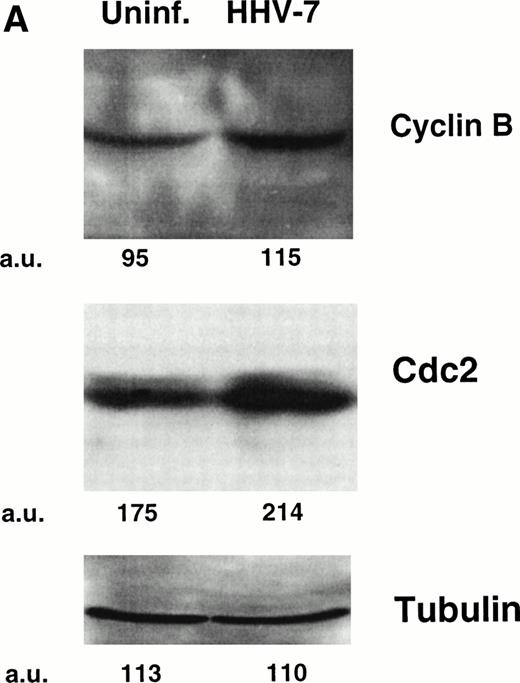
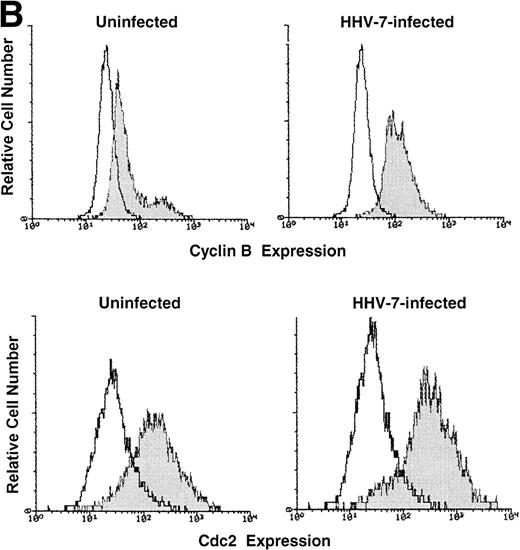
One critical event that drives mammalian cells from G2 into mitosis is the activation of the maturation-promoting factor,19-21,25 34 whose components include cdc2 in association with cyclin B. Therefore, the expression of both cdc2 and cyclin B proteins was analyzed by Western blot (Fig 2A) and flow cytometry (Fig 2B). Because the cell size greatly varied among HHV-7–infected and uninfected SupT1 cell cultures, Western blot experiments were performed migrating equal amounts of proteins obtained from these heterogeneous cell populations. At day 12 p.i., the levels of cdc2 and cyclin B showed a clearly detectable increase in HHV-7–infected with respect to uninfected SupT1 cultures (Fig 2A and B).
Expression of the mitotic regulatory proteins, cyclin B and cdc2, in uninfected and HHV-7–infected cells evaluated by immunoblotting analysis of whole cell lysates (A) and by flow cytometric analysis (B). (A) Equivalent amounts of protein lysates obtained from HHV-7–infected and uninfected SupT1 cells were analyzed by Western blot with an anti-cyclin B and with an anti-cdc2 MoAb. Equal loading of protein in each lane was confirmed by staining with the antibody to tubulin. The relative intensities of the bands were densitometrically quantified and expressed in arbitrary units (a.u.). (B) Intracellular expression of cyclin B and cdc2 proteins was analyzed in uninfected and HHV-7–infected cells by indirect immunofluorescence staining shown by flow cytometry. A representative analysis, performed at 12 days p.i., is shown. A shift in the number of positively staining fluorescent cells along the X axis (shaded histograms) shows the increased level of cyclin B and cdc2 expression in HHV-7–infected cultures. The control (open) histograms represent the background intracellular fluorescence obtained from the staining of the same cultures with a isotype control MoAb before FITC-conjugated secondary Ab. Y axis, relative cell number. Data shown are from a single experiment representative of four independent experiments with similar results.
Expression of the mitotic regulatory proteins, cyclin B and cdc2, in uninfected and HHV-7–infected cells evaluated by immunoblotting analysis of whole cell lysates (A) and by flow cytometric analysis (B). (A) Equivalent amounts of protein lysates obtained from HHV-7–infected and uninfected SupT1 cells were analyzed by Western blot with an anti-cyclin B and with an anti-cdc2 MoAb. Equal loading of protein in each lane was confirmed by staining with the antibody to tubulin. The relative intensities of the bands were densitometrically quantified and expressed in arbitrary units (a.u.). (B) Intracellular expression of cyclin B and cdc2 proteins was analyzed in uninfected and HHV-7–infected cells by indirect immunofluorescence staining shown by flow cytometry. A representative analysis, performed at 12 days p.i., is shown. A shift in the number of positively staining fluorescent cells along the X axis (shaded histograms) shows the increased level of cyclin B and cdc2 expression in HHV-7–infected cultures. The control (open) histograms represent the background intracellular fluorescence obtained from the staining of the same cultures with a isotype control MoAb before FITC-conjugated secondary Ab. Y axis, relative cell number. Data shown are from a single experiment representative of four independent experiments with similar results.
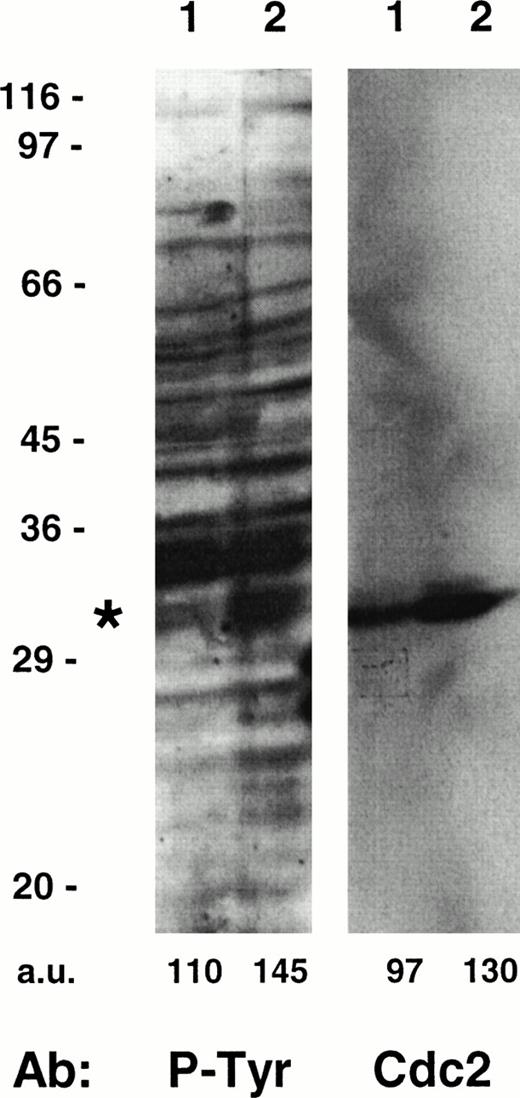
Taking into account that tyrosine phosphorylation events are involved in the regulation of several cell cycle kinases,19,20 35 we also analyzed the P-Tyr content of intracellular proteins in HHV-7–infected and uninfected cultures (Fig 3). The amount of tyrosine phosphorylation of a 34-kD substrate appeared significantly increased in the HHV-7–infected SupT1 cells, as compared with uninfected cells. The size of this protein suggested that it might be cdc2p34, which was confirmed by removing the anti–P-Tyr antibody and reprobing the same membrane with a specific anti-cdc2 MoAb (Fig 3).
Tyrosine phosphorylation of cdc2 in uninfected and HHV-7–infected (12 days p.i.) SupT1 cells. Equivalent amounts of protein lysates obtained from uninfected (lane 1) and HHV-7–infected (lane 2) cells were analyzed by Western blot with an anti–P-Tyr MoAb. Migration of a major tyrosine-phosphorylated substrate is indicated by the asterix. Molecular size markers are indicated on the left (in kilodaltons). The relative intensities of the bands were densitometrically quantified and expressed in arbitrary units (a.u.). These results are representative of three experiments performed.
Tyrosine phosphorylation of cdc2 in uninfected and HHV-7–infected (12 days p.i.) SupT1 cells. Equivalent amounts of protein lysates obtained from uninfected (lane 1) and HHV-7–infected (lane 2) cells were analyzed by Western blot with an anti–P-Tyr MoAb. Migration of a major tyrosine-phosphorylated substrate is indicated by the asterix. Molecular size markers are indicated on the left (in kilodaltons). The relative intensities of the bands were densitometrically quantified and expressed in arbitrary units (a.u.). These results are representative of three experiments performed.
To further investigate the relationships between the HHV-7–associated alteration of cell cycle progression and cdc2, immunoprecipitates were prepared from equal amounts of proteins using anti-cdc2 MoAb, and histone H1 kinase activity was measured in HHV-7–infected SupT1 cells (days 10 through 12 p.i.) in comparison with uninfected cultures. The kinase activity associated to cdc2 immunoprecipitates was significantly (P < .05) reduced in HHV-7–infected cultures with respect to uninfected cultures (16,926 ± 1,870 cpm v 27,297 ± 3,080 cpm, respectively; data were calculated as the means ± SD of 3 separate experiments).
Cyclin B expression is unscheduled during the cell cycle in HHV-7 cultures.
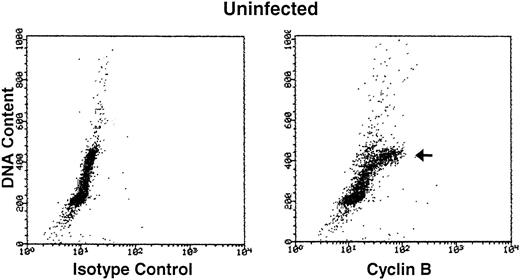
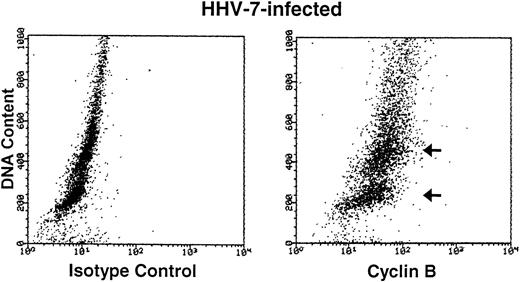
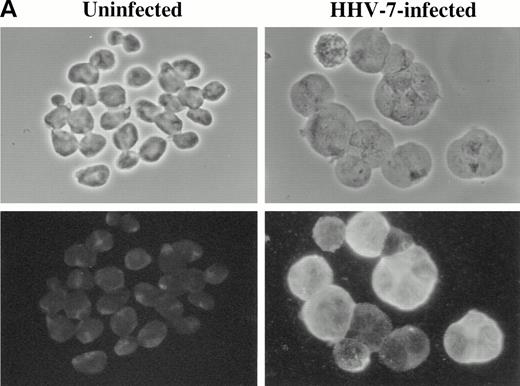
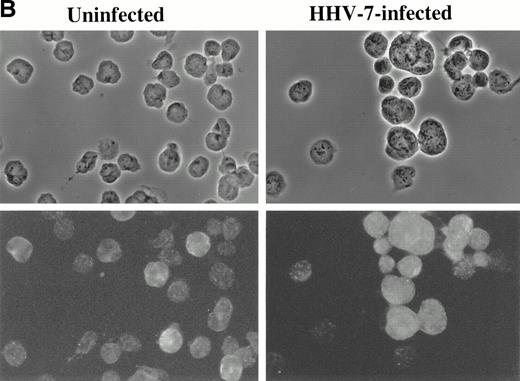
Cyclin B expression is typically induced in S phase, reaches maximal levels in G2 phase, localizes to the nucleus in M phase, and is degraded before cell division.22Figure 4 shows the relationship between cyclin B expression and DNA content in both uninfected and HHV-7–infected cells. As expected,31 only the G2M (4n) fraction of cells showed high cyclin B levels in the uninfected cultures. On the other hand, HHV-7–infected cells (day 12 p.i.) showed increase levels of cyclin B in all phases of cell cycle, including G1S. These results demonstrate that cyclin B expression is induced in virus-infected cells with G1S DNA content and, of note, persists to high levels also in cells with a DNA content of 4n or higher (Fig 4). Moreover, in situ immunocytochemistry analysis of HHV-7–infected cultures showed that aberrantly large (diameter, >20 mm) cells, invariably positive for HHV-7 antigens (Fig 5A), also reacted strongly to the anti-cyclin B MoAb (Fig 5B).
Bivariate cyclin B expression versus DNA content distributions (scatter plots) in uninfected (top panels) and HHV-7–infected (bottom panels) SupT1 cells. Cell cycle expression of cyclin B was evaluated by simultaneous staining with propidium iodide and anti-cyclin B MoAb followed by an FITC-conjugated MoAb. Staining of uninfected and HHV-7–infected SupT1 cells with a isotype control MoAb before FITC-conjugated secondary antibody is shown in the left panels. Cyclin B-FITC fluorescence intensity is plotted on the X axis, and fluorescence intensity of propidium iodide DNA staining is plotted on the Y axis. The insets show the percentage of cells, calculated after removal of the apoptotic cells, with a G1(2n), S, G2M(4n), and >4n DNA content. The cell populations showing high cyclin B expression, based on DNA content, are marked by arrows. A representative analysis of three separate experiments, performed at 12 days p.i., is shown.
Bivariate cyclin B expression versus DNA content distributions (scatter plots) in uninfected (top panels) and HHV-7–infected (bottom panels) SupT1 cells. Cell cycle expression of cyclin B was evaluated by simultaneous staining with propidium iodide and anti-cyclin B MoAb followed by an FITC-conjugated MoAb. Staining of uninfected and HHV-7–infected SupT1 cells with a isotype control MoAb before FITC-conjugated secondary antibody is shown in the left panels. Cyclin B-FITC fluorescence intensity is plotted on the X axis, and fluorescence intensity of propidium iodide DNA staining is plotted on the Y axis. The insets show the percentage of cells, calculated after removal of the apoptotic cells, with a G1(2n), S, G2M(4n), and >4n DNA content. The cell populations showing high cyclin B expression, based on DNA content, are marked by arrows. A representative analysis of three separate experiments, performed at 12 days p.i., is shown.
Immunofluorescence analysis of HHV-7 antigen (A) and cyclin B (B) expression in uninfected and HHV-7–infected SupT1 cells. The same cells are viewed by phase contrast microscopy (top panels) and fluorescence microscopy (bottom panels). In (A), note that enlarged cells, characteristic of HHV-7 infected cultures, are positively stained for expression of viral antigens. In (B), note that, whereas cyclin B expression is heterogenous among small cells, enlarged HHV-7–infected cells always exhibit an intense staining for cyclin B. Original magnification × 400. Representative fields are shown.
Immunofluorescence analysis of HHV-7 antigen (A) and cyclin B (B) expression in uninfected and HHV-7–infected SupT1 cells. The same cells are viewed by phase contrast microscopy (top panels) and fluorescence microscopy (bottom panels). In (A), note that enlarged cells, characteristic of HHV-7 infected cultures, are positively stained for expression of viral antigens. In (B), note that, whereas cyclin B expression is heterogenous among small cells, enlarged HHV-7–infected cells always exhibit an intense staining for cyclin B. Original magnification × 400. Representative fields are shown.
HHV-7 induces polyploidization of the infected cells.
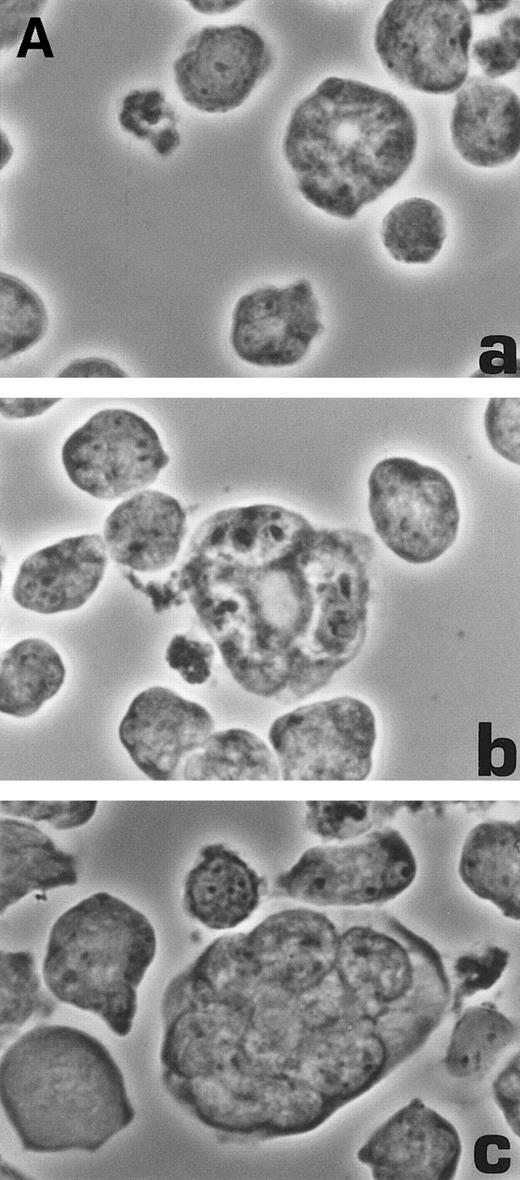
Although it is usually assumed that enlarged polyploid cells appearing in HHV-7–infected cultures are syncytia, resulting from the fusion of individual HHV-7–infected cells with uninfected cells, this assumption has never been proved. Because cyclin B degradation is necessary for cell division to occur,22 the data given above suggest, as an alternative possibility, that enlarged HHV-7–infected cells may result from a process of polyploidization rather than from fusion events. To address this issue, extensive light, electron, and confocal microscopy examinations were performed. An example of the observations performed is shown in Fig 6. At days 6 through 12 p.i., an heterogenous population of cells with a progressively increasing size and polylobated nuclei was easily recognized (Fig 6A).
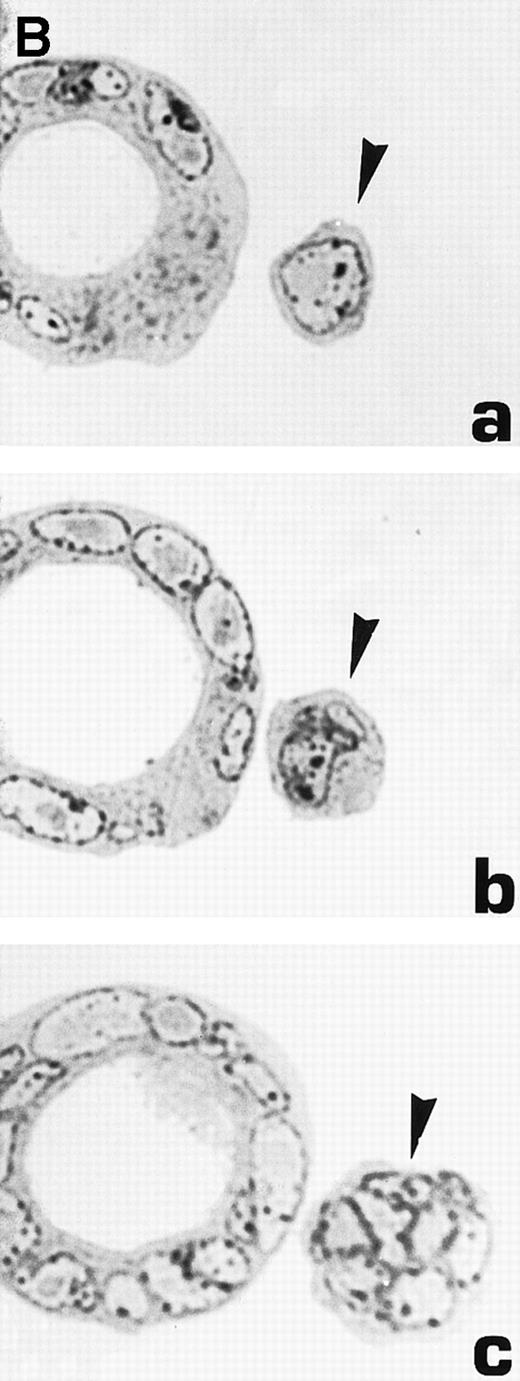
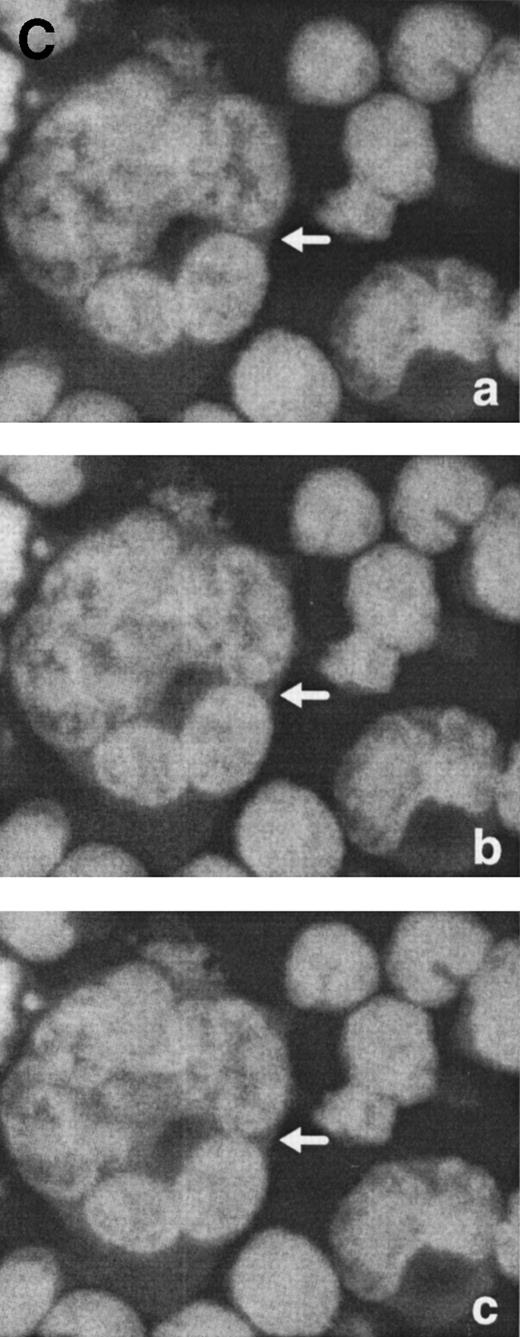
Morphological characterization of enlarged (diameter, >20 μm) cells from HHV-7–infected SupT1 cultures. (A) Light micrographs showing cells with a progressively increasing size (a through c) having prominent and lobulated nucleus. (B) Light micrographs of serial semithin (1 μm) plastic sections of the same cells. Note that the multiple nuclear sections evident in panel c belong to the same irregular nucleus shown in panels a and b. (C) Confocal microscope images of the nucleus of a giant HHV-7–infected cell after staining of the DNA with propidium iodide. (a through c) Confocal sections were taken 0.5 μm apart. Whereas two nuclear lobes were clearly separated in panel a, they appeared connected by a nuclear bridge in successive sections (panels b and c). In (B) and (C), the arrow shows the same point in different sections. Original magnification in (A) and (B) × 400; in (C) × 1,000.
Morphological characterization of enlarged (diameter, >20 μm) cells from HHV-7–infected SupT1 cultures. (A) Light micrographs showing cells with a progressively increasing size (a through c) having prominent and lobulated nucleus. (B) Light micrographs of serial semithin (1 μm) plastic sections of the same cells. Note that the multiple nuclear sections evident in panel c belong to the same irregular nucleus shown in panels a and b. (C) Confocal microscope images of the nucleus of a giant HHV-7–infected cell after staining of the DNA with propidium iodide. (a through c) Confocal sections were taken 0.5 μm apart. Whereas two nuclear lobes were clearly separated in panel a, they appeared connected by a nuclear bridge in successive sections (panels b and c). In (B) and (C), the arrow shows the same point in different sections. Original magnification in (A) and (B) × 400; in (C) × 1,000.
Virus-induced cell fusion is characterized by three distinct stages: (1) adhesion between two cells, (2) membrane fusion associated to cytoplasmic bridges, and (3) enlargement of the bridges to yield what would be recognized as a syncytium.36Although adhesion between separate cells was easily noticed in HHV-7–infected cultures (an example is shown in Fig 5A), extensive transmission electron microscopy observations did not provide any evidence of membrane fusion. Moreover, the analysis of serial 1-μm semithin sections of the same cell strongly suggested that the various nuclear lobes present in a given section likely belong to the same nucleus (Fig 6B). This was also evident at confocal microscopy analysis of serial 0.5-μm sections of HHV-7–infected cells examined after staining of the DNA with propidium iodide. Figure 6C shows a giant polyploid cell in which a nuclear bridge connecting two lobes of the same nucleus was absent in a section (panel a), became clearly evident in the section shown in panel b, and then almost disappeared in the following sections of the same cell (panel c).
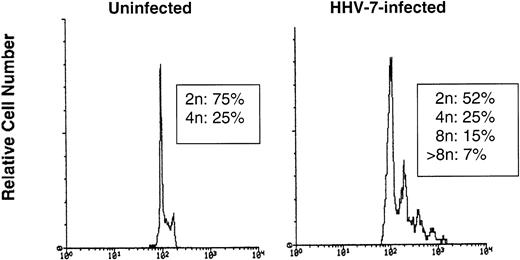
An additional approach to resolve this issue was to evaluate the DNA content of nuclei isolated from HHV-7–infected (12 days p.i.) and uninfected SupT1 cells. If giant HHV-7–infected cells resulted from the fusion of previously separate cells (syncytia), one would expect to observe a profile with only 2n/4n, whereas nuclei with a ploidy >4n should appear only if these cells were true polyploid nuclei. Taking into account that the ploidy follows a log-normal distribution, 30,000 nuclei were analyzed using the FL2 detector in a logarithmic scale. As shown in Fig 7, nuclei from HHV-7–infected cells clearly showed distinct peaks of ploidy >4n, whereas uninfected SupT1 cells only showed a ploidy of 2 to 4n.
The DNA content was analyzed in nuclei isolated from uninfected or HHV-7–infected (12 days p.i.) SupT1 cells by flow cytometry after staining with propidium iodide. The X axis, in a logarithmic scale, shows the DNA content determined based on fluorescence due to propidium iodide staining, and the Y axis reflects the relative number of cells. These results are representative of three separate experiments.
The DNA content was analyzed in nuclei isolated from uninfected or HHV-7–infected (12 days p.i.) SupT1 cells by flow cytometry after staining with propidium iodide. The X axis, in a logarithmic scale, shows the DNA content determined based on fluorescence due to propidium iodide staining, and the Y axis reflects the relative number of cells. These results are representative of three separate experiments.
DISCUSSION
In this report, we have demonstrated that HHV-7 infection of both primary CD4+ T lymphocytes and SupT1 CD4+lymphoblastoid T-cell line causes cell cycle abnormalities resulting in the accumulation of cells in the G2M phase of the cell cycle in asynchronously dividing cell populations. Some of the HHV-7–infected T cells eventually become polyploid, whereas those that are unable to undergo polyploidization are likely to die by apoptosis.18
One critical event that drives mammalian cells from G2 into mitosis is the activation of the maturation-promoting factor, whose components include cdc2 and cyclin B.21,34 cdc2 is highly regulated, requiring dephosphorylation on Tyr15 by CDC25 for its activation20,35; antagonizing this reaction is the Wee 1 kinase, which phosphorylates cdc2 and thus inhibits the transition into mitosis.37 The active cyclin B/cdc2 complex promotes the dissolution of the nuclear membrane, chromatin condensation, and spindle formation. At the end of mitosis, cyclin B/cdc2 complexes disassemble and lose activity.
In HHV-7–infected CD4+ T cells, we noticed several abnormalities of the mitotic promoting factor components, which may account for the progressive accumulation of cells with a 4n or >4n DNA content in these cultures. In fact, the total amount of cdc2, including its tyrosine phosphorylated inactive form, was upregulated, whereas the kinase activity associated to cdc2 was decreased in HHV-7–infected cultures with respect to the uninfected ones. Moreover, the total amount of cyclin B was increased in HHV-7 cells and its expression was unscheduled, being observed also in cells with a G1 or >4n DNA content.
Interestingly, some models of apoptosis have suggested a requirement for disregulation of the maturation-promoting factor.38-42It has been proposed that cyclin B/cdc2 might be involved in the nuclear changes (permeabilization to cytoplasmic nuclease, activation of nucleases, chromatin disruption, and condensation) that are observed during apoptosis. Thus, although we cannot distinguish whether the onset of G2 arrest is required for initiation of HHV-7–induced apoptosis, the above described abnormalities of the maturation-promoting factor may account for the progressive increase of apoptosis associated with acute HHV-7 infection of both primary CD4+ T lymphocytes and SupT1 cells.18
It has been recently demonstrated that aberrant expression of certain kinases associated with cell cycle control can lead to polyploidization,43,44 which is defined as the acquisition of elevated DNA content by a cell, regardless of the mechanism by which such changes in ploidy occur. Although the mechanisms by which cells achieve a polyploid DNA content are still largely unknown, polyploidization physiologically occurs during the maturation of megakaryocytes and also characterizes many virus-infected cells.36,45,46 In particular, polyploid cells observed during herpesvirus infections, also referred to as polykariocytes, are thought to be formed by the fusion of previously separate cells and, thus, represent syncytia.46 Electron microscopy studies have shown that cell fusion starts with the formation of small cytoplasmic bridges between adjacent cells at the points at which their plasma membranes are in direct apposition. Subsequent enlargement of these bridges leads to complete fusion of the cells.36Analysis of HHV-7–infected SupT1 cells (performed at various days p.i.) often showed apposition of the cell membranes of giant polyploid and small cells, consistent with the notion that cell membrane apposition represents the preferential route for cell-to-cell viral transmission. However, we failed to detect fusion events in extensive electron microscopy analysis. Although not conclusive, these findings render unlikely the possibility that giant polyploid cells observed in HHV-7–infected cultures are syncytia. The hypothesis that HHV-7–infected polyploid cells are formed by repeated karyokinesis without cytokinesis was also suggested by serial electron and confocal microscopy analyses, indicating that HHV-7–infected giant cells contain a single polylobated nucleus. A similar conclusion was obtained analyzing isolated nuclei obtained from HHV-7–infected and uninfected nuclei by flow cytometry. This implies that profound changes must occur during M-phase to prevent nuclear division.47 In this respect, the abnormalities of the maturation promoting factor observed in our study are similar to those reported by the Datta et al44 in the induction of megakaryocyte polyploidization.
A number of possibilities can be envisioned for the role that G2M accumulation and polyploidization play in HHV-7 replication. (1) By prolonging the time that a host cell spends in the activated state, the virus may maximize the output of progeny virus. The opinion most widely held is that the same number of gene copies is achieved through various polyploidization mechanisms as can be achieved through mitosis and cytokinesis. The advantage of endopolyploidy to HHV-7 might be that less time and energy is needed and that gene transcription can continue uninterrupted by mitosis and cell division.45 This interpretation agrees with the observation that high levels of polyploidy are often characteristic of glands and other cells which show intensive synthetic activity. (2) In addition to reentering G0, an activated T cell can undergo apoptosis and G2M accumulation may retard this event. (3) Cell-cycle arrest presents yet another advantage to the virus that is unrelated to increased virion production: cytotoxic T cells kill target cells by activation of cdc2, resulting in apoptosis. By preventing cdc2 activation, HHV-7 may render infected cells more resistant to cytotoxic T-cell activity. A similar function has been proposed for the vpr gene of human immunodeficiency virus–type 1 (HIV-1), which induces G2 arrest.39,48-51 Because cultures of HIV-1–infected cells arrested in G2 produced significantly more virus than those in G1 phase, the cytostatic function of vpr results in maximal virus production before the cell is eliminated by the host immune response.52
Although the majority of the experiments presented here were performed with the SupT1 lymphoid cell line, to facilitate detailed biochemical analysis, the inhibition of cellular proliferation coupled to cell cycle perturbations and polyploidization also in primary CD4+ T cells suggests a novel mechanism for potential HHV-7–induced immune disfunction.
ACKNOWLEDGMENT
The authors are very grateful to Prof G. Campadelli-Fiume for the HHV-7 MoAb 5E1.
Supported by the AIDS project of the Italian Ministry of Health.
Address reprint requests to Giorgio Zauli, MD, PhD, Institute of Human Anatomy, Via Fossato di Mortara 66, 44100 Ferrara, Italy.
The publication costs of this article were defrayed in part by page charge payment. This article must therefore be hereby marked “advertisement” in accordance with 18 U.S.C. section 1734 solely to indicate this fact.

This feature is available to Subscribers Only
Sign In or Create an Account Close Modal