Abstract
It has been shown that cytochrome c is released from mitochondria during apoptosis, activates pro-caspase CPP32 (caspase III), and induces DNA fragmentation in mixtures of cytosolic extracts and isolated nuclei. To establish whether cytochrome c can primarily induce apoptosis in intact cells, we used direct electroporation of cytochrome c into murine interleukin-3 (IL-3)–dependent cells. Electroporation of micromolar external concentrations of cytochrome c rapidly induced apoptosis (2 to 4 hours) that was concentration-dependent, did not affect mitochondrial transmembrane potential, and was independent of cell growth. Only certain isoforms of cytochrome c were apoptogenic; yeast cytochrome c and other redox proteins were inactive. Cytochrome c-induced apoptosis was dependent on heme attachment to the apo-enzyme and was completely abolished by caspase inhibitors. Nonapoptogenic isoforms of cytochrome c did not compete for apoptogenic cytochrome c. Although apoptosis induced by IL-3 withdrawal was inhibited by bcl-2 overexpression and expression of an activated MAP-kinase-kinase (MAP-KK), cytochrome c induced apoptosis in the presence of IL-3 signaling, bcl-2 over-expression, expression of activated MAP-KK, and the combined antiapoptotic action of all three. Cytochrome c also induced apoptosis in the leukemic cell line WEHI 3b. However, human HL60 and CEM cells were resistant to cytochrome c-induced apoptosis. HL60 cells did not electroporate, but CEM cells were efficiently electroporated. Our studies with IL-3–dependent cells confirm that the apoptogenic attributes of cytochrome c are identical in intact cells to those in cell extracts. We conclude that cytochrome c can be a prime initiator of apoptosis in intact growing cells and acts downstream of bcl-2 and mitochondria, but that other cells are resistant to its apoptogenic activity. The system described offers a novel, simple approach for investigating regulation of apoptosis by cytochrome c and provides a model linking growth factor signaling to metabolism, survival, and apoptosis control.
© 1998 by The American Society of Hematology.
APOPTOSIS IS EFFECTED by a family of cysteine proteases (caspases), represented by interleukin-1b converting enzyme (ICE). Death-inducing signaling complex (DISC) receptor proteins such as TNFr-I and Fas contain death domains (DD) that directly recruit the adaptor proteins TRADD or FADD/MORT-1, respectively, on ligand binding.1-4This recruitment initiates a cascade in which caspase pro-enzymes are activated by proteolysis, commencing with caspase 8, and leading, among others, to Poly-(ADP-Ribose) Polymerase (PARP) cleavage and nuclear DNA fragmentation.5,6 In cells in which DISC protein-ligand interactions are not primary inducers of apoptosis, activation of the apoptosis cascade has been linked to release of apoptogenic factors from mitochondria, one of which has been identified as cytochrome c.7,8 In the early phases of apoptosis, cytochrome c is released from mitochondria into the cytosol by a mechanism currently unknown but regulated by bcl-2 family proteins.9Thus, release of cytochrome c from mitochondria is inhibited by bcl-2, but is independent of changes in mitochondrial membrane potential, Δψm.10,11 In cell-free systems, cytochrome c binds to Apaf-1, a mammalian homologue ofCaehorhabditis elegans CED-4, which in the presence of dATP activates CPP32 (caspase III).10-12 Caspase III has been shown to activate a novel DNAse (Caspase-activated DNAse [CAD]) through cleavage of its inhibitor ICAD13; activated CAD induces apoptotic fragmentation in isolated nuclei. In cell-free systems, only heme-complexed, holocytochrome c activates CPP32, but its apoptogenic activity does not require its redox function.14Furthermore, not all cytochrome c isoforms are active; yeast cytochrome c, for example, is inactive.14 Therefore, although cytochrome c activates caspase III and thereby a specific nuclease in cell-free systems and is released during apoptosis induction in whole cells, whether cytochrome c can initiate apoptosis in intact cells and whether there are regulatory mechanisms governing its effects are important to determine.
We have previously shown that murine interleukin-3 (IL-3)–dependent cells are protected from rapid apoptosis induced by IL-3 withdrawal by bcl-2 overexpression,15-18 under which conditions they establish a prolonged state of metabolic arrest.19Apoptosis induced by IL-3 withdrawal is also not associated with changes in Δψm.19,20 IL-3–dependent cells are efficiently electroporated with reporter DNA and can express transfected genes rapidly after electroporation,21 showing that the cells remain intact and functional. We therefore used electroporation to introduce bovine cytochrome c into the IL-3–dependent pro-B–cell line, Bo,18 19 and other cells. We confirm that bovine holocytochrome c, but not bovine apo-cytochrome c or yeast holocytochrome c, induces caspase-dependent apoptosis in growing, intact cells and that its apoptogenic activity overrides powerful antiapoptotic signals mediated by IL-3, MAP-kinase-kinase (MAP-KK), bcl-2 expression, and leukemic change. However, whereas intact IL-3–dependent cells appear to be unable to suppress its apoptogenic action even under optimal growth conditions, other cells are resistant to its apoptogenic activity.
MATERIALS AND METHODS
Cell lines and reagents.
Bo and B15 cell lines18,22 were maintained in RPMI 1640/10% fetal calf serum (FCS), A2, and A1523 in Dulbecco’s modified Eagle’s medium (DMEM)/10% FCS (GIBCO-BRL, Paisley, Scotland). All were supplemented with 10% WEHI conditioned medium as a source of IL-3.24 WEHI 3b cells were cultured in RPMI/10%FCS. Bovine and yeast (Sacchromyces cerevisiae) cytochrome c (Sigma, Poole, Dorset, UK) were repurified by gel chromatography on Sephadex G50 followed by dialysis against phosphate-buffered saline (PBS). Biotinylated cytochrome c was prepared using sulfo-NHS-LC in kit form according to the manufacturers’ instructions (Pierce Inc, Rockford, IL) and purified by sephadex G50 chromatography. Apo-cytochrome c was prepared according to Fisher et al25 and further purified by sephadex G50 chromatography followed by extensive dialysis against 0.85% NaCl. z-D-dichlorobenzoyloxymethyketone (z-Ddcbmk) was obtained from Alexis Corp (San Diego, CA). z-VAD-fluoromethylketone (z-VADfmk) was obtained from Calbiochem-Nova Biochem (UK) Ltd (Nottingham, UK). Both were used at 25 to 100 μmol/L. Human hemoglobin, heme lactate dehydrogenase, and cytochrome bc1 complex were obtained from Sigma.
Electroporation.
Exponential-phase cells were washed in fresh medium and resuspended to 107/mL. Two hundred fifty microliters of cell suspension was placed in 4-mm cuvettes, proteins were added, and the mixture was held on ice 15 minutes. For IL-3–dependent cells, electroporation was performed at 240 V, 960 μF with a BioRad Genepulser (BioRad, Hercules, CA) and the cuvettes were held on ice for an additional 10 minutes.21Cells were washed once in fresh medium and recultured at 5 × 10⁵/mL with or without IL-3 (100 U/mL or as 10% WEHI conditioned medium) or inhibitors, as in the text. For other cell lines, electroporation parameters were established with fluorescein isothiocyanate (FITC)-labeled cytochrome c (see below). For controls, cells were electroporated with an equivalent amount with respect to protein of FCS. Protein concentrations were determined by BioRad Protein Assay Reagent (BioRad Ltd).
Flow cytometry and mitochondrial staining.
For DNA profiles, 1 mL samples were fixed in 70% methanol at 4°C overnight and stained with propidium iodide (PI; Coulter DNA Prep kit; Coulter Inc, Hialeah, FL). DNA fragmentation was measured using TUNEL assay kits according to the manufacturer’s instructions (Boehringer Mannheim Ltd, Lewes, East Sussex, UK). Flow cytometry was performed on a Coulter Elite flow cytometer. At least 10,000 cells were accumulated for analysis. Visible apoptosis was determined by counting using a Neubauer counting chamber under direct microscopy. At least 500 cells were counted.
For determining electroporation of cytochrome c, biotinylated cytochrome c (biotin:cytochrome c ratio 1.4:1) was first labeled with a molar equivalent (with regard to biotin) of streptavidin-FITC (SA-FITC; Sigma Ltd) and repurified using Sephadex G50. FITC-labeled cytochrome c (20 μg/mL) was mixed with 80 μg/mL unlabeled cytochrome for electroporation.
Mitochondria were stained with JC-1 (Molecular Probes Inc, Leiden, The Netherlands). JC-1 was kept as a stock solution in dimethyl sulfoxide (DMSO) at 20 mg/mL. A total of 105 cells/mL in complete medium were stained with 2 μg/mL JC-1 for 15 minutes at 37°C. The cells were then deposited on slides and viewed under direct fluorescence microscopy.
RESULTS
Cytochrome c induces apoptosis in intact cells.
Bo cells commence visible apoptosis and DNA fragmentation after 6 hours of IL-3 withdrawal and are 855 to 99% apoptotic after 24 hours, as determined by TUNEL assays, ladder gels, and flow cytometry using PI staining.19 20 We first estimated levels of external protein that might yield intracellular concentrations of cytochrome c similar to those inducing apoptosis in isolated nuclei in vitro (25 to 100 nmol/L10,11). Assuming an intracellular transfer of between 1% and 10% of the external protein, a concentration between 10 and 100 μg/mL of cytochrome c (0.7 to 7 μmol/L) would be within the optimal range. Bo cells were electroporated with bovine cytochrome c at concentrations between 0.5 and 100 μg/mL (0.35 to 7 μmol/L), recultured with or without IL-3, and apoptosis followed by microscopy and flow cytometric analysis of DNA. Before reculture, cytochrome c was removed by washing, ensuring that any effect was due only to electroporated protein. For flow cytometry, gates were set to record only events representing intact cells as determined by forward and side scatter; cell debris was excluded.
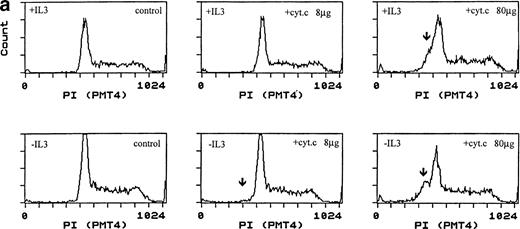
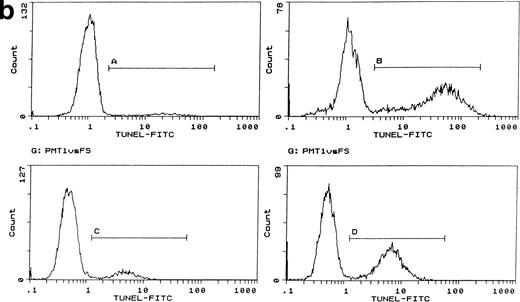
In control cultures, between 20% and 50% of cells lysed within 1 hour of electroporation. Lysed cells did not appear to contribute to DNA profiles and electroporation itself induced little or no apoptotic DNA fragmentation in the surviving cells with or without IL-3 (Fig 1a). However, this was variable and apoptosis ranged from undetectable to nearly 20% over 10 experiments with a mean value of 6.6% (SD ± 4.1); in most experiments, this value was less than 3%. Electroporation with cytochrome c between 10 and 100 μg/mL induced visible apoptosis within 2 hours. Early DNA fragmentation was detectable after 1 hour by PI staining. Correspondence of PI staining with DNA fragmentation was confirmed by flow cytometric TUNEL assays (Fig 1b). TUNEL staining and direct microscopy also confirmed the presence of apoptotic cells and that TUNEL-positive nuclear fragmentation was restricted to apoptosing cells; isolated TUNEL-positive nuclei were absent, excluding any contribution from stripped nuclei exposed to cytochrome c and cell contents released during electroporation. Apoptosis was dependent on the concentration of cytochrome c during electroporation (Fig 1a). The amount of residual cytochrome c in the medium postelectroporation after washing was calculated to be less than 500 fg/mL. Cytochrome c added directly to nonelectroporated cultured cells at concentrations up to 500 mg/mL had no effect (not shown). Consistently, cytochrome c induced apoptosis in cultures in which control cells showed none and increased it by a factor of at least 2 where controls showed some apoptosis after electroporation. To determine whether induced apoptosis was restricted to cells containing cytochrome c, we coelectroporated biotinylated cytochrome c with unlabeled cytochrome c. Flow cytometry showed that the proportion of FITC-labeled cells recultured for 1 hour after electroporation was similar to that undergoing apoptosis later on (Fig1c). Dual PI/cytochrome c-FITC labeling and flow sorting was unreliable due to loss of the FITC label and cell fragility during the first hour after electroporation. Similarly, cell fragility and loss of FITC fluorescence restricted the ability to determine accurately whether electroporated cytochrome c was confined to apoptosing cells after several hours. However, because controls without cytochrome c showed little induction of apoptosis and the proportion of FITC-labeled cells closely correlated with that undergoing apoptosis with cytochrome c (Fig 1c legend), the likelihood of apoptosis occurring in cells without electroporated cytochrome c could be effectively discounted. In all cytochrome c electroporated cultures, cells not apoptosing within the first 4 hours grew well with IL-3 over the next 24 hours, showing that they were unaffected by electroporation.
Induction of apoptosis by cytochrome c in Bo cells. (a) DNA analysis by flow cytometry. Cells were electroporated with bovine cytochrome c (Sigma Ltd) at different concentrations or control protein (FCS) and examined by flow cytomery after 4 hours of incubation. (Top row) With IL-3; (bottom row) without IL-3. Apoptosis is detectable at 8 μg/mL cytochrome c (middle panels) and is significant at 80 μg/mL (left panels, arrow). Apoptotic fractions (gate a, arrow) were as follows: with IL-3: control, <1%; 8 μg/mL, 2%; 80 μg/mL, 11%; without IL-3: control, <1%; 8 μg/mL, 5%; 80 μg/mL, 20%. (b) Apoptosis identified by TUNEL-labeling and flow cytometry. Intact cells were gated by forward- and side-scatter profiles. Fluorescence gates (A, B, C, and D) were then set for all positive events determined by Fluorospheres (Coulter Inc). The percentage of TUNEL-positive cells is in brackets. All cells were incubated with IL-3 and were electroporated with 80 μg/mL cytochrome c or equivalent amounts of FCS (control cells). (A and B) Bo cells examined by flow cytometry after 2 hours. (A) Controls (4%); (B) with cytochrome c (42%); (C and D) B15 cells after 4 hours of incubation. (C) Controls (11%); (D) with cytochrome c (36%). (c) Uptake of cytochrome c by electroporated cells. Bo cells were electroporated as described above with 80 μg/mL cytochrome mixed with 2 μg/mL biotinylated cytochrome c labeled with FITC-streptavidin. Cells were washed and recultured for 1 hour without IL-3 before flow cytometric analysis. (Left) Control cells electroporated with unlabeled cytochrome c; (right) with labeled cytochrome c. Twenty-four percent of cells were labeled. Twenty-seven percent of cells were apoptotic by direct microscopy at 2 hours. In 3 experiments, 31% ± 5.5% were labeled by FITC-cytochrome c and 36% ± 6% were apoptotic after 2 hours. Controls showed 2% ± 1.4% apoptotic cells.
Induction of apoptosis by cytochrome c in Bo cells. (a) DNA analysis by flow cytometry. Cells were electroporated with bovine cytochrome c (Sigma Ltd) at different concentrations or control protein (FCS) and examined by flow cytomery after 4 hours of incubation. (Top row) With IL-3; (bottom row) without IL-3. Apoptosis is detectable at 8 μg/mL cytochrome c (middle panels) and is significant at 80 μg/mL (left panels, arrow). Apoptotic fractions (gate a, arrow) were as follows: with IL-3: control, <1%; 8 μg/mL, 2%; 80 μg/mL, 11%; without IL-3: control, <1%; 8 μg/mL, 5%; 80 μg/mL, 20%. (b) Apoptosis identified by TUNEL-labeling and flow cytometry. Intact cells were gated by forward- and side-scatter profiles. Fluorescence gates (A, B, C, and D) were then set for all positive events determined by Fluorospheres (Coulter Inc). The percentage of TUNEL-positive cells is in brackets. All cells were incubated with IL-3 and were electroporated with 80 μg/mL cytochrome c or equivalent amounts of FCS (control cells). (A and B) Bo cells examined by flow cytometry after 2 hours. (A) Controls (4%); (B) with cytochrome c (42%); (C and D) B15 cells after 4 hours of incubation. (C) Controls (11%); (D) with cytochrome c (36%). (c) Uptake of cytochrome c by electroporated cells. Bo cells were electroporated as described above with 80 μg/mL cytochrome mixed with 2 μg/mL biotinylated cytochrome c labeled with FITC-streptavidin. Cells were washed and recultured for 1 hour without IL-3 before flow cytometric analysis. (Left) Control cells electroporated with unlabeled cytochrome c; (right) with labeled cytochrome c. Twenty-four percent of cells were labeled. Twenty-seven percent of cells were apoptotic by direct microscopy at 2 hours. In 3 experiments, 31% ± 5.5% were labeled by FITC-cytochrome c and 36% ± 6% were apoptotic after 2 hours. Controls showed 2% ± 1.4% apoptotic cells.
Characteristics of cytochrome c-induced apoptosis.
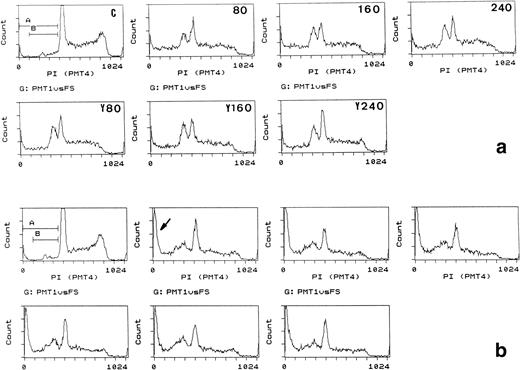
Cytochrome c-induced apoptosis occurred both in the presence and absence of IL-3, but the extent varied between different experiments (compare Figs 1 and 2), ranging from 10% to greater than 40% of cells by direct microscopy in more than 10 experiments. Time-course experiments showed that cytochrome c first induced a loss in the G2/M fraction accompanied by an increase in the post-G1 peak or G1 broadening, followed by appearance of pre-G1 staining typical of apoptotic DNA fragmentation (Fig 2). Subsequently, the pre-G1 peak became reduced but more extended, whereas the numbers of cells with small amounts of DNA increased (Fig 2b). This finding showed that cytochrome c first generated nuclear fragments that subsequently became smaller and more dispersed, characteristic of apoptosis. Increasing the amount of cytochrome c did not increase the apoptotic fraction above a plateau level reached at 80 μg/mL (Fig 2a); thus, only marginal increases were generated by increasing cytochrome c to 240 μg/mL.
Apoptosis induction in Bo cells: effects of time and increased cytochrome c concentrations and competition by yeast cytochrome c. (a) (Upper panels) Bo cells were electroporated with control protein (FCS, C) or bovine cytochrome c at 80, 160, or 240 μg/mL external concentration as indicated and recultured with IL-3. (Lower panels) Cells were coelectroporated with 80 μg/mL bovine cytochrome c and 80, 160, or 240 μg/mL yeast (Y) cytochrome c. PI staining and flow cytometric analysis was performed after 2 hours. Note the appearance of pre-G1 staining (gate B) coincident with loss of G2/M staining with cytochrome c and lack of competition by yeast cytochrome c. Pre-G1 fractions, gate B: control, 8%; 80 μg/mL cytochrome c, 38%; 160 and 240 μg/mL cytochrome c, 39%. Gate (A and B): less than 8% in all. (b) Same as for (a) analyzed after 4 hours. Apoptotic fractions increase with time, but not with increasing concentrations of cytochrome c. Note the increase in cells with low amounts of PI staining (gate A, arrow) and progressive loss in G2/M staining throughout all cultures; gate (A and B) increases from 6% in (a) at 80 μg/mL to 17% in (b).
Apoptosis induction in Bo cells: effects of time and increased cytochrome c concentrations and competition by yeast cytochrome c. (a) (Upper panels) Bo cells were electroporated with control protein (FCS, C) or bovine cytochrome c at 80, 160, or 240 μg/mL external concentration as indicated and recultured with IL-3. (Lower panels) Cells were coelectroporated with 80 μg/mL bovine cytochrome c and 80, 160, or 240 μg/mL yeast (Y) cytochrome c. PI staining and flow cytometric analysis was performed after 2 hours. Note the appearance of pre-G1 staining (gate B) coincident with loss of G2/M staining with cytochrome c and lack of competition by yeast cytochrome c. Pre-G1 fractions, gate B: control, 8%; 80 μg/mL cytochrome c, 38%; 160 and 240 μg/mL cytochrome c, 39%. Gate (A and B): less than 8% in all. (b) Same as for (a) analyzed after 4 hours. Apoptotic fractions increase with time, but not with increasing concentrations of cytochrome c. Note the increase in cells with low amounts of PI staining (gate A, arrow) and progressive loss in G2/M staining throughout all cultures; gate (A and B) increases from 6% in (a) at 80 μg/mL to 17% in (b).
DNA Fragmentation Induced by Cytochrome c in Growing and Quiescent Cells
| . | Pre-G1 . | G1 . | S . | G2/M . | ||||
|---|---|---|---|---|---|---|---|---|
| G . | Q . | G . | Q . | G . | Q . | G . | Q . | |
| Pre-electroporation | ||||||||
| A15 | <1 | 4 | 38 | 36 | 28 | 13 | 33 | 47 |
| B15 | <1 | <1 | 36 | 40 | 28 | 20 | 34 | 36 |
| T = 2 hours | ||||||||
| A15 | ||||||||
| Control | 2 | <1 | 31 | 58 | 29 | 5 | 21 | 28 |
| Cytochrome c | 23 | 5 | 29 | 68 | 28 | 6 | 12(57) | 14 (50) |
| B15 | ||||||||
| Control | 3 | 1 | 42 | 65 | 29 | 12 | 19 | 18 |
| Cytochrome c | 35 | 10 | 30 | 63 | 20 | 12 | 9 (47) | 12 (66) |
Figures are the percentage of total events; gates are set to include only whole cells (90% to 93% of total events). Figures in parentheses are percent reductions in G2/M with cytochrome c compared with controls. Similar values were obtained at 4 hours. Note that similar reductions in G2/M occurred in growing and quiesced cells with cytochrome c.
Abbreviations: G, growing; Q, quiescent.
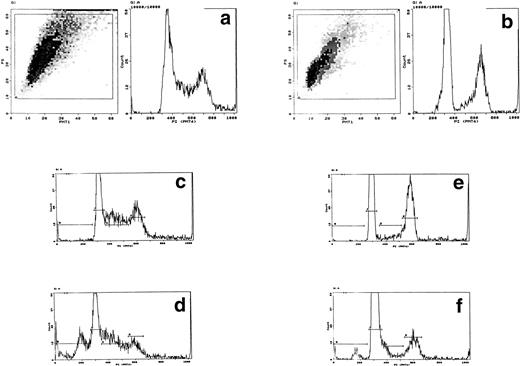
Finally, we wished to know whether cytochrome c-induced apoptosis depended on intact metabolism or DNA synthesis. B15 and A15 cells were therefore quiesced by incubation for 24 hours without IL-3. Under these circumstances, metabolism and DNA synthesis cease, whereas cells remain intact.19 The DNA profile of quiesced cells showed that they arrested throughout the cycle, although there was a tendency to arrest at G2 as previously reported for other IL-3–dependent cells (Table 1 and Fig 3).26 Quiesced cells were nevertheless induced to apoptose by cytochrome c within 2 hours, as demonstrated by typical pre-G1 DNA staining and visible apoptosis. Although comparison with control cells exposed continuously to IL-3 during the same period appeared to indicate that the apoptosis was less in the quiesced cells, two factors need to be taken into account. First, in actively growing cells, the DNA histogram is subject to ongoing cell cycle transitions. Second, DNA fragmentation and loss shifts fluorescence to a lower channel. Apoptotic DNA thus becomes integrated elsewhere into the histogram, for example, as a broadening or right-shifted shoulder to G1 as well as pre-G1 material.27 Loss in G2/M in quiesced DNA reflects the proportion of cells whose fluorescence is transferred to a lower channel without interference from cell cycle progression. When channel transfer was taken into account, and assuming random fragmentation, histograms from quiesced cultures indicated similar incidences of apoptosis as in growing cultures. This was supported by direct microscopy (Fig 3 legend).
Cytochrome induces apoptosis in metabolically quiescent cells. Forward/side-scatter plots (gate A) and DNA histograms of A15 cells quiesced for 24 hours without IL-3 then electroporated with bovine cytochrome c at 80 μg/mL. In growing cells, IL-3 was present throughout all manipulations. DNA analysis was performed after 2 hours. (a) Cells growing in IL-3. (b) Cells quiesced for 24 hours. (c) Growing cells electroporated with FCS. (d) Growing cells electroporated with 80 μg/mL bovine cytochrome c. (e) Quiesced cells electroporated with FCS. (f) Quiesced cells electroporated with 80 μg/mL cytochrome c. Gates B through E set for pre-G1, G1, S, and G2/M. The left shift in (b) is due to cell contraction. Note the pre-G1 apoptotic DNA, broadening of G1 with right shoulder in quiesced cells, and reduction in G2/M in cells electroporated with cytochrome c. Apoptosis induced by cytochrome c by direct microscopy was as follows: growing, 51%; quiesced, 43%. Controls showed less than 3% apoptosis.
Cytochrome induces apoptosis in metabolically quiescent cells. Forward/side-scatter plots (gate A) and DNA histograms of A15 cells quiesced for 24 hours without IL-3 then electroporated with bovine cytochrome c at 80 μg/mL. In growing cells, IL-3 was present throughout all manipulations. DNA analysis was performed after 2 hours. (a) Cells growing in IL-3. (b) Cells quiesced for 24 hours. (c) Growing cells electroporated with FCS. (d) Growing cells electroporated with 80 μg/mL bovine cytochrome c. (e) Quiesced cells electroporated with FCS. (f) Quiesced cells electroporated with 80 μg/mL cytochrome c. Gates B through E set for pre-G1, G1, S, and G2/M. The left shift in (b) is due to cell contraction. Note the pre-G1 apoptotic DNA, broadening of G1 with right shoulder in quiesced cells, and reduction in G2/M in cells electroporated with cytochrome c. Apoptosis induced by cytochrome c by direct microscopy was as follows: growing, 51%; quiesced, 43%. Controls showed less than 3% apoptosis.
Altogether, these experiments indicate that only a certain proportion of cells are electroporated and apoptose, that this fraction cannot be increased by increasing the concentration of cytochrome c, and that induction is not dependent on active metabolism. Thus, the proportion of cells induced to apoptose in different experiments depended on the fraction successfully electroporated with cytochrome c.
Other heme proteins and isoforms of cytochrome c do not induce apoptosis.
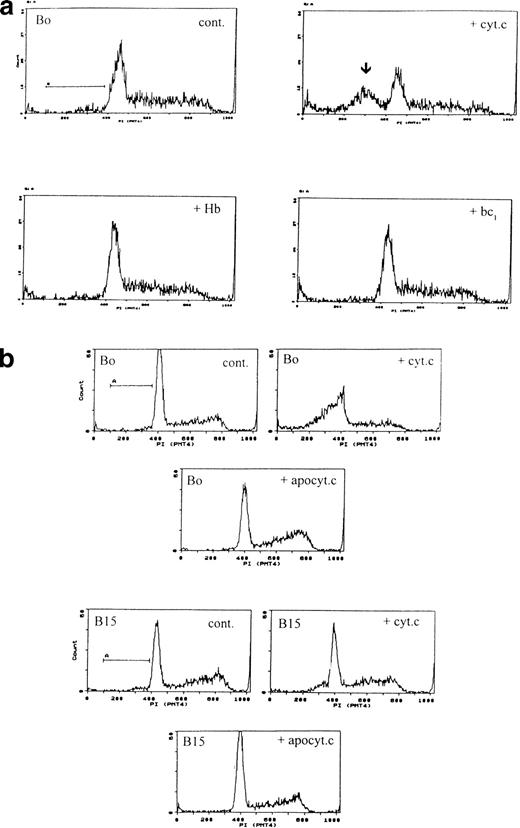
Although in the cell-free system the redox function of cytochrome c does not seem necessary, this may not be so in intact cells. We therefore electroporated cells with hemoglobin, heme lactate dehydrogenase, and cytochrome bc1-heme complex. None induced apoptosis (Fig 4a). Because also in the in vitro system only holo-cytochrome c is effective in activating CPP32 and inducing DNA fragmentation, we prepared heme-depleted bovine apo-cytochrome c by published methods25 from the same batch of cytochrome c and electroporated it into cells at the same apoptogenic concentration as the holo-cytochrome c. Apo-cytochrome c did not induce apoptosis (Fig 4b). Finally, to show that intact cells responded similarly as cell-free systems with respect to cytochrome c isoforms, we electroporated cells with yeast cytochrome c. In agreement with the cell-free studies, all concentrations of yeast cytochrome c (up to 320 μmol/L) were inactive in inducing apoptosis (not shown).
Specificity of apoptosis for cytochrome c. (a) Other redox proteins do not induce apoptosis. Bo cells were electroporated with cytochrome c (80 μg/mL), human hemoglobin, or cytochrome bc1 complex at molar equivalents to cytochrome c. Only cytochrome c induces apoptosis. Pre-G1 apoptotic fractions: control, 5%; + cyt c, 31%; + Hb, 4.8%; + bc1 4.4%. (b) Only holo-but not apo-cytochrome c induces apoptosis. Bo (upper 3 panels) and B15 cells (lower 3 panels) were electroporated with 80 μg/mL of holo- or apo-cytochrome as in Fig 1 and recultured with IL-3 and samples were analyzed by flow cytometry after 3 hours. Pre-G1 apoptotic fractions were as follows: Bo: control <1%; with holocytochrome c 37%; with apocytochrome c <1%. B15: control 5%; with holocytochrome c 11%; with apocytochrome c 2%. Similar results were recorded for A2 and A15 cells (not shown).
Specificity of apoptosis for cytochrome c. (a) Other redox proteins do not induce apoptosis. Bo cells were electroporated with cytochrome c (80 μg/mL), human hemoglobin, or cytochrome bc1 complex at molar equivalents to cytochrome c. Only cytochrome c induces apoptosis. Pre-G1 apoptotic fractions: control, 5%; + cyt c, 31%; + Hb, 4.8%; + bc1 4.4%. (b) Only holo-but not apo-cytochrome c induces apoptosis. Bo (upper 3 panels) and B15 cells (lower 3 panels) were electroporated with 80 μg/mL of holo- or apo-cytochrome as in Fig 1 and recultured with IL-3 and samples were analyzed by flow cytometry after 3 hours. Pre-G1 apoptotic fractions were as follows: Bo: control <1%; with holocytochrome c 37%; with apocytochrome c <1%. B15: control 5%; with holocytochrome c 11%; with apocytochrome c 2%. Similar results were recorded for A2 and A15 cells (not shown).
Nonapoptogenic forms of cytochrome c do not compete for apoptogenic cytochrome c.
It is possible that nonapoptogenic forms of cytochrome c interact with the same substrates for apoptosis induction but are inactive. If so, inactive forms might be expected to compete for apoptogenic cytochrome c. Inactive apo-cytochrome c or yeast cytochrome c was therefore coelectroporated into cells with bovine cytochrome c in various ratios and apoptosis followed (Fig 2a and b, lower panels). Even at a threefold excess, inactive yeast or apo-cytochrome c showed no ability to reduce the apoptogenic activity of bovine cytochrome c, suggesting that the target for cytochrome c interaction is highly specific and not competed for by other cytochrome c isoforms.
Cytochrome c-induced apoptosis is not related to changes in mitochondrial transmembrane potential (Δψm).
To determine if cytochrome c-induced apoptosis was related to loss in mitochondrial membrane potential, we stained cells with JC-1. JC-1 is concentrated in mitochondria. Monomeric JC-1 fluoresces green, but changes to orange on the formation of J-aggregates by membrane polarisation.28 This color change is thus a useful indicator of Δψm. By direct fluorescence microscopy, JC-1 stained mitochondria orange in all cells and there was no difference between control and cytochrome c electroporated cells (not shown). Thus, neither cytochrome c itself nor electroporation affected mitochondrial transmembrane potential. This is in keeping with cell-free studies in which changes in Δψm are not required for mitochondrial cytochrome c release and in which apoptosis from IL-3 withdrawal is not associated with changes in Δψm.20
Cytochrome c induction is dominant over apoptosis suppression.
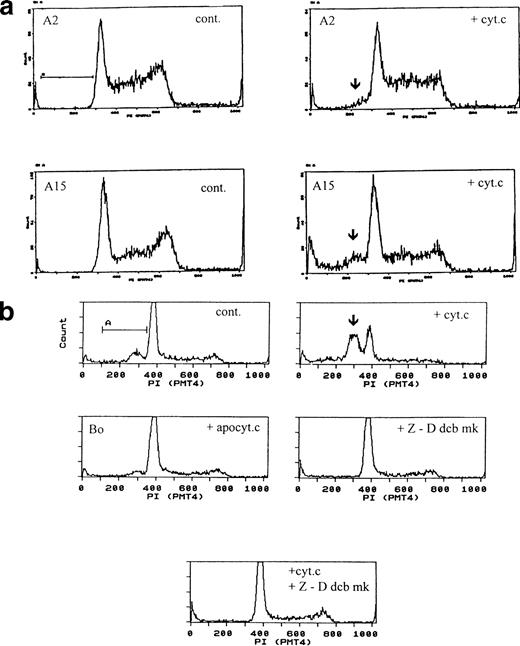
The fact that the apoptogenic activity of cytochrome c appeared to override apoptosis suppression normally provided by IL-3 signaling led us to examine whether it would similarly override other apoptosis suppressors. We therefore examined its effect in a series of Bo-derived transfectants expressing anti-apoptotic genes. B15 cells express human bcl-2 and survive in the absence of IL-3 for at least 24 hours.19,22 A2 cells express a constitutively activated MAP-KK gene, which has been shown to reduce requirement for IL-3 and significantly prolong survival in the absence of IL-3; A15 cells are doubly transfected with activated MAP-KK and bcl-2 and have further extended survival.23 In our hands, A2 cells fully survived 1 to 2 days and A15 cells fully survived for at least 4 days without IL-3. In all of these cell lines, electroporated cytochrome c induced apoptosis with similar frequency and time frame as in Bo cells (Table 2). Only bovine holo-cytochrome c was effective, apo- and yeast cytochrome c were ineffective (Fig 5a and data not shown).
Comparison of Cytochrome c-Induced Apoptosis in Bo, B15, and A15 Cells
| Cell Line . | Control* . | Cytochrome c-Induced† . | n . |
|---|---|---|---|
| Bo | 6 (4.6) | 40 (6.1) | 12 |
| B15 | 4.8 (4.4) | 35 (7) | 8 |
| A15 | 3.6 (4.1) | 36 (7.5) | 6 |
| Cell Line . | Control* . | Cytochrome c-Induced† . | n . |
|---|---|---|---|
| Bo | 6 (4.6) | 40 (6.1) | 12 |
| B15 | 4.8 (4.4) | 35 (7) | 8 |
| A15 | 3.6 (4.1) | 36 (7.5) | 6 |
Cells were enumerated by direct microscopy. Figures are for the mean percentage of apoptotic cells ± 1 SD.
Abbreviation: n, number of experiments.
Electroporated with 80 μg/mL FCS protein.
Electroporated with 80 μg/mL bovine cytochrome c.
Cytochrome c-induced apoptosis is dominant to bcl-2 and activated MAP-KK survival signals and is mediated by caspases. (a) Cytochrome c overrides IL-3, bcl-2, and activated MAP-KK. A2 cells (upper panels) expressing activated MAP-KK and A15 cells (lower panels) coexpressing activated MAP-KK and bcl-2 were electroporated with control protein (left) or bovine cytochrome c at 80 μg/mL (right) and recultured with IL-3. Pre-G1 apoptotic fractions were as follows: A2: control <1%; with cytochrome c 6%; A15: control <1%; with cytochrome c 16%. Apoptotic fractions by direct microscopy are given in Table 2. (b) Cytochrome c-induced apoptosis is dependent on caspases. Bo cells were electroporated with 80 μg/mL apo- or holo-cytochrome c as for Fig 1 and recultured with IL-3, with or without z-Ddcbmk at 50 μg/mL (100 μmol/L). Cells were analyzed after 3 hours. Pre-G1apoptotic fractions were as follows: control cells, 16%; with holo-cytochrome c, 45%; with apo-cytochrome c, 9%; with z-Ddcbmk only, 7%; with holo-cytochrome c and z-Ddcbmk, 4%. z-Ddcmbk abolishes cytochrome c-induced DNA fragmentation. Similar results were obtained with B15, A2, and A15 cells and z-VADfmk (data not shown).
Cytochrome c-induced apoptosis is dominant to bcl-2 and activated MAP-KK survival signals and is mediated by caspases. (a) Cytochrome c overrides IL-3, bcl-2, and activated MAP-KK. A2 cells (upper panels) expressing activated MAP-KK and A15 cells (lower panels) coexpressing activated MAP-KK and bcl-2 were electroporated with control protein (left) or bovine cytochrome c at 80 μg/mL (right) and recultured with IL-3. Pre-G1 apoptotic fractions were as follows: A2: control <1%; with cytochrome c 6%; A15: control <1%; with cytochrome c 16%. Apoptotic fractions by direct microscopy are given in Table 2. (b) Cytochrome c-induced apoptosis is dependent on caspases. Bo cells were electroporated with 80 μg/mL apo- or holo-cytochrome c as for Fig 1 and recultured with IL-3, with or without z-Ddcbmk at 50 μg/mL (100 μmol/L). Cells were analyzed after 3 hours. Pre-G1apoptotic fractions were as follows: control cells, 16%; with holo-cytochrome c, 45%; with apo-cytochrome c, 9%; with z-Ddcbmk only, 7%; with holo-cytochrome c and z-Ddcbmk, 4%. z-Ddcmbk abolishes cytochrome c-induced DNA fragmentation. Similar results were obtained with B15, A2, and A15 cells and z-VADfmk (data not shown).
Cytochrome c induction is dependent on caspase activity.
In the cell-free system, cytochrome c activates the caspase CPP32. We therefore investigated whether cytochrome c-induced apoptosis in intact cells was similarly dependent on caspase activation using the caspase inhibitors z-D-dcbmk and z-VADfmk.29Cells were electroporated with cytochrome c and recultured with or without zDdcbmk or zVADfmk. Both completely inhibited cytochrome c-induced DNA fragmentation in all cells examined (Fig 5b) and abolished visible apoptosis. Caspase inhibitors also reversed the decrease in S-phase fraction seen in cytochrome c-induced cultures, reflecting inhibition of the G2/M to S channel shift generated during apoptosis. One unexpected result we found was that both caspase inhibitors completely abolished Δψm, even though apoptosis was prevented; thus, cells stained with JC-1 showed entirely green mitochondrial fluorescence.
Cytochrome c induces apoptosis in some leukemic cells but not in others.
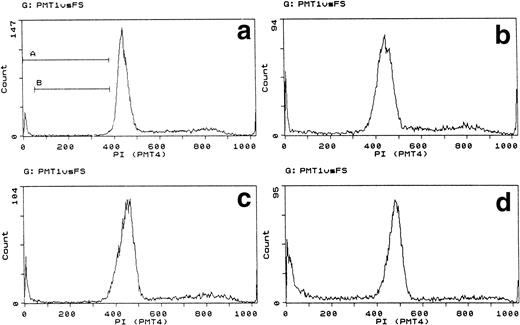
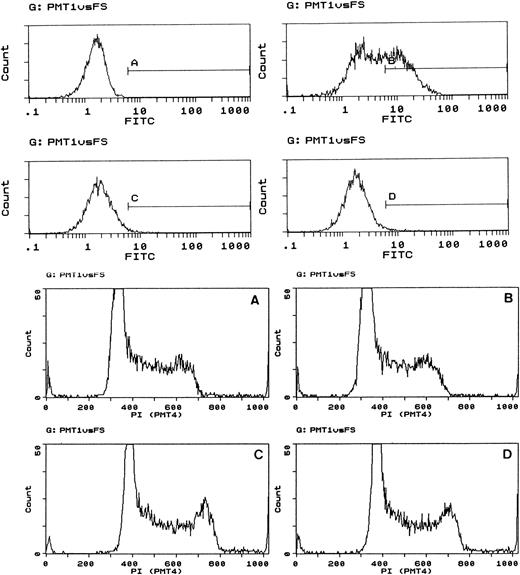
Because of the dominance of cytochrome c-induced apoptosis over strong antiapoptotic signaling, we investigated whether malignant change would create resistance to it, using the myelo-monocytic cell line WEHI 3b. This line is aggressively leukemic in mice, inducing fatal leukemias within 2 to 3 weeks from as little as 100 cells. WEHI 3b cells were as susceptible to cytochrome c-induced apoptosis as IL-3–dependent cells (Fig 6). To test whether this result was applicable to other leukemia cells, we electroporated human erythroleukemia HL60 and the human lymphoma cell lines CCRF-CEM and CCRF-CEM/VLB100 with cytochrome c.30 CCRF-CEM is relatively resistant to tumor necrosis factor (TNF), whereas CEM/VLB100 is much more sensitive; however, both commence to apoptose 6 hours after exposure to TNF.30 For each cell line, conditions for maximum electroporation were established using FITC-SA-biotin-cytochrome c (Fig 7). HL60 cells were resistant to electroporation under all conditions and concentrations of bovine cytochrome c up to 320 μg/mL and did not apoptose. Conditions for successful electroporation CCRF-CEM and CCRF-CEM/VLB100 cells were quite stringent (Fig 7); only 240 to 300 V and 960 μF were effective in introducing cytochrome c into the cells. However, they were completely resistant to cytochrome c-induced apoptosis (Fig 7). No apoptosis was induced at any concentration of cytochrome c over 4 experiments by DNA analysis or direct microscopy. Thus, in some malignant cells, cytochrome c activation of apoptosis is blocked, whereas in others cytochrome c is a dominant lethal hit.
Induction of apoptosis in WEHI 3b leukemic cells by cytochrome c. Cells were analyzed by flow cytometry 2 hours (a and b) and 4 hours (c and d) after electroporation with bovine cytochrome c. The percentages of apoptotic fraction (gate A) were as follows: (a) control (6%); (b) with cytochrome c (12%); (c) control (8%); with cytochrome c (28%). Note the progressive increase in apoptotic fraction and loss in G2/M with cytochrome c.
Induction of apoptosis in WEHI 3b leukemic cells by cytochrome c. Cells were analyzed by flow cytometry 2 hours (a and b) and 4 hours (c and d) after electroporation with bovine cytochrome c. The percentages of apoptotic fraction (gate A) were as follows: (a) control (6%); (b) with cytochrome c (12%); (c) control (8%); with cytochrome c (28%). Note the progressive increase in apoptotic fraction and loss in G2/M with cytochrome c.
Response of CEM cells to electroporated cytochrome c. (Upper panel) CEM cells were coelectroporated with 80 μg/mL cytochrome c and 8 μg/mL cytochrome c-biotin-streptavidin-FITC as described in the text, using different electroporation conditions. Gates were set using Coulter fluorospheres. Cells were analyzed 1 hour after electroporation. (A) Control cells (exposed to labeled cytochrome c without electroporation); (B) 240 V, 960 μF; (C) 240 V, 500 μF; (D) 240 V, 250 μF. In (B), 43% of gated cells were FITC-positive. Note that successful electroporation was achieved only with 240 V and 960 μF. (Lower panel) DNA analysis of cultures A through D 2 hours after electroporation. Similar DNA profiles were obtained after 4, 6, and 24 hours. Note the absence of apoptosis induction by cytochrome c.
Response of CEM cells to electroporated cytochrome c. (Upper panel) CEM cells were coelectroporated with 80 μg/mL cytochrome c and 8 μg/mL cytochrome c-biotin-streptavidin-FITC as described in the text, using different electroporation conditions. Gates were set using Coulter fluorospheres. Cells were analyzed 1 hour after electroporation. (A) Control cells (exposed to labeled cytochrome c without electroporation); (B) 240 V, 960 μF; (C) 240 V, 500 μF; (D) 240 V, 250 μF. In (B), 43% of gated cells were FITC-positive. Note that successful electroporation was achieved only with 240 V and 960 μF. (Lower panel) DNA analysis of cultures A through D 2 hours after electroporation. Similar DNA profiles were obtained after 4, 6, and 24 hours. Note the absence of apoptosis induction by cytochrome c.
DISCUSSION
Our study confirms that cytochrome c induces apoptosis in intact cells as in cell-free systems and that it (or activated caspases) overrides the antiapoptotic action of strong growth and survival signals such as IL-3, bcl-2, MAP-KK, and malignancy. Because bcl-2 inhibits release of mitochondrial cytochrome c10,11 and the cells overexpressing bcl-2 here are equally sensitive to cytochrome c-induced apoptosis and caspase inhibitors, we surmise that in these cells exogenous cytochrome c also acts downstream of mitochondrial bcl-2. However, in other cells, bcl-2 does not block Fas-induced caspase activation but can still inhibit reduction in mitochondrial Δψm and apoptosis.31 These findings are rationalized if caspases can operate both upstream (inducing release of cytochrome c and changes in Δψm) and downstream of bcl-2’s mitochondrial action. Introduced cytochrome c would thus bypass the bcl-2–sensitive mitochondrial release mechanism but could still operate through downstream caspases such as caspase III and VI (Mch-2),32 which are the major ones involved in effecting apoptosis.32 It is unlikely that in our study internal cell disruption from electroporation itself is responsible for the cytochrome c effect: electroporation did not induce significant apoptosis in control cells; no other similar proteins induced it, including the same apo-protein; the fraction of cytochrome c-electroporated cells was similar to that undergoing apoptosis; and nonapoptosing cells grew well. Any such disruption would therefore have to be very specific for the cytochrome c-induced pathway of caspase activation. We also found no evidence that electroporated cytochrome c changed Δψm, excluding that it induced secondary release of factors dependent on Δψm for release. This agrees with other studies19 20 showing that apoptosis induced by IL-3 withdrawal is not associated with changes in mitochondrial membrane potential.
The results with CEM and CEM/VLB100 cells suggest that certain cells have intrinsic resistance to cytochrome c-induced apoptosis. Recently, Li et al33 reported on micro-injection of cytochrome c into MCF-7 cells. MCF-7 cells were resistant to cytochrome c induction but were susceptible to both TNF and anti-FAS–induced apoptosis. Although in MCF-7 cells resistance to cytochrome c was due to lack of pro-caspase III, CEM cells are not defective in active caspases III and VI (Mch2) when induced by etoposide.29 However, in MCF-7 cells, induction of apoptosis by both TNF/FAS and micro-injected cytochrome c was inhibited by Bcl-XL, which in other cells prevents both cytochrome c release and reductions in mitochondrial transmembrane potential.34 Similarly, Rosse et al35 report that, although Bcl-2 does not block bax-induced cytochrome c release, it can still inhibit caspase activation and apoptosis. These suggest that Bcl-2–type proteins can also inhibit apoptosis downstream of cytochrome c release. Our observations with CEM cells are also fully consistent with these studies. In contrast, overexpressed bcl-2 is apparently unable to exert any antiapoptotic effect downstream of cytochrome c in IL-3–dependent cells. Possibly, these disparate results could be related to intracellular concentrations of cytochrome c and bcl-2 in the different experiments. Cytochrome c-activated apoptosis therefore appears to be modulated at several different points in the cascade. The reason for resistance of CEM cells to cytochrome c induction is important to determine and is currently under investigation.
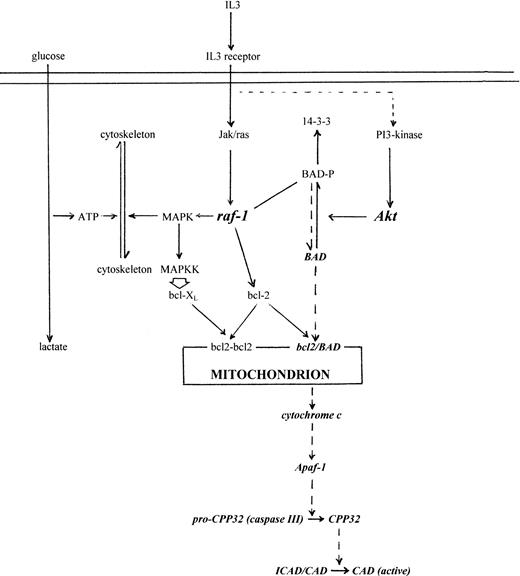
Although changes in Δψm and generation of permeability transition pores (PTP) have been implicated in apoptosis,36,37 they are not invariant19,20,38and cell-free studies show that cytochrome c release is independent of Δψm.11 Are there any special features of cytochrome c that might explain its particular egress from mitochondria? Apo-cytochrome c contains an internal targeting sequence39 and is transported into the mitochondrion by mechanisms that, unlike most mitochondrial imported proteins, are independent of Δψm, ATP, TIM/TOM transporters, and proteolytic cleavage of a targeting peptide.40-44 It is thought that transport across the outer membrane, to which it is relatively permeable, and retention within the intermembrane space are driven by heme attachment through heme lyase. The subsequent conformational change from extended to globular form renders it impermeable to the outer membrane.45,46 Because a significant proportion of cytochrome c appears to be free within the intermembrane space,47 its release would depend on the integrity of the outer membrane, with which bcl-2 family proteins are associated.48,49 Δψm and PTP, which affect the inner membrane,50 may therefore not be directly relevant to cytochrome c release. The formation of megachannels across both membranes is possible but still conjectural. However, bcl-2-type proteins have structural motifs suggestive of membrane pore-forming ability51 and at least one member, Bax, can form pores in liposomes.52 Bcl-2 is known to associate with other mitochondrial membrane proteins, eg, carnitine palmitoyltransferase, and to both interact with and direct kinases (eg, Raf) to the outer mitochondrial membrane.53 54 Regulation of cytochrome c release through phosphorylation of outer membrane proteins, eg, BAD, has provided a possible mechanism linked directly to IL-3 signaling without necessarily involving Δψm(Fig 8 and references therein). The precise mechanism of cytochrome c release is currently the focus of much investigation.
Schematic model linking IL-3 regulation of metabolism with apoptosis and cytochrome c release. IL-3 signaling activates multiple pathways, but includes activation of JAK-type kinases, STAT transcription factors, Ras, Raf, MAP-K, and Akt.55-62 MAP-K activation and increase in cytoskeletal assembly/remodelling during growth creates an ATP demand and therefore an increase in glycolysis (left side, solid lines). Simultaneously, Raf targeted to the mitochondria by bcl-2, and/or Akt, phosphorylates BAD55 that sequesters it to cytoplasmic 14-3-3 protein56 (right side, solid lines). Withdrawal of IL-3 leads to reduced Raf, Akt, and MAP-K activity, loss in cytoskeletal assembly, decline in ATP demand,19 and downregulated glycolysis. Coincidentally, unphosphorylated BAD is redirected to heterodimerise with mitochondrial bcl-2/bcl-XL, which releases cytochrome c irrespective of ▵ψm, activates caspase III (CPP32), and CAD. Exogenous cytochrome c bypasses IL-3 signaling and directly activates caspase III. Although activation of MAP kinases in the MAP-KK A12 and A15 overexpression mutants has been difficult to demonstrate,24 overexpressed activated MAP-KK upregulates Bcl-XL (M. Collins, personal communication, 1998). This would explain why A2 and A15 cells have increased survival on IL-3 withdrawal but are still induced by exogenous cytochrome c.
Schematic model linking IL-3 regulation of metabolism with apoptosis and cytochrome c release. IL-3 signaling activates multiple pathways, but includes activation of JAK-type kinases, STAT transcription factors, Ras, Raf, MAP-K, and Akt.55-62 MAP-K activation and increase in cytoskeletal assembly/remodelling during growth creates an ATP demand and therefore an increase in glycolysis (left side, solid lines). Simultaneously, Raf targeted to the mitochondria by bcl-2, and/or Akt, phosphorylates BAD55 that sequesters it to cytoplasmic 14-3-3 protein56 (right side, solid lines). Withdrawal of IL-3 leads to reduced Raf, Akt, and MAP-K activity, loss in cytoskeletal assembly, decline in ATP demand,19 and downregulated glycolysis. Coincidentally, unphosphorylated BAD is redirected to heterodimerise with mitochondrial bcl-2/bcl-XL, which releases cytochrome c irrespective of ▵ψm, activates caspase III (CPP32), and CAD. Exogenous cytochrome c bypasses IL-3 signaling and directly activates caspase III. Although activation of MAP kinases in the MAP-KK A12 and A15 overexpression mutants has been difficult to demonstrate,24 overexpressed activated MAP-KK upregulates Bcl-XL (M. Collins, personal communication, 1998). This would explain why A2 and A15 cells have increased survival on IL-3 withdrawal but are still induced by exogenous cytochrome c.
In summary, we have found that cytochrome c can induce caspase-dependent apoptosis in intact cells. Induction is not antagonized by nonapoptogenic forms of cytochrome c and is dominant over a variety of strongly antiapoptotic growth and survival signals, including malignancy. However, other cells are resistant to cytochrome c-induced apoptosis for reasons yet to be determined. Our study demonstrates that all the attributes of cytochrome c in apoptosis induction identified in cell free studies can be displayed in intact cells. The system described here provides a simple, rapid, and reproducible model for investigating potential inhibitors and inducers of cytochrome c-dependent apoptosis without the need for micro-injection or extensive in vitro purification of cell extracts and mitochondria. Whereas electroporation needs careful controls and may not be appropriate to all cells, the model described here may help understand how intact cells regulate the cytochrome c-dependent pathway of apoptosis induction.
ACKNOWLEDGMENT
The authors thank Dr Mary Collins (Institute for Cancer Research, London, UK) for supplying the A2 and A15 cell lines and Dr Li Jia (The Royal London Hospital, London, UK) for providing and for assistance with CEM cells.
Supported by the Northcott Devon Medical Foundation, the Exeter Leukaemia Fund, and The Paul Janssen Research Foundation. J.M.G. is supported by the Northcott Devon Medical Foundation. C.R. is a Fellow of the Exeter Leukaemia Fund.
Address reprint requests to John M. Garland, PhD, the Burnham Institute, 10901 North Torrey Pines Rd, La Jolla, CA 92307.
The publication costs of this article were defrayed in part by page charge payment. This article must therefore be hereby marked "advertisement" is accordance with 18 U.S.C. section 1734 solely to indicate this fact.


This feature is available to Subscribers Only
Sign In or Create an Account Close Modal