The function of bone marrow (BM) stromal thrombopoietin (TPO) in megakaryopoiesis remains unknown. In the present study we attempted to clarify the pathophysiological implications of stromal TPO in normal subjects (NS) and in patients with idiopathic thrombocytopenic purpura (ITP), aplastic anemia (AA), and essential thrombocythemia (ET) by measuring TPO concentrations in BM and peripheral blood (PB) and by estimating the levels of stromal TPO mRNA with TaqMan fluorescence-based post–reverse transcription-polymerase chain reaction product detection system. The results showed that TPO concentrations in PB were significantly elevated in patients with ITP (34.9 ± 11.7 pg/mL) and AA (364.1 ± 153.5 pg/mL) but within normal range in patients with ET (each 20.0 and 22.1; NS, 22.1 ± 8.2 pg/mL). In all subjects, the TPO concentrations in BM correlated well with the PB levels, and the former were consistently higher than the latter. The concentrations of TPO in BM also correlated with the levels of TPO mRNA in stromal cells. Furthermore, expression levels of TPO mRNA clearly correlated with megakaryocyte counts in NS and patients with ITP, indicating that stromal TPO actually enhances megakaryopoiesis. Thus, our results in the present study indicate that TPO from BM stromal cells is considered to play an essential role for megakaryopoiesis under various patho-physiological conditions.
SINCE THE INTRODUCTION of genetic cloning of thrombopoietin (TPO), many studies have helped to clarify its function in megakaryocyte-colony stimulation and megakaryopotentiation.1-6 However, it is still not clear which organs synthesize the TPO needed for megakaryopoiesis in bone marrow (BM) and the mechanisms that regulate TPO production. Although TPO is synthesized in liver, kidney, spleen, and lung,1 the levels of TPO mRNA expression in these tissues do not vary in accordance with circulating TPO concentrations or platelet numbers.7
Kuter and Rosenberg8 have proposed that the concentration of TPO is passively regulated by its binding to TPO receptors on platelets (sponge theory); this is based on the finding that, in rabbits, circulating TPO increases with busulfan administration and decreases after platelet transfusion.
Recently, BM has been implicated in the production of TPO for megakaryopoiesis. McCarty et al9 have shown that giving mice antibodies to platelets results in increased TPO mRNA expression in BM although they have not focused their interest particularly on stromal cells. Although these are preliminary results, we have reported that TPO from BM stromal cells play an important role for megakaryopoiesis in normal subjects (NS) and patients with idiopathic thrombocytopenic purpura (ITP).10 By using in situ hybridization, Sungaran et al11 also showed an increase in TPO mRNA expression in stromal cells from patients with aplastic anemia (AA) and ITP, although, as they themselves pointed out, more quantitative analysis is needed to conclusively signify their finding. More recently, Guerriero et al12 confirmed ubiquitous expression of TPO mRNA in stromal cultures initiated by either CD34+ or CD34− BM cells in vitro.
In the present investigation we aimed to show that TPO in BM which defines megakaryopoiesis under various pathophysiological conditions is mainly derived from BM stromal cells by using enzyme-linked immunosorbent assay (ELISA) for measurement of TPO protein and TaqMan reverse transcription-polymerase chain reaction (RT-PCR) for semi-quantitation of TPO mRNA.13
MATERIALS AND METHODS
BM sample selection and preparation.
BM cells were obtained from 1-mL aliquots of BM obtained from 6 normal volunteers, 6 patients with ITP, 6 patients with AA, and 2 patients with essential thrombocythemia (ET) at the 4th Department of Internal Medicine Sapporo Medical University, after informed consent had been obtained. BM cells were then separated over Ficoll-Isopaque (Pharmacia Biotech, Uppsala, Sweden) (1.077 g/mL, 400g; 20 minutes, 20°C), and the interface was harvested and washed three times in RPMI 1640 medium. The mononuclear cells (5 × 10⁵/mL) were plated in 25-cm2 tissue-culture flasks (Corning Glass Works, Corning, NY) in 10 mL of α-minimum essential medium (α-MEM; Hazleton, Denver, CO) supplemented with 12.5% fetal calf serum (Whitakker, Walkersville, MD), 12.5% horse serum (Whitakker), and 1.0 × 10⁻⁶ mol/L hydrocortisone (Upjohn, Irving, TX). Cultures were maintained at 37°C in humidified chamber with 5% CO2 in air: the medium was replaced weekly.14 After 4 weeks of culture, the yield was usually 1 × 10⁵ stromal cells/mL of BM.
Oligonucleotides for TaqMan PCR assay.
Table 1 shows the nucleotides sequences from the oligonucleotide hybridization probes and primers used. These were obtained from Applied Biosystems, A Division of Perkin Elmer (Foster City, CA). The forward primer (P1) of TPO was designed to span an exon 4/intron junction to avoid amplification of DNA sequences, whereas the reverse TPO primer (P2) was complimentary to the exon 6. The TPO target probe (Pr A) was labeled at the 5′ end with the reporter dye molecule, FAM (6-carboxyfluorescein; emission l 538 nm). The GAPDH target probe (Pr B) as the internal control was labeled with JOE (6-carboxy-4,5-dichloro-2,7-dimethoxyfluorescein; emission l 546 nm). Both probes were labeled with the quencher fluor TAMRA (6-carboxytetramethylrodamine; emission l 582 nm) at the 3′ end via a linker arm nucleotide (LAN) followed by the phosphorylation site p.
Primers and Probes Used for TaqMan Real-Time Quantitative RT-PCR
| TaqMan probe: TPO cDNA-518T | 5′-GAGAATGGAAAACCCAGATGGA-3′ |
| GAPDH amolicon | 5′-GAAGGTGAAGGTCGGAGT-3′ |
| PCR primer: TPO cDNA-310F (forward) | 5′-GTGGACCCTCCTACAAGCATCA-3′ |
| TPO cDNA-610R (reverse) | 5′-GTGGACCCTCCTACAAGCATCA-3′ |
| GAPDH cDNA (forward) | 5′-GAAGGTGAAGGTCGGAGT-3′ |
| GAPDH cDNA (reverse) | 5′-GAAGATGGTGATGGGA-3′ |
TaqMan real-time quantitative RT-PCR assay.
RNA from an individual sample was applied for RT and amplification using TaqMan EZ RT-PCR kit (Perkin Elmer, Foster City, CA) according to the manufacture's protocol. In brief, a master mixture that contained all reagents required for RT-PCR was prepared to give final concentration of 1× TaqMan EZ buffer, 0.3 mmol/L dNTPs, 3 mmol/L manganese acetate, 0.01 U/μL AmpErase UNG, and 0.1 U/μL rTth DNA polymerase. Total RNA extract (containing unknown amount of target TPO from BM stromal cells) was added to the master mixture. This mixture was used to generate two sets of tubes, set I and set II. To detect the amount of the TPO mRNA RT-PCR amplicon, target hybridization probe and primers were added to set I, and internal control hybridization probe and primers were added to set II, to give a final probe concentration of 100 nmol/L-and 200 nmol/L-primers, and the total reaction volume was increased to 50 μL. Each mixture was transferred to a set of thermocycler tubes. Target and internal control were reverse transcribed at 60°C for 30 minutes, followed by 50 cycles of amplification at 94°C for 20 seconds and 62°C for 1 minute, using ABI PRISM 7700 sequence detector (Applied Biosystems). During each cycle of the PCR the 5′ → 3′ exonuclease activity of rTth DNA polymerase cleaves the TaqMan probe, thereby increasing the fluorescence of the reporter dye at the appropriate wavelength. The increase in fluorescence (ΔRn) was proportional to the concentration of template in the PCR.
Threshold ΔRn is calculated by multiplying the standard deviation of three Rn- values (no template controls) by 6.965 according to the manufacturer's protocol for TaqMan RT-PCR Kit. PCR cycle number at threshold line is represented as CT.
ELISA for TPO.
One milliliter of BM samples were diluted with normal saline (threefold); peripheral blood (PB) samples were collected with heparin (100 U/mL). Samples were centrifuged (400g, 15 minutes) and the supernatants were collected as plasma.
Concentrations of TPO in plasma of PB and BM were measured by ELISA using the kit from Kirin Brewery Co Ltd (Tokyo, Japan).15Each of the 96 wells of flat-bottomed microtiter plates (Maxisorp; Nunc, Roskilde, Denmark) was coated at 4°C overnight with 100 μL of TNI (anti-human TPO mouse monoclonal antibody) at a concentration of 10 μg/mL in 50 mmol/L carbonate buffer (pH 9.4). After preincubation of the wells with 200 μL of a blocking reagent (Super block in Tris-buffered saline [TBS]; Pierce, Rockford, IL) for 30 minutes at room temperature (RT), 100 μL of rhTPO standards (Kirin Brewery Co Ltd), serum sample, or phosphate-buffered saline (PBS) were added to each well and reacted with the coated TNI overnight at RT. After washing with 20 mmol/L Tris-HCl containing 0.5 mol/L NaCl, 0.05% Tween 20, and 0.1% NaN3, pH 7.5 (T-TBS), 100 μL of the biotinylated anti-recombinant human (rh) TPO F(ab′)2 antibody at 500 ng/mL in T-TBS containing 1% bovine serum albumin and 2% PEG 6000 (dilution buffer) was added to each well for 3 hours at RT. After washing with T-TBS, 100 μL of streptavidin alkaline phosphatase conjugate (1 mU/mL in dilution buffer; Boehringer Mannheim, Indianapolis, IN) was added for 1 hour at RT. The color was developed using an amplification system (GIBCO-BRL Life Technologies, Grand Island, NY). After washing with T-TBS, 50 μL of substrate solution was added for 40 minutes at RT. Subsequently, 50 μL of amplifier solution was added for 30 minutes at RT. The reaction was stopped by adding 50 μL of 0.3 mol/L H2SO4. The color intensity was measured by a plate reader (Well Reader SK 601; Seikagaku Kogyo Co Ltd, Tokyo, Japan) with a measuring filter of 492 nm and reference filter of 630 nm. The absorbance of each sample was subtracted from that of the sample incubated with TNI.
Method for measurement of megakaryocyte counts.
After BM aspirates were 20-fold diluted with Turk medium, megakaryocyte number was counted with Fuchs-Rosenthal calculation glass (Kayagaki, Tokyo, Japan). Although counting megakaryocytes from aspirate may not be as accurate as from biopsy samples, the latter technique was not used in this particular investigation because it was difficult to obtain informed consent for biopsy from normal volunteers.
Statistics.
Analysis of variance (ANOVA)-parallel line assay was used to determine statistical significance between values for PB and BM. The Mann-Whitney U-test was used to assess the standard error of difference between two means; values were significant if P < .05.
RESULTS
TPO concentrations in BM and PB.
The mean TPO concentrations in BM and PB of NS and patients with ITP, AA, and ET as measured by ELISA are given in Table 2. Both BM and PB values in ITP were higher (P < .05) than those in NS and returned to near-normal value after steroid therapy. Patients with AA had extremely elevated levels of TPO, ie, 20-fold above normal values. Two patients with ET had TPO values within the normal range.
TPO Concentrations in PB and BM Plasma
| . | TPO Concentration (pg/mL) . | |
|---|---|---|
| PB . | BM . | |
| NS (n = 6) | 22.1 ± 8.2 | 32.8 ± 6.8 |
| ITP (n = 5) | 34.9 ± 11.7* | 61.4 ± 13.9* |
| ITP after PSL treatment (n = 6) | 25.0 ± 4.3 | 36.0 ± 12.9 |
| AA (n = 6) | 364.1 ± 153.5* | 406.9 ± 142.8* |
| ET (n = 2) | 20.0, 22.1 | 31.4, 35.7 |
Data represent the mean ± SD.
P < .05 v NS.
Relationship between TPO values in BM and PB.
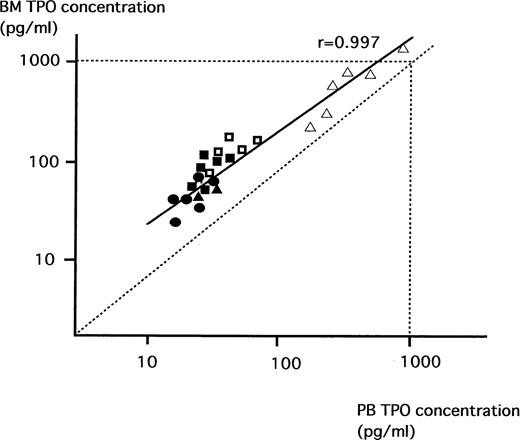
We then analyzed the relationship between TPO values in BM and PB in NS, ITP, AA, and ET. As shown in Fig 1, there was a strong positive correlation between values in BM and those in PB in these patients (r = .997); without exception, the levels of TPO in BM were significantly higher than those in PB.
Relationship between TPO concentrations in PB and BM. TPO concentrations in NS (•), patients with ITP before (□) and after (▪) treatment, AA (▵), and ET (▴) were measured by ELISA. There was a significant positive correlation between TPO levels in BM and PB in these patients (r = .997). In each subject, the TPO concentrations in BM were consistently higher than those in the PB.
Relationship between TPO concentrations in PB and BM. TPO concentrations in NS (•), patients with ITP before (□) and after (▪) treatment, AA (▵), and ET (▴) were measured by ELISA. There was a significant positive correlation between TPO levels in BM and PB in these patients (r = .997). In each subject, the TPO concentrations in BM were consistently higher than those in the PB.
Verification of TaqMan RT-PCR for measurement of TPO mRNA in stromal cells.
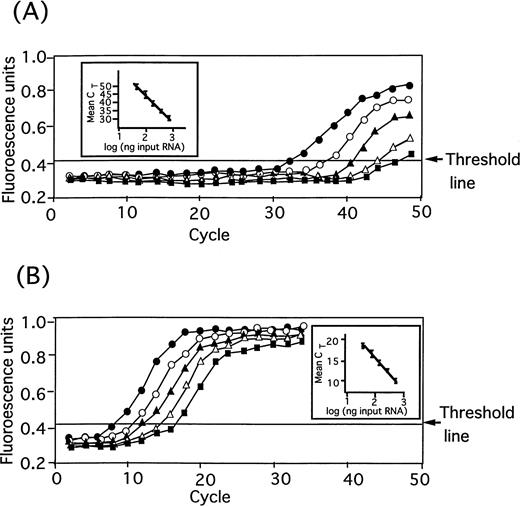
Before the application of TaqMan real-time quantitative RT-PCR for assessing the stromal TPO mRNA levels in various hematological diseases, we verified the method by using the sample from a normal subject (Fig 2). Two-fold diluted samples of total cell RNA (50 ng ∼ 800 ng) from normal stromal cells showed each distinct amplification curve in both TPO mRNA (Fig2A) and GAPDH mRNA (internal control) assays (Fig 2B).
Amplification plot of TPO mRNA (A) and GAPDH mRNA (B) of BM stromal cells in real time by TaqMan RT-PCR method. Total cellular RNA (800 ng, •; 400 ng, ○; 200 ng, ▴; 100 ng, ▵; 50 ng, ▪) extracted from normal human stromal cells was subjected to TaqMan PCR to detect a specific RT-PCR product of TPO mRNA and GAPDH mRNA in real time. The arrows indicated the threshold ▵Rn value obtained by multiplying the standard deviation of Rn- (no template controls) by 6.965. In inserted figures of (A) and (B), mean CT (cycles at threshold) of triplicate (bars represent one SD) was plotted against applied RNA amount.
Amplification plot of TPO mRNA (A) and GAPDH mRNA (B) of BM stromal cells in real time by TaqMan RT-PCR method. Total cellular RNA (800 ng, •; 400 ng, ○; 200 ng, ▴; 100 ng, ▵; 50 ng, ▪) extracted from normal human stromal cells was subjected to TaqMan PCR to detect a specific RT-PCR product of TPO mRNA and GAPDH mRNA in real time. The arrows indicated the threshold ▵Rn value obtained by multiplying the standard deviation of Rn- (no template controls) by 6.965. In inserted figures of (A) and (B), mean CT (cycles at threshold) of triplicate (bars represent one SD) was plotted against applied RNA amount.
For both mRNA, clear inverse correlations (inserted figures) were observed between CT values (cycles at threshold line) and the amount of applied cellular RNA.
Thus, this assay was confirmed to provide a high sensitivity with a nanogram range of sample RNA and sufficient quantitativeness for measuring TPO mRNA in stromal cells.
Expression levels of TPO mRNA of BM stromal cells in NS and in patients with ITP, AA, and ET.
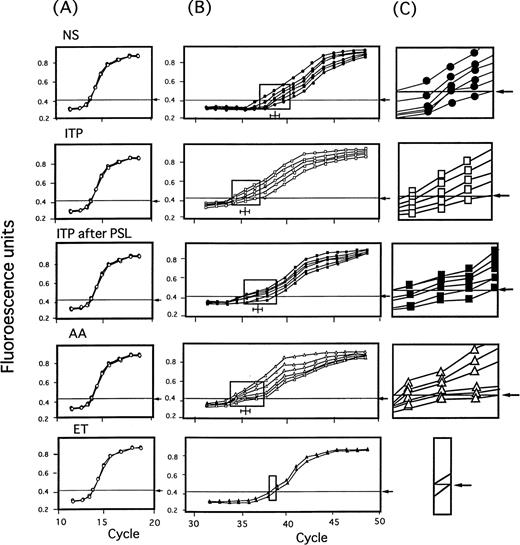
The levels of TPO mRNA and GAPDH mRNA expression in stromal cells from 6 NS, 5 patients with ITP, 6 patients with prednisolone treated ITP, 6 patients with AA, and 2 patients with ET were then examined by the TaqMan RT-PCR assay (Fig 3). Two hundred nanograms of total cellular RNA extracted from stromal cells of each patient and normal subject was subjected to TaqMan RT-PCR method. In each group, amplification curves of GAPDH mRNA from each individual overlapped to form almost a single line, and CT values were also almost the same (Fig 3A). Contrarily, amplification curves of TPO mRNA exhibited discrete patterns with different CT ranges indicated by rectangles for each group of disease and NS (Fig 3B), and discrete lines for each individual (Fig 3C).
Amplification of BM stromal TPO mRNA by TaqMan RT-PCR method in NS and in patients with ITP before and after treatment, AA, and ET. Two hundred nanograms of total cellular RNA extracted from stromal cells of NS (n = 6) and patients with ITP before (n = 5) and after (n = 6) treatment with steroid, AA (n = 6), and ET (n = 2) was subjected to TaqMan RT-PCR method. Threshold Rn value and CT were obtained as described in Materials and Methods. In (A) and (B), curves represent amplification plots of GAPDH mRNA and TPO mRNA, respectively. In (C), magnifying view of rectangular area of (B) which included minimum and maximum CT value for each disease group was shown to illustrate the differences more apparently.
Amplification of BM stromal TPO mRNA by TaqMan RT-PCR method in NS and in patients with ITP before and after treatment, AA, and ET. Two hundred nanograms of total cellular RNA extracted from stromal cells of NS (n = 6) and patients with ITP before (n = 5) and after (n = 6) treatment with steroid, AA (n = 6), and ET (n = 2) was subjected to TaqMan RT-PCR method. Threshold Rn value and CT were obtained as described in Materials and Methods. In (A) and (B), curves represent amplification plots of GAPDH mRNA and TPO mRNA, respectively. In (C), magnifying view of rectangular area of (B) which included minimum and maximum CT value for each disease group was shown to illustrate the differences more apparently.
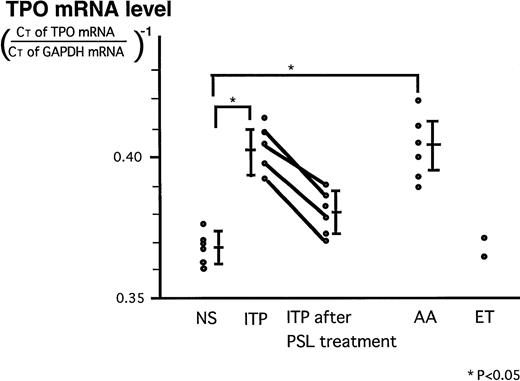
Because TPO mRNA for standard was not available to quantitate its absolute amount in stromal cells, the relative ratio of TPO mRNA/GAPDH mRNA was used. In Fig 4, levels of stromal TPO mRNA in these diseases and NS which were expressed as relative ratio of CT values for TPO mRNA and GAPDH mRNA were shown. In the patients with ITP, the expression levels were significantly increased compared to those in NS (P < .05) and were lowered by steroid treatment. In patients with AA, the levels were as high as those of patients with ITP. Two patients with ET showed normal expression of TPO mRNA.
Levels of stromal TPO mRNA expression in NS and in patients with ITP before and after treatment, AA, and ET. Expression levels of stromal TPO mRNA in these diseases and NS which were expressed as relative ratio of CT values for TPO mRNA and GAPDH mRNA: (CT of TPO mRNA/CT of GAPDH mRNA)−1. The bars represent the mean ± SD.
Levels of stromal TPO mRNA expression in NS and in patients with ITP before and after treatment, AA, and ET. Expression levels of stromal TPO mRNA in these diseases and NS which were expressed as relative ratio of CT values for TPO mRNA and GAPDH mRNA: (CT of TPO mRNA/CT of GAPDH mRNA)−1. The bars represent the mean ± SD.
Relationship between TPO concentration in BM plasma and the TPO mRNA expression of BM stromal cells in NS and in patients with ITP, AA, and ET.
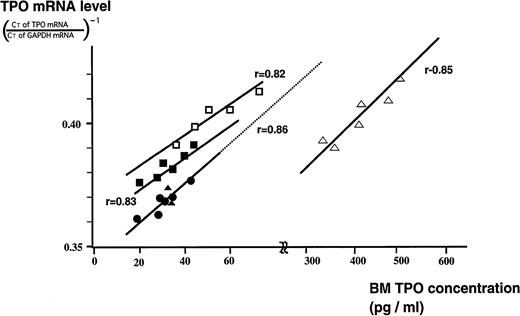
In all subjects there was a clear positive correlation between TPO mRNA levels of stromal cells and TPO concentrations in BM (Fig 5). However, the correlation linearities found in patients with the three disorders (ITP, AA, and ET) were all deviated from the expected lines based on those of normal subjects (indicated as a dotted line). In nontreated ITP patients, actual BM TPO concentrations were lower than one would predict from the regression line of NS who had the same TPO mRNA expression level as nontreated ITP. Conversely, in patients with AA, TPO concentrations deviated toward far higher levels than those predicted from the regression line of the NS.
Relationship between TPO concentrations in BM and TPO mRNA expression levels in BM stromal cells in NS and in patients with ITP before and after treatment, AA, and ET. BM TPO concentration of NS (•), the patients with ITP before (□) and after prednisolone treatment (▪), AA (▵), and ET (▴) were plotted against BM stromal TPO mRNA expression.
Relationship between TPO concentrations in BM and TPO mRNA expression levels in BM stromal cells in NS and in patients with ITP before and after treatment, AA, and ET. BM TPO concentration of NS (•), the patients with ITP before (□) and after prednisolone treatment (▪), AA (▵), and ET (▴) were plotted against BM stromal TPO mRNA expression.
Relationship between megakaryocyte count and BM stromal TPO mRNA.
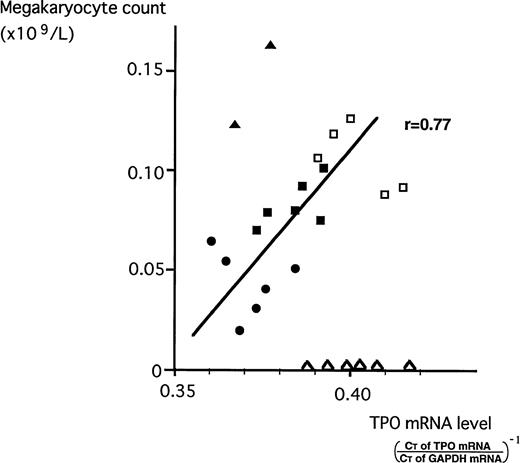
To investigate that stromal TPO indeed enhances megakaryopoiesis in vivo, we analyzed a relationship between stromal TPO mRNA and megakaryocyte counts in NS and in patients with ITP, AA, and ET. As shown in Fig 6, except for the cases of AA and ET whose megakaryopoiesis are not under the control of TPO because of impaired responsiveness to TPO (AA) or autoproliferative property of megakaryocyte (ET), megakaryocyte counts well correlated with the levels of BM stromal TPO mRNA.
Correlation between megakaryocyte counts and TPO mRNA expression levels in BM stromal cells. Megakaryocyte counts of NS (•), the patients with ITP before (□) and after (▪) prednisolone treatment, and patients with AA (▵) and ET (▴) were plotted against BM stromal TPO mRNA expression.
Correlation between megakaryocyte counts and TPO mRNA expression levels in BM stromal cells. Megakaryocyte counts of NS (•), the patients with ITP before (□) and after (▪) prednisolone treatment, and patients with AA (▵) and ET (▴) were plotted against BM stromal TPO mRNA expression.
DISCUSSION
To explore the source(s) of TPO whose expression varies in response to changes in platelet number, in this study we first measured the TPO concentrations in BM and PB to compare them in NS and patients with ITP, AA, and ET. The TPO concentrations in PB of our subjects agreed with those NS reported previously.15 16 In all the subjects examined, the TPO concentration in BM was positively correlated with that in PB and always exceeded that of PB with significant difference. This difference may be even more substantial in vivo because PB inevitably contaminates marrow aspirate, resulting in dilution of TPO in BM. These results indicated that TPO in BM was synthesized by some BM constituent(s).
Because we10 and others11 12 have already disclosed the fact that TPO mRNA is expressed in BM stromal cells, we hypothesized that stromal TPO may be the key regulator of megakaryopoiesis.
To evaluate the contribution of marrow stroma cell TPO to megakaryopoiesis, we obtained RNA from stromal cells grown for 4 weeks in Dexter cultures. Previous studies have suggested that such cells may reflect the physiological state of the marrow stroma from which the cultures were derived.17-20 This was true in our experiments, at least for the relative proportions of fibroblasts, endothelial cells, adipocytes, and macrophages.
Because RNAse protection assays for stromal TPO or mRNA were insensitive, we turned to a TaqMan real-time RT-PCR assay to determine stromal TPO mRNA levels. This assay has been recently applied for measurement of trace substances in biological fluid and was proven to be quite reliable in terms of reproducibility and accuracy.21 22
By using this assay it was proven that TPO mRNA expression in stromal cells of patients with ITP was significantly increased and returned to normal with steroid treatment. This phenomenon may be explained by our recent observation that transforming growth factor-β (TGF-β), which is released from destructed platelets or megakaryocytes in this disorder, stimulates stromal TPO mRNA, and the expression of stromal TPO mRNA decreases along with TGF-β with steroid therapy.23 This notion apparently contradict the results by Nagahisa et al,24 25 who found TPO mRNA levels in stromal cell was not affected by acute thrombocytopenia or thrombocytosis in mice. However, they have not examined the stromal TPO levels during drastic change in platelet count and therefore most likely failed to detect altered TPO expression.
Levels of TPO mRNA were correlated with TPO concentrations in BM in ITP, suggesting that at least one of the factors that defines the concentration of TPO in BM, ie, factors defining megakaryopoiesis, is the production of TPO by stromal cells. However, the concentration of TPO in the BM may not be solely determined by stromal TPO production because it was lower than the value predicted from the TPO mRNA level of NS (Fig 1). This unexpectedly low level could be caused by the adsorption of TPO on the surface of megakaryocytes that are increased in the BM of this disease.15
In AA, stromal TPO mRNA was as high as that of ITP. Although merely speculative, suppression of stromal TPO production by putative factors from nonstromal hematopoietic cells may be relieved by aplasia of hematopoietic cells because the expression of stromal TPO mRNA was enhanced by abolishing hematopoietic cells with high doses of chemotherapy (S. Sakamaki et al, unpublished data). TPO concentrations in BM and stromal TPO mRNA in AA also showed a clear positive correlation, again indicating that TPO in BM is derived from stromal cells. However, patients with AA had extremely high TPO concentrations in their BM (20-fold the normal value) and deviated significantly from the predicted value of mRNA levels of NS. This may be explained in part by the idea that in AA, megakaryocytes and platelets, on which TPO can be adsorbed, are drastically suppressed, and also by the notion that increased TPO itself may in turn suppress stromal TPO mRNA.23
Two patients with ET had normal levels of both TPO mRNA and TPO protein, despite the well-known abnormalities in megakaryopoiesis in this disease. This apparent paradoxical observation may be explained by a previous finding that megakaryocytes and platelets in this disease have fewer TPO receptors than their normal counterparts26and by the assumption that, in ET, both megakaryocytes and stromal cells may not be under regulation.
To verify that BM stromal TPO actually enhances megakaryopoiesis, the relationship between the stromal TPO mRNA and megakaryocyte counts was also analyzed. However, it is inappropriate to examine the effect of stromal TPO on megakaryopoiesis in AA or ET whose hematopoietic cells, including megakaryocytes, are not under the control of TPO. For this reason, we analyzed the relationship in NS and in patients with ITP, whose hematopoietic cells are supposed to be normal, and found a clear positive correlation between stromal TPO mRNA and megakaryocyte counts.
The present notion that BM stromal cells is a major source for TPO which locally regulates megakaryopoiesis appears to contradict to the fact that TPO mRNA levels in organs such as liver and kidney are substantially high compared with that in stromal cells. We believe that high levels of TPO mRNA expression in liver or kidney do not necessary mean that those organs are mainly involved in megakaryopoiesis because TPO released from these organs may be diluted in the circulation so that the concentration of TPO locally produced by stromal cells exceed that of PB.
The physiological role of liver and kidney, although merely speculative, may be to provide baseline TPO level in circulation preparing for stromal dysfunction.
In conclusion, the results of the present study strongly suggest that TPO in BM is mainly derived from BM stromal cells and that the concentration of TPO may be determined by its production rate from stromal cells and possibly by its absorption rate on receptors of platelets and megakaryocytes. Thus, in humans, TPO from BM stromal cells is considered to play an essential role for megakaryopoiesis under various pathophysiological conditions.
ACKNOWLEDGMENT
The authors thank Dr Susan C. Feldman for editorial assistance. We also thank Dr Irving Listowsky for helpful discussion and critical reading of our manuscript.
Supported in part by Grant-in-Aid for scientific research from the Ministry of Education, Science and Culture of Japan.
Address reprint requests to Yoshiro Niitsu, MD, PhD, Chief and Professor, 4th Department of Internal Medicine, Sapporo Medical University School of Medicine, South-1, West-16, Chuo-ku, Sapporo, 060-0061, Japan; e-mail: niitsu@sapmed.ac.jp.
The publication costs of this article were defrayed in part by page charge payment. This article must therefore be hereby marked "advertisement" is accordance with 18 U.S.C. section 1734 solely to indicate this fact.

This feature is available to Subscribers Only
Sign In or Create an Account Close Modal