Abstract
Hematopoietic progenitor cells die by apoptosis after removal of the appropriate colony-stimulating factor (CSF). Recent pharmacologic data have implicated protein kinase C (PKC) in the suppression of apoptosis in interleukin-3 (IL-3) and granulocyte-macrophage (GM)-CSF–dependent human myeloid cells. Because IL-3 and GM-CSF induce increases in diacylglycerol without mobilizing intracellular Ca++, it seemed that one of the novel Ca++ independent isoforms of PKC was involved. We report here that overexpression of PKC in factor-dependent human TF-1 cells extends cell survival in the absence of cytokine. Overexpression of PKCδ does not have this effect. By 72 to 96 hours after cytokine withdrawal, the PKC transfectants remain distributed in all phases of the cell cycle, as shown by fluorescence-activated cell sorting (FACS) analysis, while little intact cellular DNA is detectable in vector or PKCδ transfectants. PKC induces bcl-2 protein expression fivefold to sixfold over the levels in empty vector transfectants, whereas the levels in PKCδ transfectants are similar to those in vector controls.
THE INTERLEUKIN-3 (IL-3) receptor initiates the signals for survival and proliferation in primitive hematopoietic progenitor cells and certain multipotential leukemias in vitro.1,2 Ligand engagement of the receptor activates Src and Janus family tyrosine kinases associated with the β subunit of the receptor.3-6 Downstream of tyrosine phosphorylation the p21 Ras, Raf-1, and mitogen-activated protein kinases (MAPK) signal transduction cascade is activated.7-11 This cascade has been closely related to the induction of cell proliferation by IL-3 and granulocyte-macrophage colony-stimulating factor (GM-CSF). In addition, however, IL-3–induced tyrosine phosphorylation also causes activation of a phosphatidylcholine-dependent phospholipase C, increased levels of sn-1',2' diacylglycerol, and extended activation of protein kinase C (PKC) in hematopoietic cells, as well as in NIH 3T3 cells expressing a reconstituted human IL-3 receptor.12 13 The role of PKC in IL-3 receptor signal transduction has remained unclear.
Recent pharmacologic studies, however, have implicated the activation of PKC as part of a signal transduction cascade required for the suppression of apoptosis in IL-3/GM-CSF–dependent human myeloid cells. Inhibitors of PKC, but not inhibitors of cyclic nucleotide-dependent kinases, drive human IL-3–dependent cell lines MO7E and TF-1 into apoptosis even in the presence of IL-3.14,15 In addition, IL-3 induction of the antiapoptotic gene bcl-2 requires PKC in TF-1 cells.15 Conversely, inhibition of PKC by structurally unrelated inhibitors reduces bcl-2 levels in TF-1 cells even in the presence of IL-3. Further, downregulation of PKC by extended incubation in phorbol ester reduces bcl-2 levels in TF-1 cells and drives these cells into apoptosis in the absence or presence of IL-3. Although in many cell types, activation of PKC by phorbol ester suppresses apoptosis in other cells such as murine thymocytes and human Burkitt lymphoma cells, phorbol ester can actually induce apoptosis as it does in TF-1 cells.16 17 Thus, whether particular isoforms are rapidly activated or downregulated may be cell type-specific and determine whether PKC suppresses or induces apoptosis.
PKC is a multigene family of enzymes encoded by different mRNA species.18,19 The family can be divided into three subgroups: (1) the classic isoforms that require Ca+2 and diacylglycerol for activation, (2) the novel isoforms that require diacylglycerol, but not Ca+2, and (3) the atypical enzymes that require neither Ca+2 nor diacylglycerol. Growing evidence suggests that individual isoforms subserve distinct physiologic functions.18,19 It is likely that one of the novel isoforms of PKC is implicated in IL-3 activation because IL-3 induces diacylglycerol from phosphatidylcholine hydrolysis without elevating intracellular free Ca+2 in human IL-3–dependent cells.12 The δ, ε, η, and θ isoforms comprise the novel isoform subgroup. We have focused on the ε isoform because previous work has shown that this isoform is activated by GM-CSF in association with phosphatidylcholine hydrolysis in TF-1 cells.20 In this study, we have used the cDNAs for PKC ε and δ transfected into the human IL-3–dependent cell line TF-1 to investigate the role of specific novel isoforms in cell survival after cytokine withdrawal. We have chosen the δ isoform as a control for ε because δ and ε have been shown to have opposite effects on myeloid cell physiology.21
We report that overexpression of the ε isoform extends the survival of TF-1 cells in the absence of IL-3 . The ε isoform transfectants also showed significantly increased levels of bcl-2 protein. Transfection of the δ isoform had neither effect. Thus, a specific novel isoform of PKC may be required for the suppression of apoptosis through the IL-3 receptor.
MATERIALS AND METHODS
Preparation of PKC cDNA expressing plasmids.
The cDNA for PKCδ was a full-length cDNA cloned from a mouse myeloid tumor cell line ABPL-λ.22 The full-length PKCε cDNA was obtained by screening a mouse brain cDNA library as previously described by Mischak et al.23 The cDNA for PKCε was subcloned by blunt end ligation into the Bam H1 site of the vector pMTH.23 The δ cDNA was subcloned into a pMTH vector modified to add a 12 amino acid PKCε epitope tag to the PKCδ as previously described.24,25 Expression of the ε isoform from pMTH produces enzymatically active protein,23 as does the epitope tagged δ isoform.26 The Xho I and MluI sites in the epitope tagging pMTH vector were used to ensure undirectionality.24 The epitope tag consists of the amino acids KGFSYFGEDLMD that are derived from the carboxy terminal end of ε isoform. The epitope tag is specifically designed to be recognized by a commercially available polyclonal antibody made against amino acids 726-737 in the carboxy terminus of PKCε (GIBCO-BRL, Gaithersburg, MD). The antibody was purified by the manufacturer using affinity chromatography with immobilized peptide and is specific for this epitope in PKCε.
Transfection and cell selection.
Human IL-3–dependent TF-1 cells were transfected using Lipofectamine Reagent in OptiMEM medium (GIBCO-BRL, Gaithersburg, MD). In each transfection, 2 μg of DNA was used per 12 μL of lipofectamine reagent, and transfections were incubated for 5 hours at 37°C. After transfection, 3 × 10⁶ cells in 0.8 mL of OptiMEM containing 5 ng/mL of recombinant human IL-3 (BioSource Inc, Camarilllo, CA) were plated in each well of a 24-well tissue culture plate. Cells were selected with 600 μg/mL of active G418 (Geneticin from GIBCO-BRL) in the presence of 5 ng/mL of IL-3 for 4 weeks. At the end of the selection, individual colonies were isolated from the bottoms of the wells and expanded into cell lines.
Determination of cell survival and apoptosis.
Cell survival was determined by trypan blue exclusion and enumeration of viable cells using a hemocytometer. Apoptotic cells were also determined in inhibitor studies using an enzyme-linked immunosorbent assay (ELISA) (Boehringer Mannheim Inc, Indianapolis, IN) that employed sandwich antibodies recognizing histones and DNA. This assay allowed the quantitation of soluble nucleosomes in cell lysates.
Cell cycle analysis by flow cytometry.
Cells were washed and suspended in 1 mL of 70% ethanol at 4°C overnight. After incubation, cells were again washed in phosphate-buffered saline and resuspended in this solution containing 10 μg/mL RNase. Cells were then incubated at 37°C for 0.5 hours. At the end of the incubation, propidium iodide was added to a concentration of 50 μg/mL. The stained cells were then analyzed for DNA content by flow cytometry on a Becton-Dickinson FACScan flow cytometer.
Immunoblot analysis of cellular protein.
For immunoblots, cells were lysed by incubation in the cold with a buffer containing 1% Nonidet P-40 (NP-40), 50 mmol/L HEPES, pH 7.4, 100 mmol/L NaF, 10 mmol/L Na phenylphosphate, 2 mmol/L phenylmethylsulfonyl fluoride, 10 μg/mL leupeptin, and 2 μg/mL aprotinin. Protein concentration was measured by BCA Protein Assay (Pierce Inc, Rockford, IL), and exactly the same amount of protein was loaded for each lane (15 to 30 μg) in a given experiment. Proteins were separated by polyacrylamide gel electrophoresis and transferred to nitrocellulose membranes for immunoblotting with appropriate antibodies. Immunoreactive bands were visualized by chemiluminescence (ECL, Amersham, Arlington Heights, IL).
Densitometric analysis.
Densitometry was performed by digitizing chemiluminescent images on a flat bed scanner and analyzing the integrated optical densities of the digitized bands using the One-D Gel Scan Program from Scanalytics, Inc (Bilerica MA).
RESULTS
Characterization of PKC isoforms in TF-1 cells.
We began our analysis by examining the spectrum of PKC isoforms present in TF-1 cells (Fig 1). Aliquots of cell lysates were immunoblotted with a set of commercially available isoform specific antibodies (Transduction Laboratories, Lexington, KY). Among the classical isoforms, α and γ were detected, but not β. Of the novel isoforms δ, ε, and θ were detected. The η isoform may be present, but a useful antibody was not available. Finally, we also detected the atypical isoforms ζ, ι, and λ.
Immunoblot of PKC isoforms present in TF-1 cells. Exponentially growing TF-1 cells were lysed and proteins were separated by electrophoresis through 10% sodium dodecyl sulfate (SDS) polyacrylamide gels. Separated proteins were analyzed by immunoblotting with a series of commercially available isoform specific antibodies (Transduction Laboratories). The isoforms were visualized by chemiluminescence and exposure to x-ray film.
Immunoblot of PKC isoforms present in TF-1 cells. Exponentially growing TF-1 cells were lysed and proteins were separated by electrophoresis through 10% sodium dodecyl sulfate (SDS) polyacrylamide gels. Separated proteins were analyzed by immunoblotting with a series of commercially available isoform specific antibodies (Transduction Laboratories). The isoforms were visualized by chemiluminescence and exposure to x-ray film.
Transfection and overexpression of PKC ε and δ isoforms in TF-1 cells.
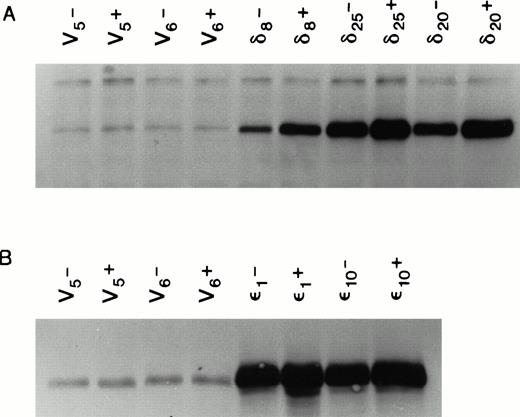
We used the cDNAs for the murine δ and ε isoforms of PKC cloned into the mammalian cell expression vector pMTH.22,23,25 At the amino acid level, these murine cDNAs code for proteins that are 90% and 99% homologous to their respective human counterparts.27 28 Both the human and murine isoforms of each type have the same in vitro substrate specificity. The pMTH vector contains a divalent cation inducible metallothionine promoter driving the PKC genes. Expression of the protein from this vector is thus zinc ion inducible. The PKC isoform containing plasmids or empty vector were transfected by lipofection into the multifactor-dependent human CD34+ cell line TF-1 cultured in IL-3. Stable cell lines overexpressing each isoform were selected in medium containing IL-3 and the antibiotic G418. Figure 2 shows that several cell lines were isolated that overexpressed PKCδ or PKCε even in the absence of zinc induction. The ability of 70 μm Zn++ to induce PKC expression clearly established that the overexpression is from the pMTH plasmid driven by metallothionine promoter and not due to cell line variation resulting from G418 selection.
Expression of PKC isoforms in selected TF-1 transfectants. TF-1 cells were transfected with appropriate plasmids containing either PKC or δ cDNA inserts. Transfectants were selected in the antibiotic G418. Isoform overexpression was determined either with (+) or without (-) induction with 70 μmol/L zinc acetate for 18 hours. Enzyme overexpression was detected by immunoblotting after proteins were separated by electrophoresis in a 10% SDS polyacrylamide gel. Results from immunoblots of isoform transfected cells probed with affinity purified rabbit polyclonal antibodies against murine PKC and cross-reacting with the human protein (GIBCO/BRL) are shown in (A), and results from δ transfected cells probed with antipeptide monoclonal antibodies recognizing both murine and human PKCδ (Transduction Laboratories) are shown in (B). Levels of overexpression were determined by digitizing ECL film images on the blots and analyzing the images with the 1D Gel Scan program (Scanalytics). Levels of PKC overexpression between and δ transfectants cannot be compared in this figure because it is a composite of immunoblots from two different experiments.
Expression of PKC isoforms in selected TF-1 transfectants. TF-1 cells were transfected with appropriate plasmids containing either PKC or δ cDNA inserts. Transfectants were selected in the antibiotic G418. Isoform overexpression was determined either with (+) or without (-) induction with 70 μmol/L zinc acetate for 18 hours. Enzyme overexpression was detected by immunoblotting after proteins were separated by electrophoresis in a 10% SDS polyacrylamide gel. Results from immunoblots of isoform transfected cells probed with affinity purified rabbit polyclonal antibodies against murine PKC and cross-reacting with the human protein (GIBCO/BRL) are shown in (A), and results from δ transfected cells probed with antipeptide monoclonal antibodies recognizing both murine and human PKCδ (Transduction Laboratories) are shown in (B). Levels of overexpression were determined by digitizing ECL film images on the blots and analyzing the images with the 1D Gel Scan program (Scanalytics). Levels of PKC overexpression between and δ transfectants cannot be compared in this figure because it is a composite of immunoblots from two different experiments.
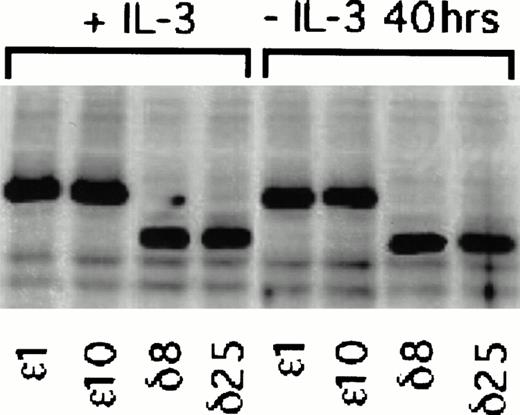
Figure 2 is a composite of immunoblots from different experiments, and therefore the levels of protein in the ε and δ overexpressers cannot be directly compared. We have therefore performed an experiment in which the levels in the overexpressers can be compared in the same immunoblot. In this experiment, we have also asked whether PKCε and PKCδ overexpression are independent of IL-3 in these cells. To do this, we have taken advantage of the epitope tag and identified both isoforms in the same blot with an antibody recognizing the ε epitope tag. Densitometric analysis of the cell lines in Fig 3 showed that the levels of overexpression were not significantly different between the ε and δ overexpressers. In addition, the overexpression of the δ and ε PKC isoforms was not decreased by withdrawing IL-3 from the cells for up to 40 hours. Comparison of the levels of overexpression to the basal level of these isoforms demonstrated that the δ and ε cell lines were overexpressing their respective isoforms eight times the basal level in vector transfected cell lines (Fig 2). The vector containing cell lines, which were transfected with an empty vector, served as controls in all subsequent experiments.
Effect of IL-3 deprivation on PKC overexpression in and δ TF-1 transfectants. Cell lines overexpressing PKC or PKCδ were grown in the absence or presence of IL-3 (10 ng/mL) for 40 hours. At the end of incubation, lysates were prepared and equal amounts of protein were analyzed by electrophoresis in the same polyacrylamide gel. Immunoblot analysis was performed with an isoform specific polyclonal antibody that recognized the 12 amino acid epitope. Thus both PKC and PKCδ with the epitope tag could be detected in the same immunoblot. Relative levels of and δ overexpression were directly compared in the immunoblot by digitizing the immunoblot image and analyzing with the 1D Gel Scan program (Scanalytics).
Effect of IL-3 deprivation on PKC overexpression in and δ TF-1 transfectants. Cell lines overexpressing PKC or PKCδ were grown in the absence or presence of IL-3 (10 ng/mL) for 40 hours. At the end of incubation, lysates were prepared and equal amounts of protein were analyzed by electrophoresis in the same polyacrylamide gel. Immunoblot analysis was performed with an isoform specific polyclonal antibody that recognized the 12 amino acid epitope. Thus both PKC and PKCδ with the epitope tag could be detected in the same immunoblot. Relative levels of and δ overexpression were directly compared in the immunoblot by digitizing the immunoblot image and analyzing with the 1D Gel Scan program (Scanalytics).
PKC overexpression and the suppression of apoptosis.
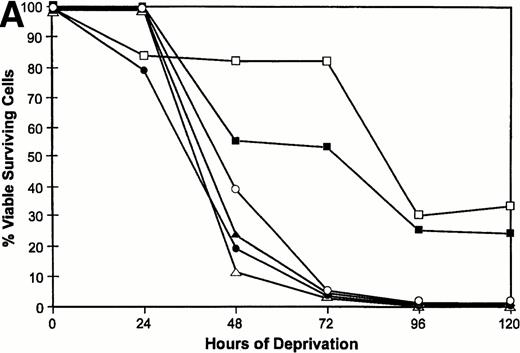
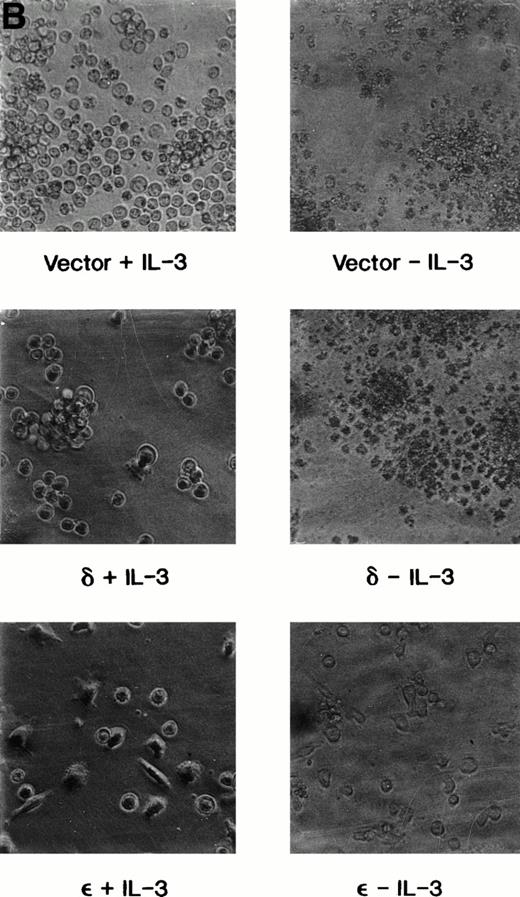
We have previously shown that when TF-1 cells growing in IL-3 are deprived of cytokine they die by apoptosis and their nuclear DNA is degraded to oligonucleosome size fragments. The effect of PKC isoform overexpression on cell survival was therefore determined by culturing the cells in serum containing medium lacking only IL-3 and scoring viable surviving cells with time after deprivation. By 72 hours of cytokine deprivation, only 1% to 2% of vector or PKCδ transfected cells remain viable; however, among the cell lines transfected with PKCε 60% to 80% of the deprived cells remain viable (Fig 4A). Even after 120 hours of IL-3 deprivation when no cells remain viable in the PKCδ or vector transfected cultures, 30% of the PKCε transfected cells remain viable. We examined the morphology of the transfectants cultured in IL-3 or after IL-3 deprivation for 72 hours (Fig 4B). The vector and PKCδ cells are completely apoptotic at this time. Most of the PKCε cells are intact and normal appearing, although there are morphologic differences between PKCε cells growing in IL-3 and deprived of IL-3. Conditioned medium from PKCε cells did not effect the survival of vector transfectants or wild-type TF-1 cells. Thus, PKCε is acting similarly to a cell survival gene like bcl-2 and is not producing an autocrine phenotype.
Survival of vector and PKC TF-1 cell transfectants after IL-3 deprivation. Cells were deprived of IL-3 for increasing periods of time and cell viability was determined by vital dye exclusion and enumeration of viable cells by light microscopy. (A) Transfectants represented are vector (▴-▴, ▵▵), PKC1 (□-□), PKC10 (▪-▪), PKCδ8 (○-○), and PKCδ25 (•-•). The percentage of viable cells is expressed in relation to the viable cell count at the beginning of the experiment. The experiment was repeated three times with similar results each time. (B) Photomicrographs of representative transfectants after 72 hours in the presence (+) or absence (-) of IL-3.
Survival of vector and PKC TF-1 cell transfectants after IL-3 deprivation. Cells were deprived of IL-3 for increasing periods of time and cell viability was determined by vital dye exclusion and enumeration of viable cells by light microscopy. (A) Transfectants represented are vector (▴-▴, ▵▵), PKC1 (□-□), PKC10 (▪-▪), PKCδ8 (○-○), and PKCδ25 (•-•). The percentage of viable cells is expressed in relation to the viable cell count at the beginning of the experiment. The experiment was repeated three times with similar results each time. (B) Photomicrographs of representative transfectants after 72 hours in the presence (+) or absence (-) of IL-3.
Cell cycle analysis of TF-1 transfectants.
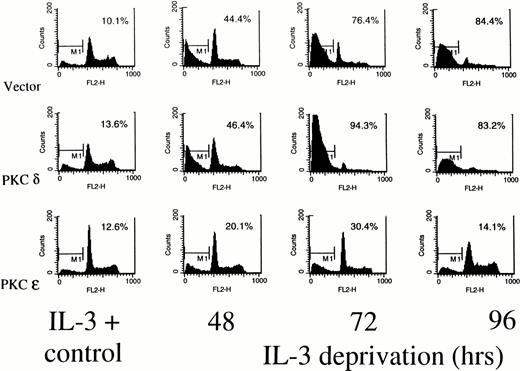
Figure 5 shows a cell cycle analysis from TF-1 transfectants deprived of IL-3 using propidium iodide staining and flow cytometry. In all of the cell lines, small peaks of hypodiploid apoptotic cells can be detected around channel 100 on the fluorescence axis, even while the cells are growing in IL-3. In the presence of IL-3, all the cell lines show a 2N (G0) peak at channel 200 and a 4N (G2/M) peak around channel 800. Cells falling between 200 and 800 are in S phase. By 48 hours after cytokine deprivation, there is a marked reduction in the G2/M phase cells in the vector transfected or PKCδ transfected cells, while the PKCε transfectants continue to show cells in all phases of the cell cycle. At 72 hours of deprivation, the G1 peak is beginning to disappear in the PKCδ and vector cell lines. The G2/M peak is also diminished in these cells. In the PKCε cultures, however, cells remain distributed in all phases of the cell cycle at this time. By 96 hours after deprivation, no intact DNA is visible in the vector and PKCδ transfected cells, while intact cycling cells are still stainable in the PKCε culture. Although only results from PKCε10 and PKCδ25 are shown, flow cytometry analysis of PKCε1, and PKCδ8transfectants showed the same results. To confirm that the PKCε transfectants were surviving due to PKC isoform overexpression, these cells were treated with the specific PKC inhibitor GF 109203X.29 This inhibitor drove both the ε transfectant and vector control cells into apoptosis confirming that their survival was dependent on PKC (data not shown).
Determination of cell cycle distribution of representative TF-1 transfectants in the presence or absence of IL-3. Cells were stained with propidium iodide at the indicated times and analyzed for cell cycle distribution by flow cytometry. The 2N and 4N DNA containing cells are in the 400 and 800 fluorescence channels, respectively. The percentage of cells with subdiploid DNA content is indicated in each panel. Similar profiles were obtained from the PKC1 and PKCδ8 transfectants. For all cell lines, 104 cells were counted for each analysis, and the experiments were performed twice with similar results each time.
Determination of cell cycle distribution of representative TF-1 transfectants in the presence or absence of IL-3. Cells were stained with propidium iodide at the indicated times and analyzed for cell cycle distribution by flow cytometry. The 2N and 4N DNA containing cells are in the 400 and 800 fluorescence channels, respectively. The percentage of cells with subdiploid DNA content is indicated in each panel. Similar profiles were obtained from the PKC1 and PKCδ8 transfectants. For all cell lines, 104 cells were counted for each analysis, and the experiments were performed twice with similar results each time.
Effect of PKC overexpression on bcl-2 induction.
In our previous studies, we determined that PKC appeared to be part of the IL-3 receptor signal transduction pathway that modulated expression of the cell survival gene bcl-2. We therefore determined whether PKC overexpression altered bcl-2 protein levels in TF-1 cells. Lysates from cells growing in IL-3 or deprived of IL-3 for increasing periods of time were prepared and analyzed for bcl-2 expression by immunoblotting using a monoclonal antibody that specifically recognizes the 26 kD human bcl-2 protein. Figure 6 shows the results from a representative experiment. In three separate experiments, the bcl-2 levels in the cell lines PKCε1, and ε10were fivefold to sevenfold greater than in vector transfectants, while PKCδ cells had levels only 1.5 to 2.0 times that in vector transfectants. At 38 hours after IL-3 deprivation, the level of bcl-2 in vector transfected cells had decreased to 58% ± 15% (mean ± standard error of mean [SEM]) of the control levels, while the levels of bcl-2 in PKC ε10 and ε1 cells remained induced at 5.5 ± .6 and 6.8 ± .8 (mean ± SEM) times the control level in vector transfectants, respectively. The PKCδ cells in the absence of IL-3 showed an approximate 70% decrease in bcl-2 levels in these experiments (Fig 6).
The bcl-2 protein content of TF-1 transfectants. Cell lysates were prepared from vector or PKC isoform overexpressing cells grown in the presence of IL-3 (+IL-3) or deprived of IL-3 (-IL-3) for 40 hours. Proteins in cell lysates were separated by electrophoresis in 16% SDS polyacrylamide gel and analyzed by immunoblotting using an antihuman bcl-2 murine monoclonal antibody obtained from Santa Cruz Biotechnology Inc (Santa Cruz, CA). Similar results were obtained in three different experiments.
The bcl-2 protein content of TF-1 transfectants. Cell lysates were prepared from vector or PKC isoform overexpressing cells grown in the presence of IL-3 (+IL-3) or deprived of IL-3 (-IL-3) for 40 hours. Proteins in cell lysates were separated by electrophoresis in 16% SDS polyacrylamide gel and analyzed by immunoblotting using an antihuman bcl-2 murine monoclonal antibody obtained from Santa Cruz Biotechnology Inc (Santa Cruz, CA). Similar results were obtained in three different experiments.
DISCUSSION
The activation of PKC by the IL-3 receptor has been observed in both murine and human hematopoietic cell types; however the physiologic role of this serine/threonine kinase in IL-3 receptor signal transduction has been unclear. The studies presented here implicate one novel isoform of PKC in the suppression of apoptosis after IL-3 deprivation in TF-1 cells. Interestingly, the ε isoform was more effective than the δ isoform in suppressing apoptosis. A role for the ε isoform in GM-CSF signaling has also been observed previously.20GM-CSF and other cytokines induce a metabolic burst in target cells, and this can be detected by microphysiometry as an increase in proton efflux from the cells. Extended treatment of TF-1 cells with PKCε antisense oligonucleotides specifically reduced levels of this isoform in these cells. This reduction in the ε isoform was accompanied by an 80% decrease in the GM-CSF–induced proton efflux.20GM-CSF, IL-3, and IL-5 all share the same receptor β subunit, and thus PKCε is probably part of an important signal transduction cascade linked to the suppression of apoptosis by this family of cytokines.30-33 We cannot exclude the possibility that other classic or novel isoforms of PKC may also contribute to signaling suppression of apoptosis through the IL-3 receptor. Work is in progress to compare the overexpression of other classic and novel PKC isoforms on suppression of apoptosis due to cytokine withdrawal.
Although other investigators have overexpressed the δ or ε isoforms in IL-3–dependent murine hematopoietic cells, no changes in IL-3 dependence in the absence or presence of phorbol ester were observed.19 These investigators did not, however, carefully assess cell survival after IL-3 deprivation. Our data, in TF-1 cells, confirm that PKCε overexpression does not abrogate the factor dependence of these cells, but that this isoform acts like a cell survival gene. Overexpression of the classic cell survival genebcl-2 in factor-dependent hematopoietic cells does not create factor independent cell lines, but only suppresses apoptosis for an increased period of time when the transfectants are deprived of IL-3.34 Thus, it is likely that PKC is part of the IL-3 receptor signal transduction cascade that modulates expression ofbcl-2 and/or other survival genes. In the present studies, we have shown that PKCε transfectants have levels of bcl-2 protein that are five to seven times greater than those in vector transfected cells even after removal of IL-3. The levels of bcl-2 protein in PKCδ transfectants is elevated 1.5 to twofold in the presence of IL-3 compared with vector transfectants, but falls dramatically after cytokine removal. Thus, PKCε induction of bcl-2 may contribute substantially to the survival of these cells. This observation is consistent with recent data showing that overexpression of bcl-2 in TF-1 cells increases survival in the absence of GM-CSF.35 This does not exclude the possibility that PKCε may also induce other genes that contribute to TF-1 cell survival.
The different biologic effects of PKCε and δ in TF-1 cells have also been observed in other cell types. In NIH 3T3 cells, overexpression of the ε isoform causes these cells to acquire an anchorage independent phenotype. The δ isoform, however, does not induce this phenotype.23 In rat basophils, isoform ε, but not δ, was found to be involved in signaling antigen-induced c-jun mRNA accumulation.36 Perhaps most significantly in the human cell line U937, the δ isoform appears to be involved in the induction of apoptosis. Ionizing radiation induces apoptosis in these cells and this is associated with the proteolytic cleavage and activation of PKCδ, probably by a protease from the IL-1 converting enzyme family.37,38 Overexpression of bcl-2 blocks both the onset of apoptosis and the proteolytic cleavage of isoform δ in these cells. In contrast, when the catalytically active proteolytic fragment of the δ isoform is overexpressed in HeLa or 3T3 cells, it induces the morphologic characteristics of apoptosis.38 Thus, the δ isoform is associated with activation of apoptosis. Differential phosphorylation of substrates in vivo has yet to be demonstrated for the different isotypes, although differential phosphorylation has been demonstrated with purified proteins in vitro.18 19
The signal transduction cascades regulating bcl-2 expression in lymphoid or myeloid cells are poorly understood. Recent work has shown, however, that the bcl-2 promoter contains a cyclic adenosine monophosphate response element (CRE).39 Mutation of this site resulted in loss of CREB binding and the loss of functional activity of the bcl-2promoter in transient transfection assays. Further, in the immature Ramos B-cell line, bcl-2 expression is increased following short-term phorbol ester treatment, and the increased expression is dependent on the CRE site.39 Phorbol ester stimulation also resulted in increased phosphorylation of CREB on serine 133, and this phosphorylation is mediated by PKC rather than by protein kinase A. Interestingly, IL-3 also induces phosphorylation of CREB at serine 133, although the kinase responsible for this phosphorylation has not been identified.40 We are currently investigating the relationship of PKC to IL-3–induced CREB 133 phosphorylation and the regulation of bcl-2 gene expression.
Supported by United States Public Health Service Grant No. CA53609-06.
Address reprint requests to R.A. Mufson, PhD, Department of Immunology, Holland Laboratory/American Red Cross, 15601 Crabbs Branch Way, Rockville, MD 20855.
The publication costs of this article were defrayed in part by page charge payment. This article must therefore be hereby marked “advertisement” in accordance with 18 U.S.C. section 1734 solely to indicate this fact.



This feature is available to Subscribers Only
Sign In or Create an Account Close Modal