Abstract
Interleukin-10 (IL-10) downmodulates phagocytic immune responses and accentuates humoral responses. Human neonates exhibit broad immune deficits that parallel actions of IL-10. We postulated that IL-10 production would be diminished in neonatal blood cells. We found that IL-10 production by lipopolysaccharide-stimulated peripheral blood mononuclear cells (PBMNCs) in vitro was greater by adult cells than by term cells and preterm cells. Additional studies were undertaken to identify mechanisms responsible for the developmental differences in IL-10 gene expression. IL-10 transcription was present in freshly isolated adult and neonatal cells in the absence of detectable levels of transcript. Transcription rates were not different between adult and neonatal cells. IL-10 transcripts were approximately 40% more abundant in adult cells than in term cells and were consistent with differences in secreted protein; however, no differences were noted in mRNA stability. IL-10 half-life was 60 minutes for both adult and term PBMNCs. We conclude that up-regulation of IL-10 gene expression in PBMNCs is modulated at the post-transcriptional level, that IL-10 protein production and mRNA content are greater in activated cells from adults compared with those from neonates, and that maturational differences in IL-10 expression are not due to differences in transcription rate or mRNA stability. Maturational differences in IL-10 expression might be due to differences in subpopulations of cytokine-producing cells or differences in nucleo-cytoplasmic transport.
THE IMMUNE RESPONSE is finely balanced to eliminate foreign antigens and invading microbes without inflicting injury on the host organism. Cytokines are soluble mediators that are responsible, at least in part, for orchestrating immune effector functions to achieve this balance. Interleukin-10 (IL-10) is a pleiotropic cytokine known to be an important regulator of lymphoid and myeloid effector functions. Its actions include suppression of monocyte, macrophage, T cell, and natural killer (NK) cell effector function.1-7 These biological effects are modulated largely by inhibiting transcription of specific cytokines by monocytes and macrophages8,9 and by blocking macrophage accessory cell function.10-12 In general, IL-10 inhibits T helper cell 1 (Th1) immune responses involving IL-2 and interferon-γ (IFN-γ) production, which induce delayed-type hypersensitivity. Conversely, IL-10 enhances T helper cell 2 (Th2) immune responses. These include production of IL-4 and IL-5, which support B-cell proliferation and differentiation.5,13,14 While a number of different cell types produce IL-10, monocytes are the predominant cell type responsible for its synthesis in the blood.15-17
IL-10 synthesis, like that of other cytokines, is tightly regulated; however, the molecular mechanisms responsible for its regulation in the circulating blood have not been elucidated. Contained in the promotor region of its genomic structure are several motifs known to modulate transcription. These include an NFκB-like recognition site, an interferon inducibility sequence, a cAMP responsive element, and a glucocorticoid responsive element.18,19 Suspected regulatory elements are also present in the 3′ untranslated portion of the gene, which might play a role in IL-10 gene expression. Among these are AUUUA repeat sequences, which have been implicated in regulation of stability and nucleo-cytoplasmic transport of other short-lived mRNA species.20-23
Since IL-10 plays a significant role in modulating cytokine synthesis by peripheral blood mononuclear cells (PBMNCs), its dysregulation during development might contribute to the reduced cytokine production observed in neonatal cells.24-28 Moreover, up-regulation of IL-10 and its resultant suppression of cytokine synthesis could account for decreased production of cytokines by blood cells from human neonates. In the present studies we sought to delineate the mechanisms regulating IL-10 production and gene expression in human PBMNCs and to determine whether its expression is altered in cells of neonatal origin.
MATERIALS AND METHODS
Subjects.Studies of cytokine production were performed using umbilical cord blood obtained immediately following delivery of preterm (23 to 34 weeks' gestation) and term (38 to 41 weeks' gestation) neonates and peripheral blood obtained from healthy adult volunteers. These studies were performed in accordance with protocols approved by the University of Utah Institutional Review Board and informed consent was obtained from participants.
Cell preparation and culture.PBMNCs were obtained by density gradient centrifugation over Ficoll-Hypaque (sg < 1.077). Cells (5 × 10⁵/well) were plated in 16-mm tissue culture wells and incubated in 5% CO2 at 37°C with various concentrations of LPS (Escherichia coli Serotype 0128:B12; Sigma, St Louis, MO, 0-10 μg/mL).
Monocyte-enriched cell populations were prepared by incubating light-density blood cells, obtained by density gradient centrifugation over Ficoll-Hypaque (sg < 1.077), with murine antibodies directed against human T lymphocytes (anti-human CD2 and anti-human CD5), B lymphocytes (anti-human CD19), progenitor cells (anti–HPCA-1, all from Becton Dickinson, San Jose, CA), and erythrocytes (anti-glycophorin antibodies, Accurate Chemical Co, Westbury, NY). Antibody-bound cells were extracted from the remaining cells using magnetic beads coated with goat anti-murine antibodies (Dynal Inc, Great Neck, NY). The monocyte concentrations in the resultant cell populations were determined by alpha naphthyl esterase staining (Sigma Diagnostics). The proportion of monocytes was 92% ± 4% (mean ± SD) for adults, 92% ± 3% for term neonates, and 89% ± 4% for preterm subjects.
FACS analysis.Cells were incubated with murine anti-human CD14 and CD45 (Caltag Laboratories, San Francisco, CA) to determine the proportions of monocytes and lymphocytes, respectively, in the PBMNC populations by fluorescence activated cell sorter (FACS). Subsets of monocytes were evaluated using murine anti-human CD14 FITC and CD16 PE (Caltag Laboratories).
Quantification of cytokines.IL-10 concentrations were measured by ELISA (Biosource International, Camarillo, CA). Briefly, supernatants from cells cultured with various concentrations of LPS were incubated in microtiter wells coated with biotinylated anti–IL-10. Following several washing steps, streptavidin-horseradish peroxidase conjugate was added to the wells and incubated at 37°C for 45 minutes. The solution was aspirated from each well and washed four times. Subsequently, a stabilized chromagen solution was added and incubated at room temperature for 30 minutes. Absorbances were read at 450 nm and compared with the standard IL-10 concentration curve. This ELISA recognized both natural and recombinant IL-10 and demonstrated no cross-reactivity with other cytokines. The minimum detectable concentration of IL-10 using this assay was 5 pg/mL.
Nuclear run-on transcription assay.A total of 0.5 to 1.0 × 10⁸ PBMNCs derived from cord blood and adult blood were stimulated with LPS (10 μg/mL) for 3 and 6 hours. Three and 6-hour time points were selected as they precede times of maximal IL-10 mRNA expression by Northern blot. Nuclei isolation and nuclear run-on assays were performed using a slight modification of previously described methods.29 Cells were washed in phosphate buffered saline (PBS), lysed in 4 mL lysis buffer (10 mmol/L Tris [pH 7.4], 10 mmol/L NaCl, 3 mmol/L MgCl2 , 0.5% NP-40) on ice for 5 minutes, and centrifuged for 5 minutes at 1,500 rpm (4°C) in a Beckman TJ-6 centrifuge to pellet the nuclei. The nuclei were washed in lysis buffer, then resuspended in 100 μL storage buffer (40% glycerol, 50 mmol/L Tris [pH 7.6], 5 mmol/L MgCl2 , 0.1 mmol/L EDTA) and stored at −70°C. Nuclear run-on reactions were carried out for 30 minutes at 30°C in the 50 μL of elongation buffer (20 mmol/L Tris [pH 8.0], 10 mmol/L MgCl2 , 100 mmol/L KCl, 10 mmol/L DTT) after the addition of 5 μL each of 10 mmol/L adenosine 5′-triphosphate (ATP), guanosine-5′-triphosphate (GTP), cytidine-5′-triphosphate (CTP), and 200 μCi [32P]-uridine-5′-triphosphate (UTP) (3,000 Ci/mmol; Amersham, Arlington Heights, IL), 5 U RNAsin (Promega, Madison, WI), and 20 μL water. The reaction was halted by the addition of stop buffer (10% Sarcosyl, 100 mmol/L EDTA, 100 mmol/L Tris [pH 7.6], 1 mg/mL Proteinase K). The reaction was heated at 42°C for 30 minutes. Fifteen microliters of yeast transfer RNA was added as a carrier. The RNA was extracted three times with phenol/chloroform/isoamyl alcohol (25:24:1, vol/vol/vol) and precipitated in ethanol using 0.3 mol/L sodium acetate (pH 4). Newly elongated 32P-labeled transcripts were subsequently hybridized to membrane bound DNA probes.
Target DNA used in hybridization included the following: hIL-10, 1,800-bp Xho I/Xho I fragment from pcD-Srα (H5C, kindly provided by P. Vieira, DNAX, Palo Alto, CA), human small nuclear ribonucleoprotein U1, SNURP1, 300-bp BglII/BamHI fragment in pSP65 (kindly provided by D. Kohan, University of Utah, Salt Lake City, UT), and hβ-actin, a 2,000-bp EcoRI from SK- (ATCC, Rockville, MD). DNA samples were denatured by adding NaOH to a final concentration of 0.1 mmol/L NaOH and incubating at room temperature for 30 minutes. Four volumes of 6× SSC were added and the same amount of the target cDNA insert, 5 μg/slot, was loaded onto Duralon-UV (Stratagene,) using a slot blot apparatus (Bio-Rad, Richmond, CA). Bluescript (Promega, Madison, WI) was included as a negative control as the plasmid vector. Human β-actin (ATCC) and SNURP1 were used as internal controls for normalization.
Before hybridization, the filters were crosslinked with ultraviolet light and were prehybridized for at least 1 hour in hybridization solution (50% deionized formamide, 250 mmol/L sodium phosphate [pH 7.2], 250 mmol/L NaCl, 0.1 mmol/L EDTA, 7% SDS (wt/vol), and 50 μg/mL denatured single-stranded sperm DNA).30 Hybridizations were performed using 5 to 20 × 106 cpm/mL of hybridization solution at 42°C for 36 hours. After hybridization, the slot blots were washed in 0.3× SSC at 65°C for 1 hour, then exposed to Kodak XAR-5 X-ray film with intensifying screen at −70°C for 2 to 7 days. Run-on signal intensity was assessed by scanning the density of bands on autoradiographs by Computing Densitometer (Molecular Dynamics, Sunnyvale, CA). The density of bands was normalized to the signal of internal standards.
Preparation of RNA.PBMNCs isolated from healthy adults and from cord blood were plated at 4 × 10⁶ cells/mL in 1× αMEM (Sigma Chemicals) and 1% Nutridoma (Boehringer Mannheim, Indianapolis, IN). Cells were stimulated with LPS (1 μg/mL of culture medium) and incubated at 5% CO2 and 37°C. Total RNA was isolated using TRI Reagent (Molecular Research Center, Inc, Cincinnati, OH). A time course demonstrated maximal mRNA content following stimulation with LPS between 6 and 14 hours. Messenger RNA stability was evaluated by stimulating cells for 10 hours with LPS, then adding actinomycin D (10 μg/mL) to each plate. Total cellular RNA was collected at 0, 15, 30, 60, and 90 minutes after the addition of actinomycin D and stored at −70°C for subsequent analysis.
Northern analysis.RNA samples were electrophoretically fractionated using standard procedure on formaldehyde gels. The following cDNA fragments were used as probes in the Northern analysis: 2,000-bp EcoRI fragment of human β-actin cDNA (ATCC) and 760-bp Bgl II-HindIII fragment (nt 159-919, exons III through V) of pCD-SRα-hIL-10 cDNA (kindly provided by Paulo Vieiro, DNAX Research Institute, Palo Alto, CA). High specificity probes were made with Prim-it Random Primer Kit (Stratagene, La Jolla, CA) and hybridized overnight with a minimum of 5 × 10⁶ cpm/mL of 32P-labeled cDNA probes. Membranes were washed with 1× SSC, 0.1% SDS at room temperature for 10 minutes and followed by washes at high stringency with 0.1× SSC, 0.1% SDS, 55 to 65°C for 20 minutes. Subsequently the membranes were exposed to autoradiographic film (Amersham, CEA AB, Sweden).
RNase protection assay.High specific activity IL-10 and β-actin radiolabeled cRNA probes were synthesized in 1× transcription buffer prepared according to the manufacurer's specifications, 10 mmol/L DTT, 12.5 U RNase Inhibitor, 0.5 mmol/L ATP, 0.5 mmol/L GTP, 0.5 mmol/L CTP, 5 μmol/L UTP, 1 μg of BstE II linearized pBS-hIL-10 or pTRI-β-actin-125-human (Ambion Inc, Austin, TX), 50 μCi [α-32P]UTP at 3,000 Ci/mmol, 20 U T3 RNA Polymerase. Reaction tubes were incubated for 1 hour at room temperature. Next, templates for “run-off” transcript reactions were removed with 2 U RNase-free DNase I at 37°C. Probes were gel purified on a 5% polyacrylamide/8M urea gel at 400 V and eluted with 0.5 mol/L NH4OAc, 1 mmol/L EDTA, 0.1% SDS at 37°C overnight. Eluted probes (80,000 dpm) were co-precipitated with 10 μg of total RNA in 0.5 mol/L NH4OAc and 75% EtOH. RNA pellets, then, were resuspended in 80% formamide, 100 mmol/L sodium citrate pH 6.4, 300 mmol/L NaOAc pH 6.5, 1 mmol/L EDTA and incubated at 45°C overnight. Hybridized probes and sample RNA were digested with RNase A/RNase T1 in RNase digestion buffer (RPA II; Ambion, Austin, TX) at 37°C. Subsequently, RNases were deactivated and protected probe fragments were precipitated, resuspended, separated by electrophoresis on a 5% polyacrylamide/8M urea, and visualized with autoradiography.
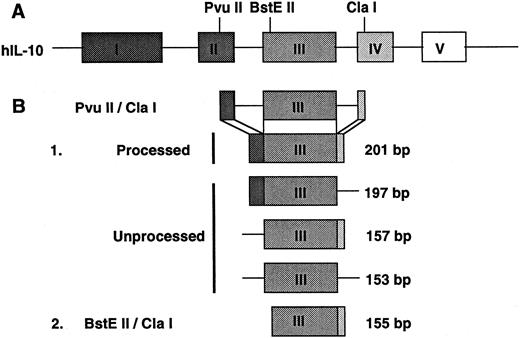
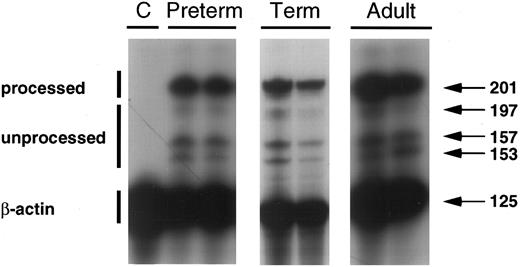
In studies evaluating nuclear processing of IL-10 transcripts a probe was constructed to span introns. This probe was constructed by cutting the IL-10 cDNA with restriction enzymes, Cla I and PvuII. This construct included 201 bp of the processed IL-10 mRNA and spans from exon II to exon IV. IL-10 transcripts that have completed nuclear processing would yield fragments 201 bp in length by RNAse protection, including 44 bp of exon II, 153 bp of exon III, and 4 bp of exon IV. Transcripts that are incompletely processed would yield protected fragments of variable length including 197 bp (exon II and exon III), 157 bp (exon III and exon IV), and 153 bp (exon III only).
Densitometry.Following optimal autoradiographic exposure, images or negatives of type 55 positive/negative films were scanned and determined the densities of the bands with Computing Densitometer (Molecular Dynamics, Sunnyvale, CA).
Statistical analysis.The Student's t-test with Bonfaroni correction for multiple observations was used to assess differences in IL-10 production by mononuclear cells. A two-tailed P value of less than .05 was considered to indicate significance. Linear regression was used to compare actinomycin D mRNA half-life between adult and neonatal participants.31
RESULTS
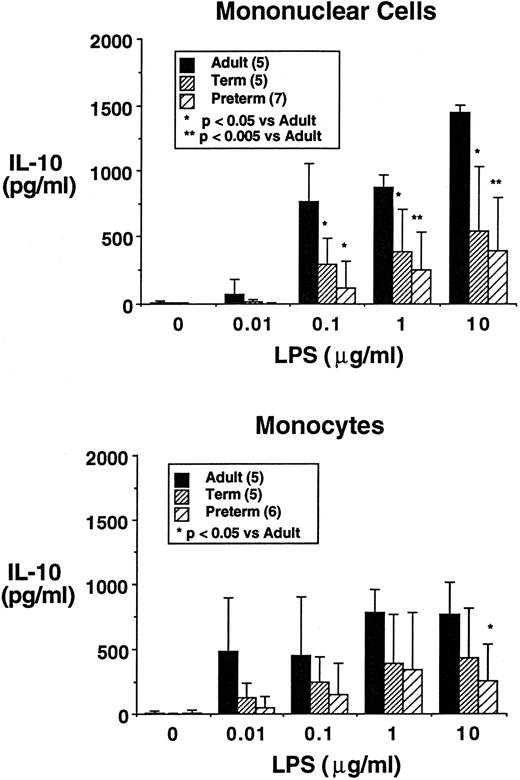
IL-10 production is stimulated by LPS and diminished secretion is observed using newborn mononuclear cells.IL-10 was not synthesized constitutively by freshly isolated PBMNCs cultured in serum-free media; however, it was readily inducible by inclusion of LPS in the media. As was observed with several other cytokines,24-29 IL-10 production by LPS-activated PBMNCs was greatest by adults, intermediate by term neonatal cells (P < .05 v adult), and least by preterm neonatal cells (P < .005 v adult) as illustrated in Fig 1. Similarly, IL-10 production was greater in LPS-stimulated adult monocytes than in term or preterm monocytes (P < .05 v adult). No significant differences were observed between term and preterm neonates in IL-10 production by PBMNCs or by monocytes.
Production of IL-10 by PBMNCs (upper panel) and monocytes (lower panel) of adult, term neonatal, and preterm neonatal origin. Cells were plated at 106 cells/mL in serum-free media, were stimulated with LPS (up to 10 μg/mL) for 24 hours. Values shown are mean ± standard deviation.
Production of IL-10 by PBMNCs (upper panel) and monocytes (lower panel) of adult, term neonatal, and preterm neonatal origin. Cells were plated at 106 cells/mL in serum-free media, were stimulated with LPS (up to 10 μg/mL) for 24 hours. Values shown are mean ± standard deviation.
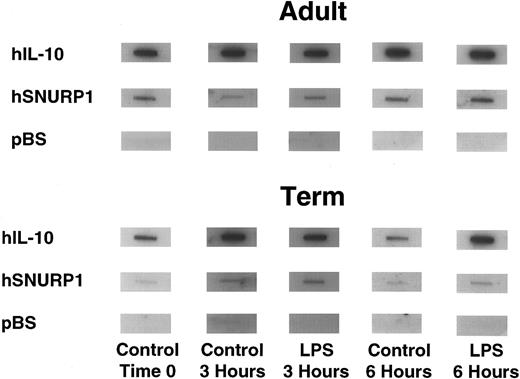
IL-10 gene transcription is observed in unstimulated mononuclear cells.Nuclear run-on transcription assays were performed to determine whether differences in IL-10 production between adult and neonatal cells resulted from differential transcription. Significant transcription of the IL-10 gene was observed in freshly isolated cells from both adults and neonates (Fig 2). Similarly, cells cultured for 3 and for 6 hours in the absence of LPS also exhibited significant IL-10 transcription rates. IL-10 transcription rates, as determined by the ratio of IL-10 transcripts to internal control transcripts, hSNURP1 and hβ-actin cDNAs, were not significantly different between adult (8.1 ± 7.6, n = 3) and term neonatal cells (4.9 ± 0.5, n = 3) at 3 hours or at 6 hours, 3.2 ± 2.3 (n = 6) versus 5.7 ± 7.2 (n = 3), respectively. These findings support a posttranscriptional mechanism accounting for the differences observed in IL-10 protein production.
Nuclear run-on transcription assay demonstrating IL-10 transcription rate in adult (upper panel) and term neonatal blood PBMNCs (lower panel) at the time of isolation (time 0), following 3 and 6 hours in culture without LPS stimulation (control 3 hours and control 6 hours), and following stimulation with 10 μg/mL LPS (LPS 3 hours and LPS 6 hours). The IL-10 target is a 1.8-kb Xho I cDNA insert, SNURP1 is shown as an internal control, and bluescript (pBS) is shown as the negative control.
Nuclear run-on transcription assay demonstrating IL-10 transcription rate in adult (upper panel) and term neonatal blood PBMNCs (lower panel) at the time of isolation (time 0), following 3 and 6 hours in culture without LPS stimulation (control 3 hours and control 6 hours), and following stimulation with 10 μg/mL LPS (LPS 3 hours and LPS 6 hours). The IL-10 target is a 1.8-kb Xho I cDNA insert, SNURP1 is shown as an internal control, and bluescript (pBS) is shown as the negative control.
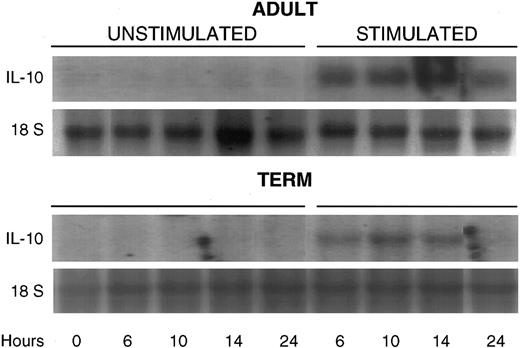
Posttranscriptional regulation of IL-10 mRNA stability.IL-10 mRNA content of adult and neonatal PBMNCs was evaluated at various time points following stimulation with LPS. No IL-10 mRNA was noted in freshly isolated cells at time zero or in cells cultured for various time periods in the absence of LPS. Maximal IL-10 content was observed at between 6 and 14 hours following stimulation with LPS (Fig 3).
Northern blot demonstrating time course of IL-10 mRNA induction in unstimulated adult mononuclear cells (upper panel) and term neonatal cells (lower panel) and in LPS-stimulated cells at 6, 10, 14, and 24 hours in culture. IL-10 transcripts (1.8 kb) are shown in the upper panel and 18 S ribosomal RNA bands are shown for normalization of total cellular RNA loaded.
Northern blot demonstrating time course of IL-10 mRNA induction in unstimulated adult mononuclear cells (upper panel) and term neonatal cells (lower panel) and in LPS-stimulated cells at 6, 10, 14, and 24 hours in culture. IL-10 transcripts (1.8 kb) are shown in the upper panel and 18 S ribosomal RNA bands are shown for normalization of total cellular RNA loaded.
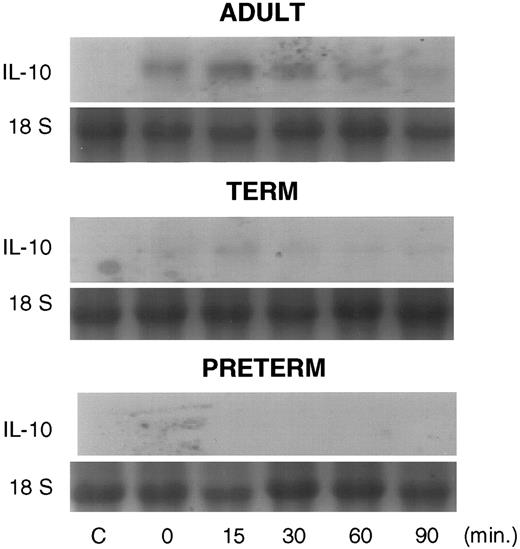
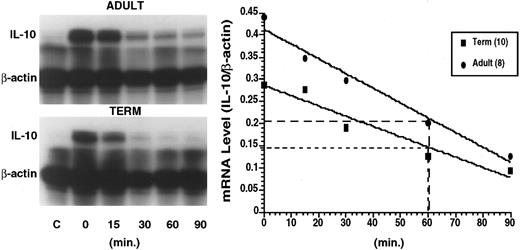
Actinomycin D half-life studies were performed to assess stability of the IL-10 mRNA. We were able to detect IL-10 transcripts from adult and term neonatal PBMNCs by Northern blot analysis; however, IL-10 transcript content of preterm cells were below the limits of resolution by Northern blot (Fig 4). The IL-10 transcript content of PBMNCs was greater in adult cells than in term or preterm neonatal cells. Subsequently, RNAse protection assays were used to enhance the sensitivity of IL-10 mRNA detection. IL-10 constructs used as probes in these experiments are depicted in Fig 5. The BstEII/Cla I probe was used in IL-10 half-life analyses. The PvuII/Cla I restriction enzyme fragment was used as a probe in studies of nuclear processing of IL-10 mRNA. A representative RNAse protection assay demonstrating progressive degradation of IL-10 mRNA after addition of actinomycin D in cells of adult and neonatal origin is presented in Fig 6, left panel. Linear regression analysis of IL-10 mRNA half-life from cells of 8 adult and 10 term neonatal individuals is presented in Fig 6, right panel. These studies demonstrate no differences in the half-life of IL-10 transcripts from adult PBMNCs and term neonatal cells. IL-10 half-life was determined to be approximately 60 minutes in cells from both adult and term neonatal subjects. We were unable to determine the half-life of IL-10 in cells from preterm individuals as IL-10 transcripts were undetectable in most instances.
Northern blot analysis probed with a 760-bp fragment of the IL-10 cDNA demonstrating IL-10 transcript content of PBMNCs from adult (upper panel), term (middle panel), and preterm blood (lower panel) in the absence of LPS (C, lane 1) and cultured for 10 hours with LPS (1 μg/mL), then treated with actinomycin D (10 μg/mL) at time 0, 15, 30, 60, and 90 minutes (lanes 2-6, respectively). RNA loading is standardized using 18S ribosomal RNA bands.
Northern blot analysis probed with a 760-bp fragment of the IL-10 cDNA demonstrating IL-10 transcript content of PBMNCs from adult (upper panel), term (middle panel), and preterm blood (lower panel) in the absence of LPS (C, lane 1) and cultured for 10 hours with LPS (1 μg/mL), then treated with actinomycin D (10 μg/mL) at time 0, 15, 30, 60, and 90 minutes (lanes 2-6, respectively). RNA loading is standardized using 18S ribosomal RNA bands.
Illustration of human IL-10 gene structure and protected fragment generated in RNAse protection assays. (A) This diagram depicts the genomic structure of the human IL-10 gene and delineates unique restriction enzyme sites used to generate template cDNA for RNAse protection assays. (B) Probes generated for RNAse protection assays are as follows: (1) a completely processed 201-bp PvuII/Cla I fragment including a portion of exon II, all of exon III, and a portion of exon IV, and three incompletely processed protected fragments including a 197-bp portion of exon II and the complete exon III, a 157bp fragment including all of exon III and a portion of exon IV, and a 153-bp fragment consisting of exon III only. The probe used in RNAse protection half-life assays (2) was a 155-bp BstEII/Cla I fragment which included the majority of exon III and a small portion of exon IV.
Illustration of human IL-10 gene structure and protected fragment generated in RNAse protection assays. (A) This diagram depicts the genomic structure of the human IL-10 gene and delineates unique restriction enzyme sites used to generate template cDNA for RNAse protection assays. (B) Probes generated for RNAse protection assays are as follows: (1) a completely processed 201-bp PvuII/Cla I fragment including a portion of exon II, all of exon III, and a portion of exon IV, and three incompletely processed protected fragments including a 197-bp portion of exon II and the complete exon III, a 157bp fragment including all of exon III and a portion of exon IV, and a 153-bp fragment consisting of exon III only. The probe used in RNAse protection half-life assays (2) was a 155-bp BstEII/Cla I fragment which included the majority of exon III and a small portion of exon IV.
This composite figure depicts a representative RNAse protection assay (left panel) demonstrating actinomycin D half-life of IL-10 transcripts in PBMNCs from an adult (upper gel) and from a term neonate (lower gel). Total cellular RNA was obtained at 10 hours of culture in the absence of stimuli (control) and in the presence of LPS (1 μg/mL). Following 10 hours of culture actinomycin D was added and RNA isolated at time 0, 15, 30, 60, and 90 minutes after its addition to the culture media. The RNA was subsequently hybridized to human IL-10 and β-actin probes. The right panel shows a linear regression analysis of IL-10 transcript half-life derived from unstimulated (C) and LPS-induced blood mononuclear cells of adult origin (n = 8) and of neonatal origin (n = 10) at various time points (0, 15, 30, 60, and 90 minutes) following addition of actinomycin D. Points representing mean of relative IL-10 transcript content (densitometric ratio of IL-10 to β-actin) plotted versus time are illustrated with adult values being represented by the closed circles, term values being represented by closed squares.
This composite figure depicts a representative RNAse protection assay (left panel) demonstrating actinomycin D half-life of IL-10 transcripts in PBMNCs from an adult (upper gel) and from a term neonate (lower gel). Total cellular RNA was obtained at 10 hours of culture in the absence of stimuli (control) and in the presence of LPS (1 μg/mL). Following 10 hours of culture actinomycin D was added and RNA isolated at time 0, 15, 30, 60, and 90 minutes after its addition to the culture media. The RNA was subsequently hybridized to human IL-10 and β-actin probes. The right panel shows a linear regression analysis of IL-10 transcript half-life derived from unstimulated (C) and LPS-induced blood mononuclear cells of adult origin (n = 8) and of neonatal origin (n = 10) at various time points (0, 15, 30, 60, and 90 minutes) following addition of actinomycin D. Points representing mean of relative IL-10 transcript content (densitometric ratio of IL-10 to β-actin) plotted versus time are illustrated with adult values being represented by the closed circles, term values being represented by closed squares.
Nuclear processing of IL-10 mRNA.Nuclear processing of transcripts has been shown to be a point of regulation of gene expression of several species of mRNA.32-34 We evaluated the ratio of unprocessed to processed IL-10 transcripts in adult and neonatal PBMNCs by RNAse protection assay (Fig 7). The ratio of unprocessed to processed IL-10 mRNA was not different between adult PBMNCs (0.38 ± 0.15), and term (0.29 ± 0.05) and preterm cells (0.35 ± 0.09), n = 3.
This RNAse protection assay demonstrates the relative proportion of processed IL-10 mRNA (201 bp) unprocessed IL-10 transcripts (197, 157, and 153 bp species) in total cellular RNA derived from the IL-10 nonproducing cell line, HTB9 (C), and from LPS-stimulated PBMNCs of preterm, term, and adult subjects. β-actin is included to assess equality of RNA loading. This is a representative blot including two of three experiments performed on cells from preterm, term, and adult subjects.
This RNAse protection assay demonstrates the relative proportion of processed IL-10 mRNA (201 bp) unprocessed IL-10 transcripts (197, 157, and 153 bp species) in total cellular RNA derived from the IL-10 nonproducing cell line, HTB9 (C), and from LPS-stimulated PBMNCs of preterm, term, and adult subjects. β-actin is included to assess equality of RNA loading. This is a representative blot including two of three experiments performed on cells from preterm, term, and adult subjects.
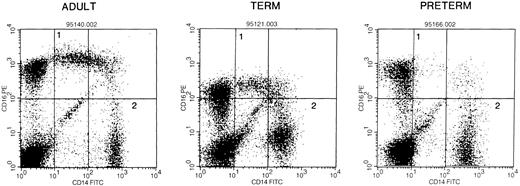
Proportions of monocyte and lymphocyte are not different in mononuclear cells derived from adults and neonates, but monocyte subsets differ between adult and preterm neonatal cells.The proportions of monocytes and lymphocytes in PBMNCs of adult, term, and preterm origin were determined by FACS by analyzing forward scatter and CD14 and CD45 surface markers. Adult samples contained 10% ± 5% monocytes (mean ± SD), term samples 16% ± 9%, and preterm samples 9% ± 4% monocytes. The proportion of lymphocytes in peripheral blood mononuclear cells was 64% ± 28% in adult, 59% ± 23% in term, and 59% ± 29% in preterm samples. Since our studies demonstrate diminished IL-10 production by stimulated monocytes from term and preterm blood compared with that by adult cells in vitro, we examined the proportions of a subpopulation of monocytes, CD14+/CD16++, reported to produce low quantities of cytokines.35 We found no differences between adults and term neonates in the proportion of this monocyte subpopulation; however, a significantly smaller proportion of monocytes derived from preterm individuals was CD14+/CD16++, P < .05 versus adults (Fig 8).
Composite FACS images of PBMNCs stained with antihuman CD14 FITC and anti-CD16 PE to determine the proportion of CD16++/CD14+ (region 1) to total CD14++ monocytes (region 2) in blood derived from adults (6), and from term (3) and preterm neonatal individuals (6). The proportion of CD14+CD16++ to CD14++ cells is as follows: adults, 23% ± 19%; term, 19% ± 4%; preterm, 4% ± 2%. (P < .05 v adult.)
Composite FACS images of PBMNCs stained with antihuman CD14 FITC and anti-CD16 PE to determine the proportion of CD16++/CD14+ (region 1) to total CD14++ monocytes (region 2) in blood derived from adults (6), and from term (3) and preterm neonatal individuals (6). The proportion of CD14+CD16++ to CD14++ cells is as follows: adults, 23% ± 19%; term, 19% ± 4%; preterm, 4% ± 2%. (P < .05 v adult.)
DISCUSSION
Cytokines play a central role in orchestrating inflammatory and immunologic effector mechanisms. Distinct differences have been observed in cytokine expression between immature and fully mature animals and humans. These differences might account, in part, for differences in immunologic competence observed at different stages of development. We have previously reported diminished production of IL-6 and IL-8 in vitro by neonatal monocytes, and production of G-CSF in vitro and in vivo in human neonates.24-27 Other investigators have demonstrated diminished production of interferon-γ, IL-3, and GM-CSF by cells from human neonates.27-29 In this study we report that IL-10 production by LPS-activated neonatal PBMNCs and by monocytes is diminished compared with that by adult cells (Fig 1).
We sought to delineate the molecular mechanisms responsible for the developmental differences observed in IL-10 gene expression. The IL-10 gene contains several putative transcriptional control motifs including glucocorticoid responsive elements, a cAMP responsive element, and candidate AP-1 and NFκB binding sites.18 19 Ontologic differences in transcription factors interacting with these elements could decrease IL-10 production through differential transcription. We evaluated IL-10 transcription rates in nuclei derived from human blood mononuclear cells (Fig 2) and found that active IL-10 transcription was present in freshly isolated PBMNCs from both neonates and adults. Cells cultured for 3 and for 6 hours in the presence or absence of LPS also exhibited active transcription of the IL-10 gene; however, transcription was not increased over that observed in freshly isolated or unstimulated cells. Thus, upregulation of IL-10 production and gene expression is likely attributable to posttranscriptional mechanisms.
No significant differences were observed in IL-10 gene transcription between neonatal and adult cells; therefore, we reasoned that developmental differences in posttranscriptional mechanisms of IL-10 regulation would probably account for maturational differences in IL-10 synthesis. Since Northern blot analyses (Figs 3 and 4) demonstrated reduced IL-10 mRNA content in neonatal cells compared with adult cells, we evaluated IL-10 mRNA stability using actinomycin D half-life studies. Northern blot analysis was not sensitive enough to resolve IL-10 transcripts in term and preterm neonatal cells in order to generate mRNA half-life curves (Fig 4). RNAse protection assays (Fig 6) were sufficiently sensitive to enable resolution of IL-10 mRNA from both adult and term neonatal cells. Although IL-10 mRNA content was found to be less in term neonatal cells than in adult cells, as demonstrated by Northern blot analysis and RNAse protection, we observed no differences in IL-10 mRNA half-life between neonatal and adult blood cells (Fig 6). In most instances, IL-10 transcripts were undetectable in preterm neonatal cells. In those samples in which IL-10 transcripts were detected, the abundance of these transcripts was not sufficient to determine mRNA half-life.
While posttranscriptional mechanisms have been implicated in the regulation of other cytokine genes,27 actinomycin D half-life studies reported here do not support mRNA stability as accounting for observed differences in IL-10 gene expression. The present studies do not exclude the possibility that mRNA stability could contribute to the differences observed in IL-10 synthesis between PBMNCs of adult and preterm individuals.
Modulation of gene expression by posttranscriptional mechanisms such as nuclear processing, nucleocytoplasmic transport, or mRNA stability is generally recognized to be a major control point providing a powerful means of controlling gene expression during growth and differentiation. Specific cis-acting elements within the mRNA sequence have been identified in mRNAs encoding cytokines, lymphokines, and transcription factors, which influence the nuclear processing and stability of particular transcripts.20,23,36 One motif of particular interest is the adenylate/uridylate-rich element (ARE) found in the 3′ untranslated portion of the IL-10 gene. AU binding factors (AUBF ) have been shown to facilitate the efflux of capped, polyadenylated, AU+ mRNA from the nucleus.36,37 Similar sequences have been shown to facilitate nuclear transport and to destabilize sequences when ligated to long-lived mRNA species.20 36 RNA-binding proteins have been characterized that bind to AU-rich elements in the 3′ untranslated portion of the GM-CSF and c-myc transcripts20,23,38; however, similar trans-acting factors binding to the IL-10 transcript have not been described to date. Our current studies demonstrate no significant difference in the nuclear processing of IL-10 transcripts. Nucleo-cytoplasmic transport of IL-10 mRNA remains to be evaluated.
An alternative mechanism that could account for differences in IL-10 synthesis between adult and neonatal individuals is that PBMNCs contain subpopulations such that one subpopulation produces cytokines well and the other produces them poorly. The proportion of high cytokine producing PBMNC subpopulations might be greater in adults. While no significant differences were noted in the proportion of monocytes and lymphocytes between adult and neonatal PBMNCs in this study, it is possible that differences in monocyte or lymphocyte subsets could account for developmental differences in cytokine production. Experiments by Kriegsmann and Brauer provide precedence for subpopulations of macrophages displaying different patterns of LPS binding.39 Other groups of investigators have defined subpopulations of blood monocytes based on differences in cell size or surface antigen phenotype, which exhibit markedly different capacities to produce certain cytokines.35,40,41 For example, Ziegler-Heitbrock et al identified subpopulations of monocyte, CD14++, that were high producers of IL-1, IL-6, and TNF and other monocytes, CD14+/CD16++, that were low cytokine producers.35 In the present work we found that LPS-stimulated adult monocytes produced greater quantities of IL-10 than neonatal monocytes in vitro. We evaluated the proportion of CD14+/CD16++ to CD14++ monocytes in adult and neonatal PBMNCs and found no differences in the proportion of CD14+/CD16++ to CD14++ monocytes between adults and term neonates. On the contrary, preterm neonatal PBMNCs contained a significantly smaller population of CD14+/CD16++ monocytes. These cells resemble mature monocytic cells such as tissue macrophages.42 While differences in IL-10 production between adults and term neonates cannot be explained by the relative proportions of CD14+/CD16++ and CD14++ monocytes, if these cells are high IL-10–producing cells, they could contribute, in part, to developmental differences in IL-10 production observed between adults and preterm infants. Perhaps other subpopulations of monocytes and lymphocytes are present such that the proportion of high cytokine producing cells is greater in the adult blood than in the neonatal blood. Indeed, work by other investigators has demonstrated maturational differences in the production of IL-10 by T lymphocytes; however, no subsets of high and low IL-10–producing T lymphocytes have been identified accounting for these differences.43
We conclude that up-regulation of IL-10 gene expression in blood mononuclear leukocytes is modulated at the post-transcriptional level and that differences in IL-10 gene expression between adults and neonates are not mediated at the level of transcription, nuclear processing, or mRNA stability. Our results provide indirect evidence that developmental differences in IL-10 gene expression might be due, at least in part, to differences in subsets of IL-10–producing and non-producing cells such that adult blood contains proportionately more IL-10–producing blood cells than does neonatal blood. The present studies do not exclude the alternative possibility that differences in IL-10 production between adults and neonates could be secondary to differences in nucleo-cytoplasmic transport of IL-10 transcripts.
ACKNOWLEDGMENT
We thank Dr Paulo Vieira and Dr De Waal Malefyt, DNAX Research Institute, for providing the human IL-10 cDNA and for information regarding the genomic structure of human IL-10. Also, we thank Dr Kohan, University of Utah, for providing the human SNURP1 cDNA, and the Clinical Research Center scatter bed pediatric nursing staff (Dixie Thompson, RN, Karen Osborne, RN, and Shawna Baker, RN) for obtaining the umbilical cord blood and adult blood.
Supported by Grants No. HD-01006, HD-27827, DK-49219, and RR-00064 from the National Institutes of Health.
Address reprint requests to Kurt R. Schibler, MD, Department of Pediatrics, University of Utah School of Medicine, 50 N Medical Dr, Room 2C454, Salt Lake City, UT 84132.

This feature is available to Subscribers Only
Sign In or Create an Account Close Modal