Key Points
NG2 is an epigenetically regulated direct target gene of the leukemic MLL-AF4 fusion protein.
NG2 negatively regulates the expression of the glucocorticoid receptor NR3C1, conferring glucocorticoid resistance to MLLr B-ALL cells.
Visual Abstract
B-cell acute lymphoblastic leukemia (B-ALL) is the most common pediatric cancer, with long-term overall survival rates of ∼85%. However, B-ALL harboring rearrangements of the MLL gene (also known as KMT2A), referred to as MLLr B-ALL, is common in infants and is associated with poor 5-year survival, relapses, and refractoriness to glucocorticoids (GCs). GCs are an essential part of the treatment backbone for B-ALL, and GC resistance is a major clinical predictor of poor outcome. Elucidating the mechanisms of GC resistance in MLLr B-ALL is, therefore, critical to guide therapeutic strategies that deepen the response after induction therapy. Neuron-glial antigen-2 (NG2) expression is a hallmark of MLLr B-ALL and is minimally expressed in healthy hematopoietic cells. We recently reported that NG2 expression is associated with poor prognosis in MLLr B-ALL. Despite its contribution to MLLr B-ALL pathogenesis, the role of NG2 in MLLr-mediated leukemogenesis/chemoresistance remains elusive. Here, we show that NG2 is an epigenetically regulated direct target gene of the leukemic MLL-ALF transcription elongation factor 4 (AF4) fusion protein. NG2 negatively regulates the expression of the GC receptor nuclear receptor subfamily 3 group C member 1 (NR3C1) and confers GC resistance to MLLr B-ALL cells. Mechanistically, NG2 interacts with FLT3 to render ligand-independent activation of FLT3 signaling (a hallmark of MLLr B-ALL) and downregulation of NR3C1 via activating protein-1 (AP-1)–mediated transrepression. Collectively, our study elucidates the role of NG2 in GC resistance in MLLr B-ALL through FLT3/AP-1–mediated downregulation of NR3C1, providing novel therapeutic avenues for MLLr B-ALL.
Introduction
B-cell acute lymphoblastic leukemia (B-ALL) is the most common childhood cancer1 and is typically treated with regimens based on glucocorticoids (GCs), L-asparaginase (L-Asp), and other cytostatic agents, such as vincristine (VCR). These protocols have greatly improved outcomes, achieving complete remission rates of >95% and 5-year disease-free survival rates of ∼85% in pediatric B-ALL.2 However, infant B-ALL (iB-ALL; <1 year of age) is associated with limited response to therapy and poor outcome.3 Chromosomal rearrangements involving the MLL gene (also known as KMT2A) account for ∼80% of iB-ALL cases,4 and the prognosis of infants with mixed lineage leukemia (MLL)-rearranged (MLLr) B-ALL, particularly t(4;11)/MLL-AF4 (KMT2A-AFF1), is dismal.5,6
GC resistance is the most important factor contributing to poor outcome in patients with MLLr B-ALL.7-9 GCs, such as dexamethasone (DX) and prednisolone, are part of the chemotherapy backbone for B-ALL because of their strong proapoptotic activity against lymphoid blasts, which is mediated through engagement with the GC receptor (GCR) NR3C1.3,10 NR3C1, a nuclear receptor and transcription factor, triggers gene transcription, including its own, via GC-responsive elements on GC binding.11-13 However, activated NR3C1 can be inhibited by other transcription factors, such as activating protein-1 (AP-1) or nuclear factor-ĸB.14 As GCs are indispensable in the treatment of MLLr B-ALL, understanding the mechanisms of GC resistance is crucial. Although pharmacologic strategies targeting genetic aberrations, such as phosphatidylinositol 3-kinase (PI3K)15,16 or FLT317,18 inhibitors, have been proposed to overcome GC resistance in ALL, the precise mechanism of resistance in MLLr B-ALL remains elusive.
Chondroitin sulfate proteoglycan-4, also known as neuron-glial antigen-2 (NG2), is a transmembrane proteoglycan that is minimally expressed in healthy hematopoietic cells,19,20 but is expressed in ∼90% of patients with MLLr B-ALL.19,21-24 This feature has been listed as common but not specific in diagnostic algorithms for routine leukemia immunophenotyping because of its predictive value in MLLr leukemias.23,24 We have previously reported that NG2 expression correlates with relapse rates and poor prognosis in MLLr B-ALL19-21,25; however, despite its contribution to the pathogenesis of MLLr B-ALL and its association with chemoresistance in solid tumors,26 its role in chemoresistance in MLLr B-ALL remains unstudied. Understanding these mechanisms may lead to innovative therapies for this high-risk leukemia.
Here, we show that NG2 is a direct target gene of the leukemic MLL-AF4 fusion protein, is epigenetically regulated, and is associated with GC resistance. NG2 negatively regulates NR3C1, thereby conferring GC resistance in MLLr iB-ALL cells by disrupting GC-induced apoptosis. Mechanistically, NG2 interacts with the receptor tyrosine kinase FLT3, leading to ligand-independent activation of FLT3 signaling (a hallmark pathogenic feature of MLLr B-ALL)27,28 and subsequent downregulation of NR3C1 through the AP-1 complex, an established transrepressor downstream of FLT3. Our study establishes a new MLL-AF4 target gene and elucidates a novel mechanism of GC resistance, opening the way to new therapeutic targets for MLLr B-ALL.
Materials and methods
Patient samples and primary CD34+ cells
Leukemic samples from 7 infants with t(4;11)/MLL-AF4+ B-ALL, confirmed by complete immunophenotypic and molecular/cytogenetic diagnosis, were available. Mononuclear cells with >87% MLLr blasts were isolated by density gradient centrifugation (Ficoll-Hypaque; Amersham Biosciences, Uppsala, Sweden) and immunophenotyped using the monoclonal antibodies CD45–fluorescein isothiocyanate (FITC), CD19-allophycocyanin (APC) (BD Biosciences, San Jose, CA), and NG2-phycoerythrin (Beckman, Barcelona, Spain). NG2POS and NG2NEG blast populations were isolated by fluorescence-activated cell sorting (FACS) using a FACSAria Fusion cell sorter (BD Biosciences). Healthy CD34+ cells were isolated from both human fetal liver and cord blood samples using the CD34 MicroBead Kit (Miltenyi Biotec, Bergisch Gladbach, Germany).29-31 An independent cohort of 47 infants with MLLr B-ALL, all treated according to the International Collaborative Treatment Protocol for the Infants Under One Year with Acute Lymphoblastic (INTERFANT) treatment protocols, was included to validate the impact of NG2 on GC resistance.
Genome-edited SEM cells and CD34+ cells and lentiviral overexpression
The SEM cell line was purchased from the DSMZ (Braunschweig, Germany). NG2WT SEM cells stably expressing dTomato-Luciferase were generated using the lentiviral pUltra-Chili-Luc backbone (Addgene, number 48688).32 NG2KO cells were generated by CRISPR-mediated genome editing (single-guide RNAs are listed in supplemental Table 1 [available on the Blood website]). SEM cells stably overexpressing NG2 (NG2OE) were generated using lentivirus Lenti-NG2 in NG2WT cells with the Lenti-Cas9-Blast vector (Addgene, number 52962) as the backbone. AP-1KO SEM cells and MLL-AF4–expressing CD34+ cells were generated by CRISPR-mediated genome editing.28,33
Cytotoxicity and apoptosis assays
Cytotoxicity of drugs against MLLr B-ALL cells was assessed using the Cell Proliferation Reagent WST-1 (Roche Diagnostics, Manheim, Germany).34,35 In total, 5 × 10⁴ NG2POS and NG2NEG sorted MLLr B-ALL blasts were plated in a 96-well plate and incubated with increasing concentrations of the corresponding drugs for 48 hours.25,36 Also, cell viability was measured using the Annexin-V/7-AAD Apoptosis Detection Kit (BD Biosciences) on a FACS Canto-II cytometer.25,34,37
Ex vivo response of MLLr-B-ALL primary cells to prednisolone
The ex vivo response to prednisolone was assessed by MTT assay (Roche Diagnostics) in 47 diagnostic samples from patients with MLLr-B-ALL uniformly treated with the INTERFANT protocol.38 Results were considered evaluable only if the mean control optical density on day 4 exceeded 0.05 arbitrary units after background correction. Prednisolone (Bufa, Uitgeest, The Netherlands) was tested in the range 0.08 to 250 μg/ml. Cutoff lethal concentration 50 (LC50) values were applied to define prednisolone sensitivity, as described.39
Cell lines and patient-derived xenografts
Eight- to 14-week-old NOD-Cg-Prkdcscid Il2rgtm1Wjl/SzJ (NSG) mice (The Jackson Laboratory, Bar Harbor, ME) were housed under pathogen-free conditions at the animal facility of the Barcelona Biomedical Research Park. Mice (n = 30) were intravenously transplanted with 2.5 × 10⁵ Luc-GFP-NG2WT or NG2KO SEM cells, and tumor burden was monitored by weekly analysis of peripheral blood (PB). Human grafts were immunophenotyped by flow cytometry using HLA-ABC-FITC (clone G46-2.6), CD45-FITC (clone HI30), and CD19-APC (clone HIB19) antibodies (all from BD Biosciences). When engraftment was ∼2% to 5% in PB (between weeks 3 and 4, depending on the engraftment kinetics of NG2WT or NG2KO SEM cells), mice were homogeneously divided into the following treatment groups: (i) control, (ii) VXL (VCR/DX/L-Asp)–based standard induction, and (iii) DX alone. Treatment schedules were as follows: VCR (0.15 mg/kg) once weekly intraperitoneally (i.p.) for 2 weeks and DX (5 mg/kg) and L-Asp (1000 U/kg) once daily i.p. for 5 days/week for 2 weeks. Mice were sacrificed at the end of the induction treatment (day 13), and the percentage of SEM cells in PB was analyzed by FACS.
To test the efficacy of the pharmacologic inhibition of both FLT3 and AP-1 in sensitizing to DX and standard induction therapy in vivo, MLL-AF4+ patient-derived xenografts or primary samples were transplanted intratibially into sublethally irradiated (2.25 Gy) NSG mice, as described.21,25,28 When human engraftment was >1% in PB, mice were homogeneously distributed into different groups for treatment initiation (day 0). Treatment included DX alone, the FLT3 inhibitors sorafenib (30 mg/kg, oral daily administration for 2 weeks) or midostaurin (50 mg/kg oral daily administration for 2 weeks) alone, the AP-1 inhibitor T5224 (100 mg/kg i.p. daily for 2 weeks) alone, combinations of DX with sorafenib, midostaurin, or T5224, VXL, and VXL in combination with sorafenib. Mice were sacrificed at the end of treatment (day 13 or 20), and human engraftment in PB or BM was analyzed by FACS.
Statistical analyses
Data are expressed as mean ± standard error of the mean of several independent experiments unless otherwise specified. Statistical comparisons were made using the unpaired Student t-test. Differences between treatments along the days in cytotoxicity assays were performed using a multiple t-test. Statistical analyses, normality test (Shapiro-Wilk), 50% inhibitory concentration, and area under the curve measurements were performed using GraphPad Prism version 6.0 (GraphPad Software Inc, San Diego, CA). Statistical significance was defined as P < .05.
Detailed technical information on immunofluorescence, reverse transcription polymerase chain reaction (PCR), real-time quantitative PCR, immunoblotting, DNA methylation editing, immunoprecipitation and mass spectrometry (MS), in silico NG2-FLT3 modeling, ImageStream imaging flow cytometry, single-cell RNA sequencing (scRNA-Seq), and data availability can be found in the supplemental Material/Methods.
Study approval
The study was conducted in accordance with the Declaration of Helsinki. Human samples were collected on informed consent and approval by the Barcelona Clinic Hospital Research Ethics Committee, and the study was approved by the same committee (HCB/2021/0095). Human embryonic and fetal material was provided by the Joint Medical Research Council/Wellcome Trust (grant number MR/R006237/1) Human Developmental Biology Resource (http://hdbr.org). All animal procedures were performed in compliance with the Institutional Animal Care Committee of the Barcelona Biomedical Research Park (HRH-17-0045-P2).
Results
NG2 expression is regulated by direct binding of the MLL-AF4 fusion protein
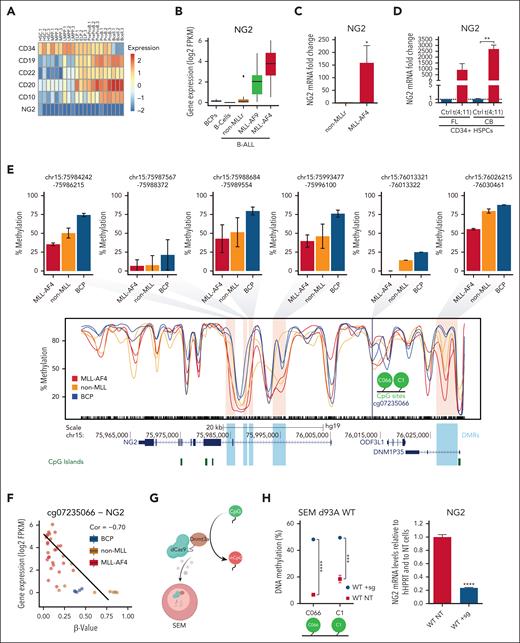
NG2 expression is a hallmark of MLLr B-ALL,19,21-24 but little is known about its role in leukemogenesis and how its expression is regulated. We analyzed NG2 expression in scRNA-Seq data from 2 independent studies.40,41 In contrast to other known hematopoietic differentiation markers, NG2 was not expressed at any stage during normal B-cell differentiation (Figure 1A; supplemental Figure 1). We next evaluated NG2 expression in healthy B-cell progenitors and B cells, and in MLL germ line B-ALL (non-MLLr) and MLLr B-ALL (MLL-AF9 and MLL-AF4) patient samples by RNA-seq,29 finding higher expression in the context of MLLr leukemias, particularly MLL-AF4+ (Figure 1B). Orthogonal validations confirmed this result (Figure 1C), in line with published data.19-21,25 NG2 expression was also evaluated in nonleukemic cell lines (293T, U87, and HeLa), acute myeloid leukemia cell lines with MLL-AF9 and MLL-AF4, or without MLLr (MOLM13, MV4;11, and HL60, respectively), and MLL-AF4+ B-ALL cell lines (RS4;11 and SEM), which revealed high and specific expression of NG2 in MLL-AF4+ B-ALL cells (supplemental Figure 2). In addition, we generated the t(4;11)/MLL-AF4 fusion in healthy fetal liver– and cord blood–derived CD34+ cells using CRISPR/Cas9 editing.33 Quantitative reverse transcription PCR and RNA-seq analysis showed that NG2 expression was specifically and massively upregulated in MLL-translocated cells (Figure 1D; supplemental Figure 2), in line with a recent independent study.47
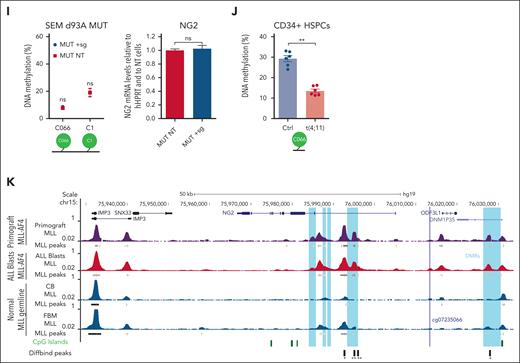
NG2 is a direct target of MLL-AF4 fusion protein in iB-ALL. (A) scRNA-seq heat map depicting the expression of various B-cell differentiation markers and NG2 in the indicated populations across human fetal B-cell differentiation (data from O'Byrne et al40). (B) Box plots showing NG2 expression in the indicated normal or leukemic B cells (n = 44 patients, data from Agraz-Doblas et al29). (C) Quantitative PCR (qPCR) analysis comparing NG2 expression in leukemic cells from patients with B-ALL with MLL germ line or MLL-AF4 (n = 6). (D) qPCR analysis of NG2 expression in MLL-AF4+ genome-edited fetal live (FL) and cord blood (CB) CD34+ cells. (E) Methylation levels (β value) across NG2 in normal B-cell progenitors (BCPs) and MLL germ line and MLL-AF4 leukemic cells, inferred from whole-genome bisulfite sequencing (WGB-seq) data (data from Tejedor et al28). Bar plots depict the average DNA methylation level of the differentially methylated regions (DMRs) or differentially methylated promoters (DMPS) observed in the indicated conditions. (F) Scatter plot showing the correlation between DNA methylation and gene expression of NG2. (G) Experimental design of the dCas9-DNMT3A methylation editing approach. (H) DNA methylation levels at the indicated CpG residues (C066 and C1) in dCas9-DNMT3AWT-targeted SEM cells (WT + sg) and nontargeted SEM cells (WT NT) (left panel). Right panel shows NG2 expression by qPCR in dCas9-DNMT3AWT-targeted and nontargeted SEM cells. (I) DNA methylation levels (left panel) and NG2 expression (right panel) of dCas9-DNMT3AMUT-targeted SEM cells (MUT + sg) and nontargeted SEM cells (MUT NT). (J) DNA methylation levels in MLL-AF4+ genome-edited CD34+ HSPCs. (K) Representative MLL chromatin immunoprecipitation–sequencing (ChIP-seq) tracks at NG2 gene in MLLr primografts, MLL-AF4+ B-ALL blasts, and healthy CB and fetal bone marrow (FBM) (data from Godfrey et al42-46). ∗P < .05, ∗∗P < .01, ∗∗∗P < .001, unpaired Student t test. Ns, not significant.
NG2 is a direct target of MLL-AF4 fusion protein in iB-ALL. (A) scRNA-seq heat map depicting the expression of various B-cell differentiation markers and NG2 in the indicated populations across human fetal B-cell differentiation (data from O'Byrne et al40). (B) Box plots showing NG2 expression in the indicated normal or leukemic B cells (n = 44 patients, data from Agraz-Doblas et al29). (C) Quantitative PCR (qPCR) analysis comparing NG2 expression in leukemic cells from patients with B-ALL with MLL germ line or MLL-AF4 (n = 6). (D) qPCR analysis of NG2 expression in MLL-AF4+ genome-edited fetal live (FL) and cord blood (CB) CD34+ cells. (E) Methylation levels (β value) across NG2 in normal B-cell progenitors (BCPs) and MLL germ line and MLL-AF4 leukemic cells, inferred from whole-genome bisulfite sequencing (WGB-seq) data (data from Tejedor et al28). Bar plots depict the average DNA methylation level of the differentially methylated regions (DMRs) or differentially methylated promoters (DMPS) observed in the indicated conditions. (F) Scatter plot showing the correlation between DNA methylation and gene expression of NG2. (G) Experimental design of the dCas9-DNMT3A methylation editing approach. (H) DNA methylation levels at the indicated CpG residues (C066 and C1) in dCas9-DNMT3AWT-targeted SEM cells (WT + sg) and nontargeted SEM cells (WT NT) (left panel). Right panel shows NG2 expression by qPCR in dCas9-DNMT3AWT-targeted and nontargeted SEM cells. (I) DNA methylation levels (left panel) and NG2 expression (right panel) of dCas9-DNMT3AMUT-targeted SEM cells (MUT + sg) and nontargeted SEM cells (MUT NT). (J) DNA methylation levels in MLL-AF4+ genome-edited CD34+ HSPCs. (K) Representative MLL chromatin immunoprecipitation–sequencing (ChIP-seq) tracks at NG2 gene in MLLr primografts, MLL-AF4+ B-ALL blasts, and healthy CB and fetal bone marrow (FBM) (data from Godfrey et al42-46). ∗P < .05, ∗∗P < .01, ∗∗∗P < .001, unpaired Student t test. Ns, not significant.
To explore the link between NG2 and MLL-AF4, we performed DNA methylation analysis in the vicinity of NG2. CpG sites located in the indicated differentially methylated regions of NG2, including the CpGs C066 and C1 (cg07235066), were specifically hypomethylated in MLL-AF4+ B-ALL samples (Figure 1E; supplemental Figure 2), with a significant negative correlation with NG2 expression (Figure 1F). We also used an epigenetic editing approach in MLL-AF4+ SEM cells with the catalytically inactivated CRISPR-associated protein 9 (dCas9) fused with DNA methyltransferase 3 alpha (DNMT3A); [dCas9-DNMT3A])–based system (Figure 1G). Cells transfected with single-guide RNAs targeting the indicated NG2 loci were significantly hypermethylated and correlated well with a decrease in NG2 expression in the context of the wild-type dCas9-DNMT3A construct (Figure 1H), but not the mutant form (Figure 1I). These results were reproducible in MLL-translocated CD34+ hematopoietic stem and progenitor cells (HSPCs), revealing a reduction in methylation following t(4;11) induction (Figure 1J; supplemental Figure 2), in line with the molecular changes in patients (Figure 1D) in the absence of additional genetic insults.
We further analyzed the chromatin immunoprecipitation–sequencing data sets of Godfrey et al42 using MLL-N binding as a proxy for MLL-AF4 fusion protein binding. MLL-AF4 was specifically bound to the gene body of NG2 in both primary leukemic blasts and primografts harboring MLL-AF4, but not in healthy CD34+ cells (Figure 1K). Similar results were observed in MLLr cell lines (KOPN8, RS4;11, and SEM) vs an MLL germline cell line (CCRF) (supplemental Figure 3). Strikingly, we observed a region marked with H3K27ac and H3K4me1 within the NG2 gene body in SEM cells (Figure S3), which are the histone modifications found at high levels at MLL-AF4 targets.28,48 Modulation of MLL-AF4 levels by shRNA negatively affected both MLL binding and H3K27ac levels in these regions (supplemental Figure 3), suggesting that epigenetic modulation mediated by MLL-AF4 binding may generate a new alternative promoter responsible for NG2 activation.
NG2 expression is involved in GC resistance in MLLr B-ALL
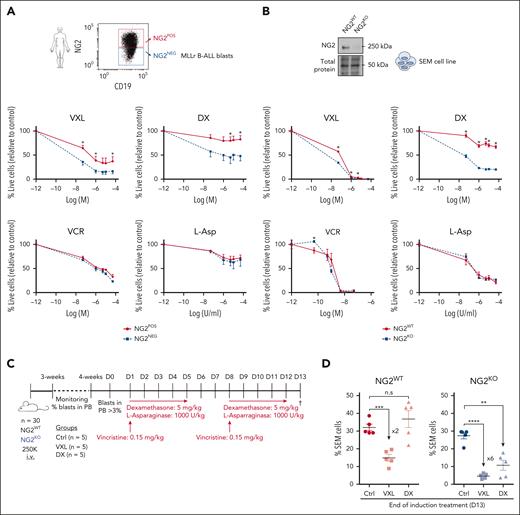
GCs are essential in the standard front-line treatment for B-ALL, particularly in cases involving MLLr.7-9,49 Considering its association with chemoresistance in solid tumors26 and its function as a target gene of the MLL-AF4 fusion in MLLr B-ALL, we investigated the potential role of NG2 in therapy resistance. Cytotoxicity assays on NG2POS and NG2NEG FACS-sorted blasts from patients with MLLr B-ALL revealed that NG2POS blasts exhibited greater resistance to standard VXL induction therapy, particularly DX (Figure 2A). The increased sensitivity to DX was confirmed in CRISPR-Cas9–edited NG2KO MLL-AF4+ SEM cells (Figure 2B).
NG2 confers GC resistance to MLLr B-ALL cells. (A) Primary NG2POS and NG2NEG MLLr B-ALL cells were FACS sorted and treated with increasing concentrations of dexamethasone (DX), vincristine (VCR), and L-asparaginase (L-Asp) alone or in combination (standard induction therapy, VXL). Percentage of live cells (7-aminoactinomycin D stain (7AAD)-/annexin- population by FACS) is shown for each treatment. Top panel shows a representative FACS dot plot of NG2 expression in leukemic cells from a patient with MLLr B-ALL. (B) Percentage of live cells in wild-type (NG2WT) and CRISPR-Cas9 knocked out (NG2KO) SEM cells treated as above. Top panel shows an immunoblot of NG2 protein levels in NG2WT and NG2KO SEM cells. (C) Experimental design for in vivo treatments using NG2WT and NG2KO SEM cells. (D) Percentage of SEM cells detected in transplanted mice at the end of treatment (day 13) in the indicated groups. Each point depicts a mouse. ∗P < .05, ∗∗P < .01, ∗∗∗P < .001, unpaired Student t test. Ns, not significant.
NG2 confers GC resistance to MLLr B-ALL cells. (A) Primary NG2POS and NG2NEG MLLr B-ALL cells were FACS sorted and treated with increasing concentrations of dexamethasone (DX), vincristine (VCR), and L-asparaginase (L-Asp) alone or in combination (standard induction therapy, VXL). Percentage of live cells (7-aminoactinomycin D stain (7AAD)-/annexin- population by FACS) is shown for each treatment. Top panel shows a representative FACS dot plot of NG2 expression in leukemic cells from a patient with MLLr B-ALL. (B) Percentage of live cells in wild-type (NG2WT) and CRISPR-Cas9 knocked out (NG2KO) SEM cells treated as above. Top panel shows an immunoblot of NG2 protein levels in NG2WT and NG2KO SEM cells. (C) Experimental design for in vivo treatments using NG2WT and NG2KO SEM cells. (D) Percentage of SEM cells detected in transplanted mice at the end of treatment (day 13) in the indicated groups. Each point depicts a mouse. ∗P < .05, ∗∗P < .01, ∗∗∗P < .001, unpaired Student t test. Ns, not significant.
In vivo studies with NSG mice transplanted with NG2KO or NG2WT MLL-AF4+ SEM cells (Figure 2C) corroborated these findings, demonstrating a more pronounced reduction in leukemic burden in NG2KO mice treated with DX alone or VXL (Figure 2D). Specifically, VXL treatment of mice transplanted with NG2KO cells resulted in a sixfold more pronounced decrease in leukemic burden compared with controls (4.6% ± 0.9% vs 27.4% ± 1.8%, in VXL and control groups, respectively) than that observed in mice transplanted with NG2WT cells (Figure 2D). Furthermore, DX alone caused a significant (threefold) decrease in leukemic burden in NG2KO-transplanted mice (10.7% ± 2.8% vs 27.4% ± 1.8%, in DX and control groups, respectively), in contrast to what was observed in NG2WT-transplanted mice. Overall, these findings demonstrate that NG2 expression confers GC resistance to MLL-AF4+ B-ALL cells, supporting its potential as a novel target for preventing GC therapy resistance.
NG2 mediates GC resistance in MLLr B-ALL by downregulating the expression of the GCR NR3C1
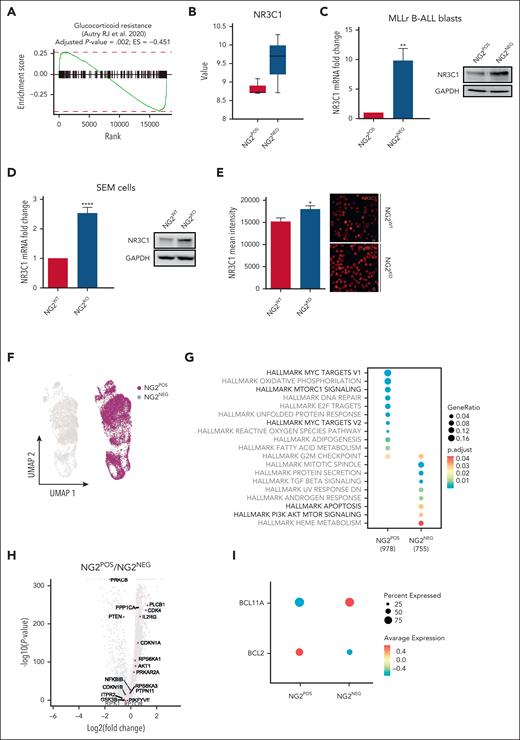
To gain insight into the mechanisms by which NG2 confers GC resistance to MLLr B-ALL cells, we first analyzed the Gene Set Enrichment Analysis data set for GC resistance50 in NG2POS and NG2NEG primary blasts FACS sorted from patients with MLLr B-ALL.21 Notably, NG2POS blasts exhibited enrichment of the GC resistance signature (Figure 3A), with significantly lower expression of NR3C1 compared with NG2NEG blasts (Figure 3B). This was confirmed by quantitative PCR, immunoblotting, and immunofluorescence analyses in both MLL-AF4+ primary B-ALL cells and in NG2WT and NG2KO SEM cells (Figure 3C-E), highlighting a link between NG2 expression and NR3C1 downregulation. We therefore hypothesized that the low levels of the canonical NR3C1 in NG2POS cells result in a failure to respond to GCs.
NG2 expression reduces the levels of the GCR NR3C1 and deregulates the downstream antiapoptotic PI3K/AKT/mTOR pathway in MLLr B-ALL cells. (A) Gene Set Enrichment Analysis (GSEA) for GC-resistance signature (Autry et al50) in FACS-sorted primary NG2POS and NG2NEG MLLr B-ALL blasts. (B) Gene expression microarray data showing NR3C1 expression in FACS-sorted primary NG2POS and NG2NEG blasts from patients with MLLr B-ALL (n = 3). (C,D) NR3C1 expression by qPCR (left panel) and protein expression by immunoblot (right panel) in FACS-sorted primary NG2POS and NG2NEG blasts from patients with MLLr B-ALL (n = 3) (C) and NG2WT and NG2KO MLL-AF4+ SEM cells (D). (E) Representative immunofluorescence image of NR3C1 expression in NG2WT and NG2KO MLL-AF4+ SEM cells (right panel) and quantification of the mean fluorescence intensity (left panel). (F) Uniform manifold approximation and projection (UMAP) representation of NG2POS and NG2NEG cells analyzed by scRNAseq in FACS-sorted MLLr B-ALL blasts. Each point on the UMAP plot represents an individual cell. (G) GSEA for hallmark signaling pathways from Molecular Signatures Database (MSigDB). Each dot represents a specific hallmark gene set, the size corresponds to the gene ratio, and the color represents the significance of each comparison. (H) Volcano plot depicting the most differentially expressed genes between NG2POS and NG2NEG cells. A positive fold change corresponds to genes overexpressed in the NG2POS population, and vice versa. Genes relevant in the PIK3/AKT/mTOR signaling pathways are indicated in purple. (I) Representation of BCL2 and BCL11A expression in NG2POS and NG2NEG cells. The size and the color of the circles correspond to the percentage of cells expressing the indicated gene and the average expression, respectively.
NG2 expression reduces the levels of the GCR NR3C1 and deregulates the downstream antiapoptotic PI3K/AKT/mTOR pathway in MLLr B-ALL cells. (A) Gene Set Enrichment Analysis (GSEA) for GC-resistance signature (Autry et al50) in FACS-sorted primary NG2POS and NG2NEG MLLr B-ALL blasts. (B) Gene expression microarray data showing NR3C1 expression in FACS-sorted primary NG2POS and NG2NEG blasts from patients with MLLr B-ALL (n = 3). (C,D) NR3C1 expression by qPCR (left panel) and protein expression by immunoblot (right panel) in FACS-sorted primary NG2POS and NG2NEG blasts from patients with MLLr B-ALL (n = 3) (C) and NG2WT and NG2KO MLL-AF4+ SEM cells (D). (E) Representative immunofluorescence image of NR3C1 expression in NG2WT and NG2KO MLL-AF4+ SEM cells (right panel) and quantification of the mean fluorescence intensity (left panel). (F) Uniform manifold approximation and projection (UMAP) representation of NG2POS and NG2NEG cells analyzed by scRNAseq in FACS-sorted MLLr B-ALL blasts. Each point on the UMAP plot represents an individual cell. (G) GSEA for hallmark signaling pathways from Molecular Signatures Database (MSigDB). Each dot represents a specific hallmark gene set, the size corresponds to the gene ratio, and the color represents the significance of each comparison. (H) Volcano plot depicting the most differentially expressed genes between NG2POS and NG2NEG cells. A positive fold change corresponds to genes overexpressed in the NG2POS population, and vice versa. Genes relevant in the PIK3/AKT/mTOR signaling pathways are indicated in purple. (I) Representation of BCL2 and BCL11A expression in NG2POS and NG2NEG cells. The size and the color of the circles correspond to the percentage of cells expressing the indicated gene and the average expression, respectively.
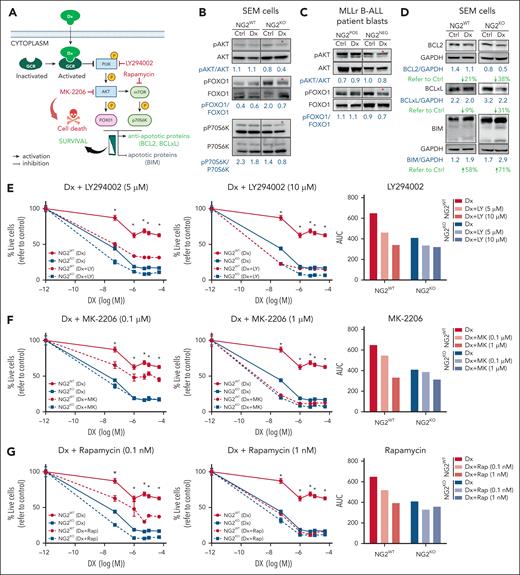
To further investigate this, we performed scRNA-seq on NG2POS and NG2NEG FACS-sorted primary blasts (Figure 3F). Gene Set Enrichment Analysis revealed differential expression of genes associated with the PI3K/AKT/mammalian target of rapamycin (mTOR) pathways between NG2POS and NG2NEG cells (Figure 3G). Key genes, including PTEN, AKT, RPTOR, and GSK3B, showed the most significant differential expression (Figure 3H). Additionally, NG2POS cells exhibited upregulation of the antiapoptotic gene BCL2 and downregulation of the proapoptotic gene BCL11A (Figure 3I), suggesting a potential role of the PI3K pathway in NG2-mediated GC resistance. Indeed, previous studies have shown that GC leads to a significant decrease in PI3K/AKT pathway activation and downstream apoptotic proteins, such as B-cell lymphoma (BCL)11/BIM and BCL2/BCL extra large (XL) (Figure 4A).51-53 The low levels of NR3C1 and the enrichment of PI3K-related features in NG2POS cells prompted us to investigate the impact of GC on PI3K signaling in NG2-mediated GC resistance in MLLr B-ALL.
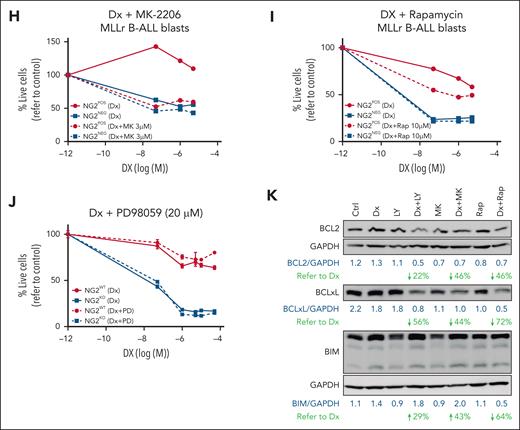
NG2 impairs the inhibition of the antiapoptotic PI3K/AKT/mTOR pathway in response to DX in MLLr B-ALL cells resulting in GC resistance. (A) Schematic representation of the GCR intracellular effects on the PI3K/AKT/mTOR pathway and the chemical inhibitors used to block the PI3K pathway (indicated in red color). (B-C) Immunoblots depicting the phosphorylation status of PI3K downstream members in both NG2WT and NG2KO SEM cells (B), as well as in NG2POS and NG2NEG MLLr B-ALL patient blasts in response to DX (C). (D) Immunoblots showing the levels of BCL2 family proteins in NG2WT and NG2KO SEM cells in response to DX are shown. Total protein levels are also shown. (E-G) Sensitization effect in response to DX of the indicated PI3K/AKT/mTOR pathway inhibitors at the indicated concentrations in NG2WT and NG2KO SEM cells. Right panels show area under the curve (AUC) for each viability curve. (H,I) Sensitization effect of MK-2206 (H) and rapamycin (I) in MLLr B-ALL blasts. (J) The MEK inhibitor PD98059 was used as a control for the absence of sensitization to DX. (K) Immunoblots showing the effect of PI3K/AKT/mTOR inhibitors alone or in combination with DX on BCL2 family proteins in NG2WT MLL-AF4+ SEM cells. ∗P < .05, ∗∗P < .01, ∗∗∗∗P < .0001, unpaired Student t test. Ns, not significant.
NG2 impairs the inhibition of the antiapoptotic PI3K/AKT/mTOR pathway in response to DX in MLLr B-ALL cells resulting in GC resistance. (A) Schematic representation of the GCR intracellular effects on the PI3K/AKT/mTOR pathway and the chemical inhibitors used to block the PI3K pathway (indicated in red color). (B-C) Immunoblots depicting the phosphorylation status of PI3K downstream members in both NG2WT and NG2KO SEM cells (B), as well as in NG2POS and NG2NEG MLLr B-ALL patient blasts in response to DX (C). (D) Immunoblots showing the levels of BCL2 family proteins in NG2WT and NG2KO SEM cells in response to DX are shown. Total protein levels are also shown. (E-G) Sensitization effect in response to DX of the indicated PI3K/AKT/mTOR pathway inhibitors at the indicated concentrations in NG2WT and NG2KO SEM cells. Right panels show area under the curve (AUC) for each viability curve. (H,I) Sensitization effect of MK-2206 (H) and rapamycin (I) in MLLr B-ALL blasts. (J) The MEK inhibitor PD98059 was used as a control for the absence of sensitization to DX. (K) Immunoblots showing the effect of PI3K/AKT/mTOR inhibitors alone or in combination with DX on BCL2 family proteins in NG2WT MLL-AF4+ SEM cells. ∗P < .05, ∗∗P < .01, ∗∗∗∗P < .0001, unpaired Student t test. Ns, not significant.
We first investigated a well-known and rapid (cytoplasmic) consequence of activated GCR on PI3K signaling and apoptotic protein regulation in response to GC treatment.52-54 PI3K pathway phosphorylation in NG2WT and NG2KO MLL-AF4+ SEM cells (Figure 4B) and in NG2-sorted patient blasts (Figure 4C) was examined in response to DX treatment as an indicator of GCR activity. NG2KO cells, but not NG2WT cells, exhibited decreased phosphorylation of the PI3K downstream targets AKT, forkhead box O1 (FOXO1), and P70S6K, suggesting correct GCR function and consequent sensitization against DX (Figure 4B,C). Subsequently, we assessed the levels of downstream antiapoptotic and proapoptotic proteins in response to DX treatment in MLLr B-ALL cells, finding a greater decrease in expression of the antiapoptotic proteins BCL2 and BCLXL in NG2KO cells (38% vs 21% for BCL2 and 31% vs 9% for BCLXL in NG2KO and NG2WT cells, respectively) accompanied by increased levels of proapoptotic BIM on DX treatment (71% vs 58%) (Figure 4D).
Inhibition of the PI3K/AKT/mTOR axis has been proposed to reverse GC resistance in ALL cells, suggesting that the inhibitors LY294002 (PI3K paninhibitor), MK-2206 (Akt inhibitor), or rapamycin (mTOR inhibitor) may act as GC sensitizers.16,55 We therefore combined DX with each of these inhibitors to sensitize NG2WT cells. The titration curves and specificities of inhibitors are shown in supplemental Figure 4. In NG2WT cells, the combination of DX with LY294002, MK-2206, or rapamycin sensitized cells to DX treatment, resembling the responses of NG2KO cells (Figure 4E-G, left panels). Area under the curve analysis revealed a dose-dependent effect in NG2WT cells, with greater DX sensitization with increasing concentrations of PI3K inhibitors (Figure 4E-G, right panels). By contrast, these combinations elicited a weaker and non–dose-dependent effect in NG2KO cells (Figure 4E-G), indicating that the increased levels of GCR per se were sufficient to inhibit this pathway in response to DX. Similar results were observed in primary blasts from patients with MLLr B-ALL (Figure 4H,I). The MEK inhibitor PD98059 had no effect (Figure 4J), supporting the involvement of the PI3K pathway.
We next examined the levels of antiapoptotic and proapoptotic proteins after treating cells with PI3K inhibitors alone and in combination with DX (Figure 4K). We found decreased levels of BCL2 and BCLXL and increased levels of BIM when PI3K inhibitors were combined with DX in NG2WT cells. This suggests that NG2 expression reduces NR3C1 levels, and impairs its ability to inhibit antiapoptotic pathways, thereby contributing to GC resistance.
NG2 interacts with FLT3 to trigger ligand-independent activation of FLT3 signaling and downregulation of NR3C1 by the AP-1 complex
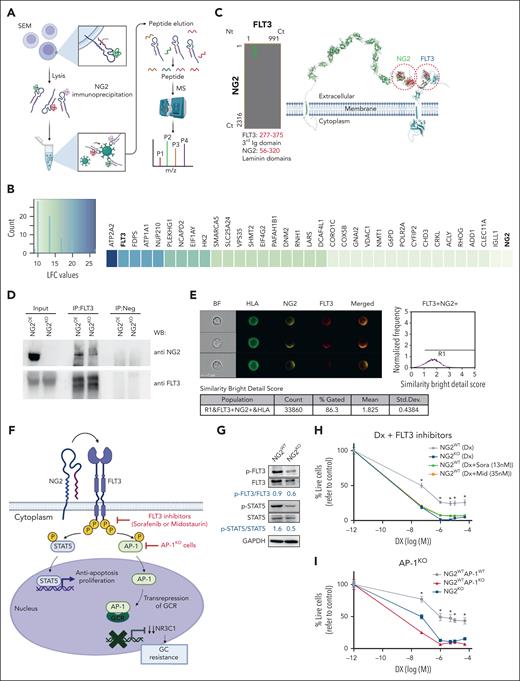
To understand how NG2 downregulates NR3C1, we used NG2 immunoprecipitation followed by MS analysis in NG2OE and NG2KO MLL-AF4+ SEM cells to explore potential candidates that interact with NG2 (Figure 5A). Among the NG2 interactors identified by MS, we focused on those peptides with a log fold change above that for NG2. The top scoring protein was ATPase sarcoplasmic/endoplasmic reticulum Ca2+ transporting (ATP2A2), a sarcoplasmic/endoplasmic reticulum–resident pump central to Ca2+ transport. Alterations in calcium transport have been implicated in GC resistance mechanisms in MLLr ALL.56,57 The tyrosine kinase receptor FLT3 was in second place, with a value of 20 log fold change (Figure 5B). FLT3 is known to be upregulated and hyperactivated in patients with MLLr B-ALL.27,28 To understand the interaction between FLT3 and NG2, we used a well-established prediction algorithm for protein-protein interactions, the iFrag prediction method.58 An interaction between FLT3 and NG2 was predicted in the extracellular region involving the third immunoglobulin domain of FLT3 and a laminin domain of NG2 (Figure 5C), an interaction pattern frequently observed among membrane proteins.59 Immunoprecipitation of FLT3, followed by NG2 blotting, confirmed this interaction (Figure 5D), and ImageStream analysis revealed colocalization of NG2 and FLT3 at the cell membrane of MLLr B-ALL cells, with a similarity bright detail score close to 2 (Figure 5E; supplemental Figure 5).
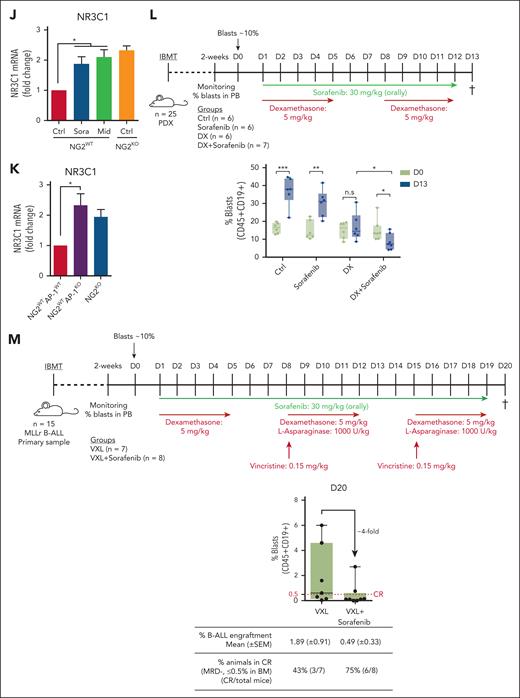
NG2 interacts with FLT3 to render ligand-independent activation of FLT3 signaling and downregulation of NR3C1 via the AP-1 complex. (A) Experimental design of the NG2 immunoprecipitation and MS analysis. (B) Heat map of NG2 partners detected by MS after NG2 immunoprecipitation. (C) Predicted region for NG2-FLT3 interaction using the iFrag prediction method. (D) FLT3 immunoprecipitation followed by NG2 blotting. (E) Colocalization of NG2 and FLT3 by ImageStream in MLLr B-ALL patient-derived xenograft (PDX). Human leukocyte antigen (HLA) marker depicts the human population. (F) Schematic representation of FLT3 pathway. (G) Immunoblots showing the phosphorylation status of FLT3 and its downstream target STAT5 in NG2WT and NG2KO SEM cells. (H) Percentage of live NG2WT SEM cells treated with DX in the presence or absence of the FLT3 inhibitors sorafenib and midostaurin. (I) Percentage of live NG2WT, NG2KO, and NG2WTAP1KO SEM cells on treatment with DX. (J) NR3C1 expression detected by qPCR in NG2WT SEM cells in the presence or absence of sorafenib and midostaurin. (K) NR3C1 expression detected by qPCR in NG2WT, NG2KO, and NG2WTAP1KO SEM cells. (L) Experimental design for in vivo experiments using NG2-expressing MLL-AF4+ PDXs treated with DX alone or in combination with sorafenib (top panel). Tumor burden (percentage of blasts) in PDX-transplanted mice at the beginning (day 0) and at the end (day 13) of treatment in the indicated groups (bottom panel). (M) Experimental design for in vivo experiments using NG2-expressing MLL-AF4+ primary cells treated with standard induction therapy (VXL) alone or in combination with sorafenib (top panel). Tumor burden (percentage of blasts) in transplanted mice at the end (day 20) of treatment in the indicated groups (bottom panel). Each point depicts 1 mouse. A mouse is considered in CR when the percentage of blasts in BM ≤0.5%. ∗P < .05, ∗∗P < .01, ∗∗∗P < .001, unpaired Student t test. Ns, not significant.
NG2 interacts with FLT3 to render ligand-independent activation of FLT3 signaling and downregulation of NR3C1 via the AP-1 complex. (A) Experimental design of the NG2 immunoprecipitation and MS analysis. (B) Heat map of NG2 partners detected by MS after NG2 immunoprecipitation. (C) Predicted region for NG2-FLT3 interaction using the iFrag prediction method. (D) FLT3 immunoprecipitation followed by NG2 blotting. (E) Colocalization of NG2 and FLT3 by ImageStream in MLLr B-ALL patient-derived xenograft (PDX). Human leukocyte antigen (HLA) marker depicts the human population. (F) Schematic representation of FLT3 pathway. (G) Immunoblots showing the phosphorylation status of FLT3 and its downstream target STAT5 in NG2WT and NG2KO SEM cells. (H) Percentage of live NG2WT SEM cells treated with DX in the presence or absence of the FLT3 inhibitors sorafenib and midostaurin. (I) Percentage of live NG2WT, NG2KO, and NG2WTAP1KO SEM cells on treatment with DX. (J) NR3C1 expression detected by qPCR in NG2WT SEM cells in the presence or absence of sorafenib and midostaurin. (K) NR3C1 expression detected by qPCR in NG2WT, NG2KO, and NG2WTAP1KO SEM cells. (L) Experimental design for in vivo experiments using NG2-expressing MLL-AF4+ PDXs treated with DX alone or in combination with sorafenib (top panel). Tumor burden (percentage of blasts) in PDX-transplanted mice at the beginning (day 0) and at the end (day 13) of treatment in the indicated groups (bottom panel). (M) Experimental design for in vivo experiments using NG2-expressing MLL-AF4+ primary cells treated with standard induction therapy (VXL) alone or in combination with sorafenib (top panel). Tumor burden (percentage of blasts) in transplanted mice at the end (day 20) of treatment in the indicated groups (bottom panel). Each point depicts 1 mouse. A mouse is considered in CR when the percentage of blasts in BM ≤0.5%. ∗P < .05, ∗∗P < .01, ∗∗∗P < .001, unpaired Student t test. Ns, not significant.
To elucidate the mechanisms underlying the role of NG2 in GC resistance, we examined the NG2/FLT3/AP-1 complex and its effects. FLT3 signaling is part of a proliferation and antiapoptosis program that includes the downstream transcription factors STAT5 and AP-1 (Figure 5F), and we have recently demonstrated a role for the AP-1 complex in the aggressiveness of MLL-AF4+ B-ALL.28 AP-1 is also a known transrepressor of GCR that decreases the expression of its target genes, including NR3C1.11-13 We found that phosphorylated (p)-FLT3 and p-STAT5 activation was greater in NG2WT cells than in NG2KO cells (p-FLT3/FLT3 ratio of 0.9 vs 0.6, respectively; and p-STAT5/STAT5 ratio of 1.6 vs 0.5, respectively) (Figure 5G), indicating that the FLT3/NG2 interaction results in ligand-independent activation of FLT3. On the basis of this, we explored the therapeutic potential of the FLT3 inhibitors sorafenib and midostaurin in overcoming NG2-induced GC resistance. The titration curves of FLT3 inhibitors and their specificity in inhibiting the pathway are shown in supplemental Figure 6. The combination of DX with FLT3 inhibitors significantly increased the sensitivity to GC treatment in NG2WT cells, mirroring the response observed in NG2KO cells (Figure 5H). We also observed increased GC sensitivity on deletion of AP-1 (AP-1KO SEM cells)28 in NG2WT cells, comparable with that of NG2KO SEM cells (Figure 5I), and highlighting the importance of the NG2/FLT3/AP-1 axis in mediating GC resistance. Notably, inhibition of FLT3 or AP-1 resulted in upregulated expression of NR3C1 (Figure 5J,K). Overall, these data reveal that NG2 activates the FLT3 pathway in a ligand-independent manner, resulting in GC resistance mediated by the downregulation of NR3C1 through AP-1.
To validate the in vivo efficacy of FLT3 inhibitors in overcoming GC resistance, NSG mice were transplanted with an MLL-AF4+ patient-derived xenograft and subsequently treated with sorafenib or DX independently or in combination after leukemia engraftment was detected in the PB (day 0). Leukemic cells were quantified at the end of the treatment period (day 13) (Figure 5L). Only mice treated with sorafenib + DX showed a significant decrease in tumor burden (15.1% ± 2.3% at day 0 vs 8% ± 1.7% at day 13) (Figure 5L). Similar results were observed with midostaurin or T5224 (AP-1 inhibitor) treatment in combination with DX (supplemental Figure 7), confirming the role of the NG2/FLT3/AP-1 complex in GC resistance in MLLr B-ALL. Additionally, synergistic effects were observed when FLT3 inhibitors were combined with VXL standard induction therapy (Figure 5M). The level of B-ALL engraftment in BM at the end of treatment was approximately fourfold lower when sorafenib was coadministered with VXL (0.49% vs 1.89%, respectively). Consequently, the rate of animals achieving complete remission (minimal residual disease ≤0.5% leukemic cells in BM) increased approximately twofold in the combination group (75% vs 43%) (Figure 5M).
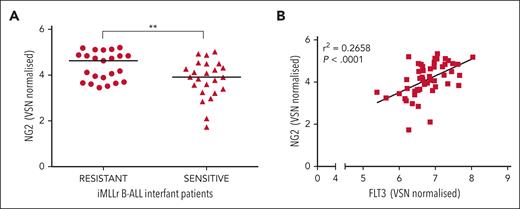
Finally, our clinical observations in a cohort of infants diagnosed with MLLr-B-ALL underscored the relevance of NG2 in GC resistance, with prednisolone-resistant patients showing elevated NG2 expression levels. Furthermore, a positive correlation between NG2 and FLT3 expression validated the functional significance of the NG2-FLT3 molecular axis in GC resistance (Figure 6A,B).
Ex vivo response of 47 primary MLLr-B-ALL cells to prednisolone. (A) NG2 RNA levels in prednisolone resistant and sensitive infants with MLLr-B-ALL. (B) Scatter plot showing the correlation between the expression of NG2 and FLT3. ∗∗P < .01.
Ex vivo response of 47 primary MLLr-B-ALL cells to prednisolone. (A) NG2 RNA levels in prednisolone resistant and sensitive infants with MLLr-B-ALL. (B) Scatter plot showing the correlation between the expression of NG2 and FLT3. ∗∗P < .01.
Discussion
Treatment protocols for pediatric B-ALL involving intensive regimens with GCs, L-Asp, and cytostatic agents have led to high long-term survival rates (>85%). However, survivors often experience severe lifelong adverse effects because of treatment-related toxicities, and ≈20% of patients experience disease refractoriness and relapse, particularly those with MLLr. This subtype, prevalent in infants aged <1 year, is characterized by high relapse rates, treatment refractoriness, and a 5-year disease-free survival of <30%.2,3,60-62 Significantly, poor response to initial GC treatment predicts treatment failure, highlighting the challenge of GC resistance.63 Immunotherapies, such as blinatumomab (a bispecific T-cell engager), have been proposed to improve outcomes in infants with MLLr ALL.64 Blinatumomab is often added to chemotherapy regimens after induction with DX, underscoring the importance of overcoming GC resistance, which remains a challenge in high-risk patients. Understanding the mechanisms underlying GC resistance is critical to identify agents that can sensitize leukemic cells to GCs and to develop novel therapeutic strategies.
Here, we demonstrate that the transmembrane proteoglycan NG2 is not expressed in healthy hematopoietic cells but is upregulated in patients with MLLr B-ALL, particularly MLL-AF4+ B-ALL. We show that MLL fusion proteins bind to NG2, suggesting that MLLr is likely responsible for the expression of NG2 in MLLr leukemic cells. In support of this, previous studies have shown a correlation between NG2 expression, poor prognosis, aggressiveness, and relapse in MLLr B-ALL.19,21,25 Despite its contribution to the pathogenesis of MLLr B-ALL, the relationship between NG2 expression and MLL fusion proteins remained unknown. Our present findings provide new insights into the regulation and function of NG2.
We addressed whether NG2, as a direct target gene of MLLr, is involved in GC resistance. Our results show that NG2 enables resistance to GCs in MLLr B-ALL cells. Because of the importance of GCs in ALL treatment, several mechanisms and molecules have been proposed to explain GC resistance, such as alterations in calcium transport,56 Src kinase induced phosphorylation of annexin A2,57 or even overexpression of BCL-2 family members.65 Mechanistically, DX activates NR3C1 in the cytoplasm, leading to its translocation to the nucleus and subsequent binding to GC response elements to regulate target gene expression.66 Although most activities of NR3C1 occur in the nucleus, rapid nongenomic GC-mediated effects also take place in the cytoplasm, such as the inhibition of PI3K-related antiapoptotic pathways,51 suggesting that PI3K inhibitors may sensitize B-ALL to GCs.15,16 Our data demonstrate that NG2-induced GC resistance is due to the downregulation of NR3C1, which fits well with data reported by Xiao et al,52 showing a positive correlation between basal expression levels of NR3C1 in ALL and sensitivity to GCs and clinical treatment outcomes. Here, we show that NG2WT fails to inhibit the PI3K pathway in response to DX, and the use of PI3K inhibitors can sensitize otherwise resistant MLLr B-ALL cells to DX in vitro by decreasing antiapoptotic proteins and increasing proapoptotic proteins. These results strongly suggest that the low levels of NR3C1 in NG2-expressing cells contribute to GC resistance by preventing apoptosis. Thus, inhibition of antiapoptotic pathways may potentially facilitate DX-induced death of MLLr B-ALL cells.
To elucidate the mechanisms by which NG2, a transmembrane protein, downregulates NR3C1, we performed NG2 immunoprecipitation/MS, which revealed an interaction between FLT3 and NG2 through laminin-immunoglobulin domains. High expression of FLT3 has been associated with poor prognosis in MLLr B-ALL because of constitutive activation of FLT3 in the absence of ligand binding.27,53 Importantly, FLT3 activation has been associated with GC resistance in B-ALL.54 Indeed, FLT3 has been proposed as a therapeutic target for B-ALL, with US Food and Drug Administration–approved FLT3 inhibitors––such as sorafenib or midostaurin––as promising agents.67 Brown et al have suggested that targeting FLT3 may improve outcomes in newly diagnosed MLLr iB-ALL with elevated FLT3 expression, based on the Children's Oncology Group (COG) ALL0631 trial.68 In this well-conducted study, the authors added FLT3 inhibitors after induction therapy in a subset of patients. Although no overall survival benefit was observed, retrospective analyses suggested a potential benefit for some patients with in vitro sensitivity. Our findings implicating FLT3 in GC resistance suggest that FLT3 inhibitors should be explored upfront, especially during the critical 7-day induction window, consistent with the INTERFANT therapy protocol. Furthermore, the FLT3 inhibitor landscape has evolved to include multiple generations of inhibitors, notably type I and type II inhibitors. Further understanding of the conformation of the FLT3 receptor when bound to NG2 is essential. Likewise, ongoing research is critical to refine our understanding of the role of FLT3 and to optimize therapeutic strategies, considering diverse inhibitor mechanisms. AP-1, a downstream target of FLT3 signaling, inhibits the expression of many GCR-target genes, including NR3C1 itself,12,13 through direct sequestration.14 We therefore hypothesized that the NG2-induced downregulation of NR3C1 could be the result of an interaction between NG2 and FLT3, which activates the AP-1 complex. Indeed, inhibition of FLT3 or AP-1 sensitized MLLr B-ALL cells to GCs by upregulating NR3C1 expression. Finally, in our preclinical models, FLT3 and AP-1 inhibitors in combination with DX significantly reduced leukemic burden, highlighting their potential to overcome GC resistance.
Overall, our study establishes, for the first time to our knowledge, the direct binding-based mechanism of NG2 expression by MLL fusion proteins, conferring resistance to GC, a significant clinical predictor of poor outcome in MLLr B-ALL. Our work reconciles previous findings highlighting the contributions of NG2, FLT3, and the AP-1 family to the pathogenesis of MLLr B-ALL,27,28 and suggests novel therapeutic targets for this subtype of leukemia. Whether our observations extend to other NG2+ tumors lacking MLLr, such as glioblastoma or melanoma, requires further investigation and may pave the way for new therapeutic strategies for these challenging-to-treat tumors. Additional preclinical studies and phase 1 clinical trials will be essential to determine the clinical efficacy of FLT3/NG2-based therapies for MLLr B-ALL.
Acknowledgments
The authors acknowledge the contribution of the Single Cell Unit of the Josep Carreras Leukaemia Research Institute (IJC) and the CRG/UPF Proteomics Unit, which is part of the Spanish National Infrastructure for Omics Technologies (ICTS OmicsTech). The authors also thank Alex Vaquero (IJC) for his help in proteomics and Anindita Roy (Department of Pediatrics, University of Oxford) for providing access to human fetal B-cell single-cell data. Finally, the authors are indebted to the Spanish Relapse/Refractory Pediatric Leukemia Network.
The authors thank CERCA/Generalitat de Catalunya and Fundació Josep Carreras-Obra Social la Caixa for core support, and the Cure2MLL project from the Fight Kids Cancer program of the European Science Foundation. Further financial support for this work was obtained from the Spanish Ministry of Economy and Competitiveness (PID2019-108160RB-I00 to P.M.), “Heroes hasta la médula” initiative and ISCIII-RICORS-TERAV within the Next Generation EU program (plan de recuperación, transformación y resiliencia), and the Health Institute Carlos III (ISCIII/FEDER, PI20/00822), the Asociación Española Contra el Cáncer, and the Fundación Unoentrecienmil to C.B. B.L.-M. was supported by the Asociación Española Contra el Cáncer (INVES20011LÓPE), Consejería de Salud y Familia (FEDER/PEER-0028-2020), and EMERGIA2021, funded by Consejería de Universidad, Investigación e Innovación, and by ERDF A way of making Europe. C.P. was supported by the Health Institute Carlos III (ISCIII/FEDER, FI21/00161). R.M. is supported by a grant from the DJCLS (07 R/2022).
Authorship
Contribution: B.L.-M. conceived the study, designed and performed experiments, analyzed data, wrote the manuscript, and financially supported the study; A.R.-G., M.V., J.L.T., J.R.T., M.F.F., N.F.-F., M.G.-M., A.M., T.V.-H., A.F., C.P., G.V., J.L.S., P.L.-M., B.M.J., B.D.V.-P., A.G.d.H., M.B., G.C., T.A.M., J.C.R.-M., T.H., and R.M. designed and performed experiments and analyzed data; R.W.S., R.P., and F.L. provided critical leukemia samples; and P.M. and C.B. conceived the study, designed experiments, wrote the manuscript, and financially supported the study.
Conflict-of-interest disclosure: T.A.M. is a shareholder and consultant for Dark Blue Therapeutics with unrelated scientific interests. P.M. is cofounder of OneChain ImmunoTx, a spin-off company from the Josep Carreras Leukemia Research Institute with unrelated scientific interests. The remaining authors declare no competing financial interests.
Correspondence: Pablo Menéndez, Josep Carreras Leukemia Research Institute, School of Medicine, University of Barcelona, Casanova 143, 08036 Barcelona, Spain; email: pmenendez@carrerasresearch.org; Clara Bueno, Josep Carreras Leukemia Research Institute, School of Medicine, University of Barcelona, Casanova 143, 08036 Barcelona, Spain; email: cbueno@carrerasresearch.org; and Belen Lopez-Millan, Josep Carreras Leukemia Research Institute, School of Medicine, University of Barcelona, Casanova 143, 08036 Barcelona, Spain; email: blopez@carrerasresearch.org.
References
Author notes
B.L.-M. and A.R.-G. contributed equally to this study.
Original data from scRNA-seq are available at Gene Expression Omnibus (GEO) under accession number GSE7945022. The raw proteomics data have been deposited in the PRIDE repository with the data set identifier PXD041875. Microarray data are available at GEO repository under accession number GSE79450. Chromatin immunoprecipitation–sequencing and RNA-sequencing (RNAseq) data from wild-type and MLL-AF4 knockdown SEM cells were obtained from GSE202451 and GSE85988, respectively. RNAseq data from 47 infants with MLLr-B-ALL, all treated according to INTERFANT treatment protocols, were downloaded from Candelli et al, 2022 (PMID: 34304246), EGAS00001003986. Additional RNAseq and DNA methylation data were downloaded from Tejedor et al, 2021 (PMID: 33983906), ENA PRJEB23605 and ArrayExpress E- MTAB-8505, respectively. Subsequent validation analyses were performed using data from E-MTAB-12806, PRJEB60567, and GSE228296. WGBS from FL-BCP and iB-ALL were obtained from the European Genome-Phenome Archive (EGAD00001005010). References to the other databases used can be found in the supplementary materials.
The online version of this article contains a data supplement.
There is a Blood Commentary on this article in this issue.
The publication costs of this article were defrayed in part by page charge payment. Therefore, and solely to indicate this fact, this article is hereby marked “advertisement” in accordance with 18 USC section 1734.


This feature is available to Subscribers Only
Sign In or Create an Account Close Modal