Key Points
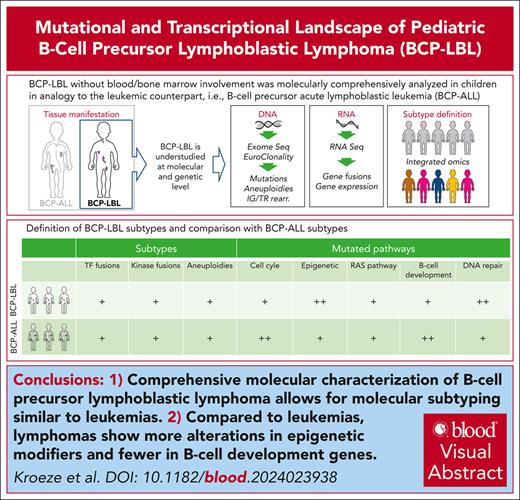
Comprehensive molecular characterization of BCP lymphoblastic lymphoma allows molecular subtyping analogous to leukemias.
Compared with leukemias, lymphomas show more alterations in epigenetic modifiers and fewer in B-cell development genes.
Visual Abstract
Pediatric B-cell precursor (BCP) lymphoblastic malignancies are neoplasms with manifestation either in the bone marrow or blood (BCP acute lymphoblastic leukemia [BCP-ALL]) or are less common in extramedullary tissue (BCP lymphoblastic lymphoma [BCP-LBL]). Although both presentations are similar in morphology and immunophenotype, molecular studies have been virtually restricted to BCP-ALL so far. The lack of molecular studies on BCP-LBL is due to its rarity and restriction on small, mostly formalin-fixed paraffin-embedded (FFPE) tissues. Here, to our knowledge, we present the first comprehensive mutational and transcriptional analysis of what we consider the largest BCP-LBL cohort described to date (n = 97). Whole-exome sequencing indicated a mutational spectrum of BCP-LBL, strikingly similar to that found in BCP-ALL. However, epigenetic modifiers were more frequently mutated in BCP-LBL, whereas BCP-ALL was more frequently affected by mutation in genes involved in B-cell development. Integrating copy number alterations, somatic mutations, and gene expression by RNA sequencing revealed that virtually all molecular subtypes originally defined in BCP-ALL are present in BCP-LBL, with only 7% of lymphomas that were not assigned to a subtype. Similar to BCP-ALL, the most frequent subtypes of BCP-LBL were high hyperdiploidy and ETV6::RUNX1. Tyrosine kinase/cytokine receptor rearrangements were detected in 7% of BCP-LBL. These results indicate that genetic subtypes can be identified in BCP-LBL using next-generation sequencing, even in FFPE tissue, and may be relevant to guide treatment.
Introduction
B-cell precursor acute lymphoblastic leukemia (BCP-ALL) and lymphoblastic lymphoma (BCP-LBL or B-LBL) are considered 1 disease entity.1 Although indistinguishable in morphology and immunophenotype, their clinical presentation is clearly different. BCP-LBL typically manifests as an extramedullary disease and is localized in the lymph nodes, bones, skin, and subcutaneous tissues. By definition, patients with BCP-LBL present with <25% blasts in the bone marrow (BM).2 In contrast, BCP-ALL presents as leukemic disease and patients have per definition ≥25% blasts in the BM, often accompanied by peripheral blood involvement and hepatomegaly and/or splenomegaly.2
BCP-ALL is one of the most prevalent hematologic malignancies in children3,4 and has been extensively studied, both clinically and molecularly.5 Accordingly, treatment strategies for BCP-ALL have evolved by defining molecular genetic subtypes that are associated with outcomes independent of minimal residual disease.6 The BCP-ALL subtype definition is based on aneuploidies, transcription factor (TF)-driven, and kinase/cytokine receptor-driven translocations. The high hyperdiploid (HeH) subtype, characterized by 51 to 67 chromosomes, is one of the most common pediatric ALL subtypes (25%).6 Other aneuploid BCP-ALL subtypes include near haploidy (24-30 chromosomes), low hypodiploidy (31-39 chromosomes), and intrachromosomal amplification of chromosome 21 (iAMP21), each accounting for 1% to 2% of pediatric BCP-ALL. The TF-driven subtypes include ETV6::RUNX1 (25%), TCF3::PBX1 (5%-6%), KMT2A rearrangements (2%), and less common subtypes with genetic aberrations of DUX4, MEF2D, ZNF384, PAX5, and IKZF1. Lastly, kinase/cytokine receptor-driven BCP-ALL subtypes include BCR::ABL1 (∼3%), ABL-class (∼3%), and subtypes based on CRLF2 rearrangements.6 Frequent secondary genetic events in BCP-ALL include mutations and deletions in genes involved in B-cell development, such as IKZF1 and PAX5, as well as cell cycle, RAS, and JAK-STAT pathway genes.7
BCP-LBL is a rare hematologic malignancy in children. At present, patients are stratified based on disease stage as biological risk factors have not been identified yet.2 The diagnosis of BCP-LBL is based on mostly small tissue formalin-fixed paraffin-embedded (FFPE) biopsies. Although several cytogenetic subtypes have been reported in BCP-LBL, including HeH, KMT2A rearrangement, ETV6::RUNX1, TCF3::PBX1, and iAMP21,2,8-12 their incidence, association with mutations, and outcomes remain largely unknown.
Methods
Patient samples and processing
Pediatric patients with BCP-LBL diagnosed between 1996 and 2022 were included in the study (n = 97). The tumor tissue of the patient was obtained from fresh frozen (FF; n = 15) or FFPE (n = 82) tissue. Dutch FFPE material was collected from the Dutch Nationwide Pathology Databank.13 Clinical data were retrieved from the contributing hospitals. Patient samples from The Netherlands, Australia, Austria, France, and Spain were processed at the Princess Máxima Center for Pediatric Oncology, Utrecht, The Netherlands (n = 40), and patient samples from Germany at the Haematopathology Section of the University Hospital Schleswig-Holstein, Kiel, Germany (n = 57). The study was conducted in accordance with the Declaration of Helsinki and all patients or their guardians signed informed consent according to the local guidelines. Genomic DNA and RNA were extracted from sections of tumor biopsies with at least 40% tumor cell content, as determined by a pathologist using hematoxylin and eosin staining. Genomic DNA was used for next-generation sequencing library preparation using either the KAPA Library Preparation kit or the KAPA HyperPlus kit (KAPA Biosystems, Wilmington, MA). Genomic libraries were captured using the HyperPlus Capture Exome Kit or the xGen Exome Panel V2 (Integrated DNA Technology, Coralville, IA) and sequenced on an Illumina Novaseq 6000 (2 × 150 base pair paired-end). Some libraries (n = 52) were also analyzed using the EuroClonality-NDC Assay (Univ8 Genomics, Belfast, United Kingdom).14 For transcriptome sequencing (RNA sequencing [RNA-seq]), RNA libraries were generated using either the KAPA RNA HyperPrep Kit with RiboErase (KAPA Biosystems) and sequenced directly or with the xGen Broad-Range RNA Library Prep Kit (Integrated DNA Technology) and captured with the xGen Exome Panel V2 (Integrated DNA Technology) to select for coding sequences only. A detailed description of the methodological procedures is provided in the supplemental Methods, available on the Blood website.
Data analysis
For single-nucleotide variant (SNV) and small insertion/deletion (indel) analysis, variants were called using Mutect2 from GATK 4.2.0.0.15 Because of the absence of germ line material and therefore the absence of certainty to call somatic mutations, a selection of 536 genes, including BCP-ALL candidate genes,7 genes with a known function in DNA repair, and genes frequently mutated in lymphomas,16,17 were used for variant analysis (supplemental Table 1). Mutations (SNVs and indels combined) that passed the filtering steps, which were found to occur in ≥4% of the samples, were used for further analysis. Copy number aberrations were called by implementing GATK v4.0.1.2 best practices.18 RNA-seq data were processed using STAR v2.7.2d, and STAR-Fusion v1.8.0 and/or Arriba were used for gene fusion detection.19,20 Count matrices were generated by implementing the featurecounts function in the Rsubread v1.6.4 package. Transcript per million-normalized data were used to predict subtypes using the ALLCatchR classifier.21 Subtypes were assigned by integrating information from aneuploidies, fusions, SNVs, and ALLCatchR prediction. Samples with inconsistencies in data coming from different sources were defined as BCP-LBL, not otherwise specified (NOS). Samples for which lack of experimental data prevented subtype definition were labeled as “n.a.” (not assigned). For cases with missing experimental data but assigned to a subtype with “high confidence” by ALLCatchR,21 ALLCatchR prediction was used as the final subtype.
For immunoglobulin and T-cell receptor (TR) rearrangement analysis, sequencing data obtained using the EuroClonality-NDC Assay (Univ8 Genomics, Belfast, United Kingdom) were analyzed using the ARResT/Interrogate bioinformatics platform (http://arrest.tools/interrogate-latest/).
To compare the data obtained in the analysis of our BCP-LBL cohort with similar data obtained for pediatric BCP-ALL, we used as a reference a cohort of 2148 patients (aged 1-18 years) published by Brady et al.7 A more detailed description of the data analysis is provided in the supplemental Methods.
Results
Study cohort
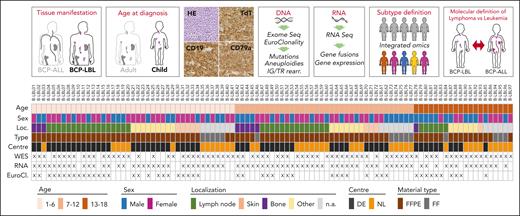
We collected a retrospective cohort of 97 pediatric patients with BCP-LBL diagnosed between 1996 and 2022. The median age at diagnosis was 7 years (range 1-18) with a male-to-female ratio of 0.96:1 (51% female). Most patients were treated with ALL-based treatment protocols, consisting of 3 chemotherapy blocks (induction, consolidation, and maintenance). Patients with higher stages of the disease (stage III/IV) received an extra treatment block (reinduction). Lumping major groups of tissues analyzed revealed lymph nodes in 63%, skin/subcutaneous lesions in 26%, and bone lesions in 38% of the patients. By definition, BM involvement was <25%. Our cohort was comparable to the previously described BCP-LBL cohorts, based on median age and disease localizations, as well as the distribution of stages and outcome (supplemental Table 2).2,22 Nine patients had an event, including 7 relapses, 1 death due to therapy complications, and 1 death in remission due to a secondary malignancy. The median time to follow-up was 61 months, and the 5-year event-free survival rate of the patients in our cohort was 88% ± 4%, again comparable with that of previously described cohorts (supplemental Table 2).2,23 A more detailed description of patient characteristics is provided in supplemental Table 3. Figure 1 shows a schematic depiction of the study design, cohort characteristics, and next-generation sequencing analyses performed on patient samples.
Graphical description of the study design and experimental cohort. Patients eligible for this study were selected according to the criteria defined in the upper panels of this figure. Selected patients had a degree of BM involvement of <25%, age at diagnosis between 1 and 18 years, BCP-LBL cellular morphology, and positivity for terminal deoxynucleotidyltransferase (TdT) and CD19 and/or CD79a. DNA and RNA were extracted from tissue biopsies of selected patients and processed for DNA and RNA next-generation sequencing (NGS) analyses. The results of these analyses were integrated to assign lymphoma subtypes and define molecular differences between the BCP-LBL cohort here described and publicly available data obtained from pediatric patients with BCP-ALL (Brady et al7). The panel below shows for each of the 97 patients information about the age group, sex, and location (Loc.) of the biopsy used for molecular analyses, and if the material was available as FFPE or FF. The figure also shows the tissue processing center (DE, Germany; NL, The Netherlands) and NGS analysis performed (WES, whole exome sequencing; RNA, whole-transcriptome sequencing; EuroCl., targeted sequencing of selected genomic regions using the EuroClonality-NDC Assay).
Graphical description of the study design and experimental cohort. Patients eligible for this study were selected according to the criteria defined in the upper panels of this figure. Selected patients had a degree of BM involvement of <25%, age at diagnosis between 1 and 18 years, BCP-LBL cellular morphology, and positivity for terminal deoxynucleotidyltransferase (TdT) and CD19 and/or CD79a. DNA and RNA were extracted from tissue biopsies of selected patients and processed for DNA and RNA next-generation sequencing (NGS) analyses. The results of these analyses were integrated to assign lymphoma subtypes and define molecular differences between the BCP-LBL cohort here described and publicly available data obtained from pediatric patients with BCP-ALL (Brady et al7). The panel below shows for each of the 97 patients information about the age group, sex, and location (Loc.) of the biopsy used for molecular analyses, and if the material was available as FFPE or FF. The figure also shows the tissue processing center (DE, Germany; NL, The Netherlands) and NGS analysis performed (WES, whole exome sequencing; RNA, whole-transcriptome sequencing; EuroCl., targeted sequencing of selected genomic regions using the EuroClonality-NDC Assay).
In line with the criteria for BCP-LBL pathology classifications,1,24 all included patients were positive for B-cell markers on immuno-histological inspection (eg, CD19 and CD79a), and all of them, except 3, expressed the precursor marker terminal deoxynucleotidyltransferase (TdT). The lack of TdT expression by immuno-histological in these 3 samples was presumably a technical issue, as the analyses described below and summarized in supplemental Tables 3 and 5 clearly show a precursor cell of origin for all samples. Furthermore, 6% of the patients showed expression of the T-cell marker CD3 and 20% had expression of the myeloid marker myeloperoxidase (MPO) (supplemental Table 3). The frequency of MPO expression was comparable with that reported in a previously published cohort of lymphomas.25 These specimens were nevertheless included in the study as aberrant expressions are common and the patients were clinically managed as BCP-LBL. As reported in supplemental Table 3, the clinical characteristics of 81 patients in our sequencing cohort have been reported by Au-Yeung et al12 (n = 44) and Kroeze et al (n = 37).2
Immunoglobulin and TR rearrangements
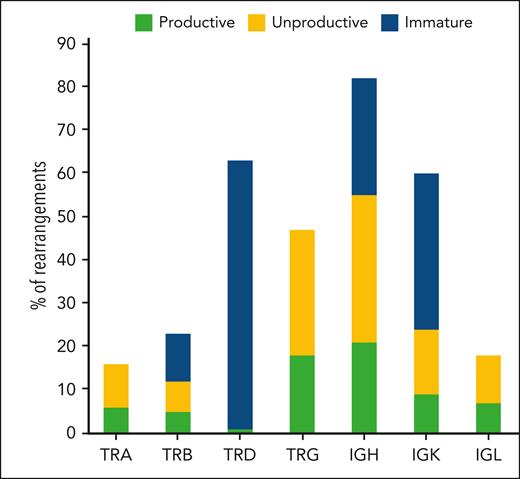
B-cell maturation and differentiation are associated with stages of immunoglobulin rearrangements.26-28 In the early stages of differentiation, recombination of the immunoglobulin heavy chain gene (IGH) gene is either incomplete or unproductive. Therefore, we sought to use rearrangement analysis as a tool to validate the precursor origin of BCP-LBL in our cohort by looking at the frequency and productivity of IG/TR rearrangements. IG and TR gene rearrangements were analyzed in 52 samples (Figure 1). As expected for a lymphoid neoplasm, all patients had at least 1 clonal rearrangement. Most patients had rearrangements in the IGH and TRD genes (89% and 79%, respectively). Rearrangements in other immunoglobulin and TR genes were identified at different frequencies in our cohort (Figure 2). Seventy-eight percent of the total clonal rearrangements identified in the different immunoglobulin and TR genes in all BCP-LBL samples were considered either unproductive or nonfunctional (Figure 2; supplemental Table 4). These results confirm the BCP origin of BCP-LBL and do not indicate a different stage of maturation of the cell or origin in BCP-LBL compared with that in BCL-ALL.29
Immunoglobulin/TR rearrangements analysis. The figure shows the analysis of results obtained using the EuroClonality-NDC capture panel on genomic DNA from 52 patients in the BCP-LBL cohort. For each of the TR genes (TRA, TRB, TRD, and TRG) and immunoglobulin genes (IGH, IGK, and IGL), the number of clonal rearrangements identified is shown. Furthermore, information from the rearrangement sequence and segment usage were integrated to count the number of rearrangements defined as productive (complete rearrangements, potentially able to produce a functional receptor), unproductive (complete rearrangements unable to produce a receptor for the presence of out of frame deletions), and nonfunctional (incomplete, chimeric, or disruptive rearrangements).
Immunoglobulin/TR rearrangements analysis. The figure shows the analysis of results obtained using the EuroClonality-NDC capture panel on genomic DNA from 52 patients in the BCP-LBL cohort. For each of the TR genes (TRA, TRB, TRD, and TRG) and immunoglobulin genes (IGH, IGK, and IGL), the number of clonal rearrangements identified is shown. Furthermore, information from the rearrangement sequence and segment usage were integrated to count the number of rearrangements defined as productive (complete rearrangements, potentially able to produce a functional receptor), unproductive (complete rearrangements unable to produce a receptor for the presence of out of frame deletions), and nonfunctional (incomplete, chimeric, or disruptive rearrangements).
Mutational landscape and focal deletions in BCP-LBL
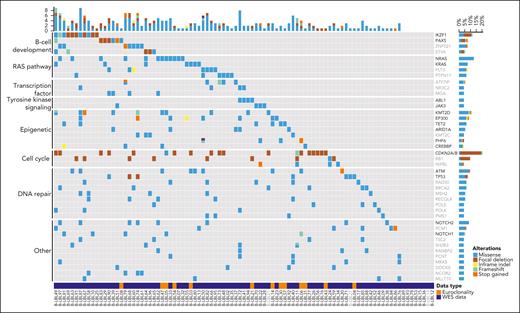
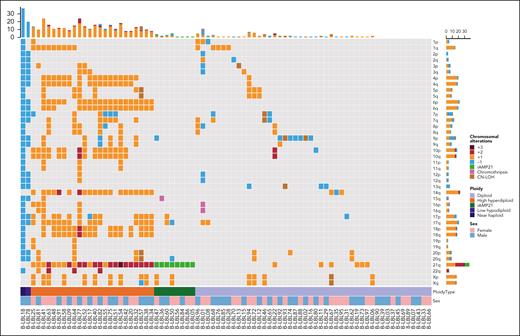
Whole-exome sequencing (WES) was performed on FFPE material or frozen tissue (n = 80). For 13 additional patients, mutational data on a limited set of lymphoma-related genes covered by the EuroClonality-NDC capture assay were available. The recurrently mutated and deleted genes in BCP-LBL were involved in cell cycle regulation, RAS signaling, B-cell development, and epigenetic regulation, and include CDKN2A/B (21%), NRAS (13%), IKZF1 (12%), and KMT2D (12%) as the most commonly altered genes (Figure 3). Next, we asked whether our BCP-LBL cohort was characterized by gains or losses of chromosomal arms or complete chromosomes. Analysis of the WES data revealed that aneuploidies were common in our patient cohort, with 83% of the patients showing ≥1 chromosomal copy number alteration, including gain of chromosomes typical for HeH and iAMP21 (Figure 4). Commonly gained chromosomes included chromosomes 21 (38% of the patients), 14 (28%), 6 (23%), and 17 (16%). The chromosome arms affected by recurrent deletions included 9p (11%), 7p (11%), and 13q (6%).
Overview of recurrently mutated genes and pathways in BCP-LBL. Oncoplot showing recurrently mutated and deleted genes in our BCP-LBL cohort based on single-nucleotide variants and small indels. Mutated genes were divided into functional categories, as indicated on the left of the figure. For 80 patients, mutational data was derived from WES analysis (data type, WES). The analysis of the WES data was limited to a selection of 536 genes with known oncogenic potential (see “Methods”). For 13 additional patients, mutational data was derived from the analysis of a limited set of lymphoma-related genes (in black in the gene list) covered by the EuroClonality-NDC capture assay (data type: Euroclonality panel). For samples in gray, focal deletions could not be determined.
Overview of recurrently mutated genes and pathways in BCP-LBL. Oncoplot showing recurrently mutated and deleted genes in our BCP-LBL cohort based on single-nucleotide variants and small indels. Mutated genes were divided into functional categories, as indicated on the left of the figure. For 80 patients, mutational data was derived from WES analysis (data type, WES). The analysis of the WES data was limited to a selection of 536 genes with known oncogenic potential (see “Methods”). For 13 additional patients, mutational data was derived from the analysis of a limited set of lymphoma-related genes (in black in the gene list) covered by the EuroClonality-NDC capture assay (data type: Euroclonality panel). For samples in gray, focal deletions could not be determined.
Overview of chromosomal gains and losses in BCP-LBL. Oncoplot showing chromosomal aberrations per chromosomal arm. Different colors represent the number of gains/losses or other chromosomal events.
Overview of chromosomal gains and losses in BCP-LBL. Oncoplot showing chromosomal aberrations per chromosomal arm. Different colors represent the number of gains/losses or other chromosomal events.
Gene fusions
Gene fusions are commonly observed in BCP-ALL and are considered to be driving oncogenic events. To identify chimeric transcripts resulting from gene fusion events as well as transcriptional signatures defining distinct subgroups, we performed whole-transcriptome analysis on RNA extracted from 80 patients with BCP-LBL. We found that 45 of 80 (56%) patients carried known or novel gene fusions. The ETV6∷RUNX1 fusion was the most frequent fusion, observed in 10 patients, followed by fusions involving TCF3 (7 patients), with 5 patients carrying a TCF3∷PBX1 fusion, 1 patient with a TCF3∷FLI1 fusion and 1 patient a TCF3::BRD3 fusion. Other TFs involved in fusion genes included KMT2A and/or MLLT genes (5 patients), NUTM1 (3 patients), and PAX5 (4 patients). Rearrangements of DUX4 to the IGH locus were detected in 3 patients, with 3 other patients suspected of DUX4-rearranged based on high DUX4 expression and/or a detected breakpoint in the RNA-seq reads. Two patients had a BCR::ABL1 fusion and 1 patient had an ETV6::ABL1 fusion. Interestingly, 4 novel fusions were identified; being PAX5::GLIPR2, TCF3::BRD3, MTO1::JPH3, and ZNF710::CRTC3 (supplemental Table 5; supplemental Figure 1). Patients with PAX5::GLIPR2 and MTO1::JPH3 fusions had an HeH karyotype, for the remaining patients with novel fusions, no other driving lesions were detected.
Comparison of mutations between BCP-LBL and BCP-ALL
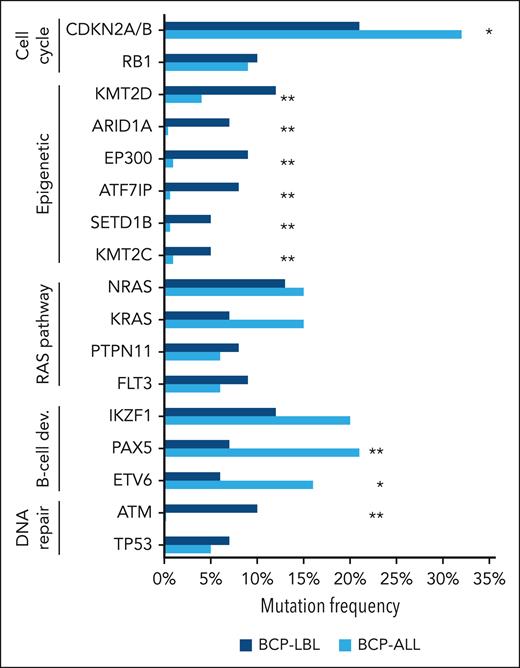
We compared the frequencies of the genetic aberrations (SNVs, indels, and focal deletions) found most frequently in our BCP-LBL cohort with those reported for pediatric BCP-ALL by Brady et al.7 To highlight the differences in functional categories, we focused on the top mutated genes in each category defined in Figure 5 and supplemental Table 6. The recurrent alterations are listed in supplemental Table 7 and the less frequently mutated genes are listed in supplemental Table 8. Interestingly, we observed enrichment in genes with a known role in epigenetic regulation among all genes that were significantly more often mutated in BCP-LBL than in BCP-ALL. These included KMT2D (P = .0047), EP300 (P < .0001), ARID1A (P < .0001), and ATF7IP (P < .0001) among the most frequently mutated, as well as SETD1B (P = .0008) and KMT2C (P = .0030; Figure 5). In contrast, TFs important for B-cell development, such as PAX5 and ETV6, were significantly more frequently altered in BCP-ALL (P = .0011 and P = .0270, respectively) (Figure 5; supplemental Table 6). Finally, we observed relatively frequent mutations in DNA repair genes, with mutations in ATM being significantly more frequent in BCP-LBL than in BCP-ALL (P < .0001). Mutations in RAS pathway genes and tumor suppressor genes, IKZF1, RB1, and TP53, showed similar frequencies in BCP-LBL and BCP-ALL.
Comparison of the frequencies of gene aberrations and genetic subtypes between BCP-LBL and BCP-ALL. The most frequently mutated genes in the present BCP-LBL cohort were compared with the mutational frequencies of these genes in 608 patients with BCP-ALL by Brady et al.7 The asterisk indicates statistically significant differences between mutational frequency in BCP-LBL and BCP-ALL (∗P < .05; ∗∗P < .005).
Comparison of the frequencies of gene aberrations and genetic subtypes between BCP-LBL and BCP-ALL. The most frequently mutated genes in the present BCP-LBL cohort were compared with the mutational frequencies of these genes in 608 patients with BCP-ALL by Brady et al.7 The asterisk indicates statistically significant differences between mutational frequency in BCP-LBL and BCP-ALL (∗P < .05; ∗∗P < .005).
Integrating copy number and gene expression to define BCP-LBL subtypes
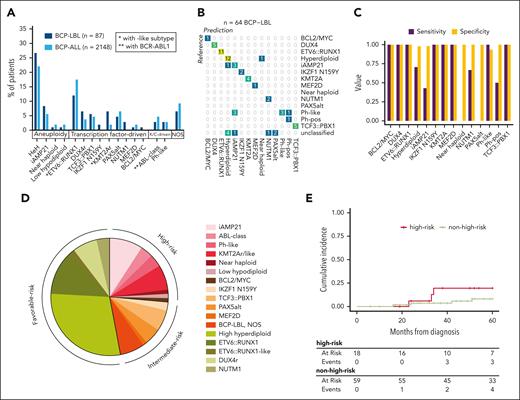
Given the overlap in cell of origin between BCP-LBL and BCP-ALL, we evaluated whether the subtype classification of BCP-ALL1 could be applied to patients with BCP-LBL. Subtypes were defined in 87 samples by integrating DNA copy number alterations, SNVs, and gene fusions. Additionally, we used gene expression to predict subtypes for 80 BCP-LBL cases by RNA-seq data using the machine learning-based ALLCatchR classifier,15 which was developed for BCP-ALL. Combining these approaches, we classified 81 patients with BCP-LBL to 1 of 17 subtypes, leaving only 6 (7%) patients without subtype-defining lesions as “BCP-LBL NOS” (supplemental Table 3). Ten patients with incomplete data due to technical limitations of the material could not be assigned to a subtype. The successfully classified BCP-LBL could be lumped into groups based on aneuploidies (40%), TF-driven aberrations (46%), and kinase/cytokine receptor-driven aberrations (7%). These rates were comparable with data from BCP-ALL, in which aneuploidy-based accounts for 34%, TF-driven accounts for 44%, and kinase/cytokine-driven accounts for 12% of subtypes7 (Figure 6A). Using reference subtypes based on aneuploidies, gene fusions, and SNVs, we evaluated the overall prediction accuracy of ALLCatchR applied to BCP-LBL to be 87.5% (Figure 6B). The specificities for all subtypes were >90%, suggesting that false-positive predictions were rare. For several BCP-LBL subtypes, including iAMP21 and near haploidy, the classifier had lower sensitivity (Figure 6C), which was in line with the sensitivities reported for BCP-ALL.15 Among the aneuploidy-driven subtypes, the HeH subtype was the 1 predicted by the ALLCatchR classifier with the highest accuracy (81%). The iAMP21 BCP-LBL subtype was predicted with 70% accuracy, and the remaining cases were classified as Ph-like. (Figure 6B). More than 80% of the TF-driven subtypes and all kinase/cytokine receptor-driven subtypes, except for 1, were classified correctly by the ALLCatchR classifier. Finally, for each of the identified subtypes, ALLCatchR could predict a cell of origin based on the enrichment scores for the 7 B-cell differentiation stages (supplemental Figure 2).
Overview of subtypes and genetic-risk group in BCP-LBL. (A) Comparison of frequencies of subtypes in BCP-LBL compared with published data from Brady et al,7 showing a largely similar distribution. (B) Confusion matrix showing a high degree of concordance between the subtypes assigned based on aneuploidies, gene fusions, and SNVs (reference, columns) and subtypes predicted using the ALLCatchR classifier (rows), which is solely based on gene expression data. (C) Bar graph showing for each of the subtypes, the sensitivity and specificity of the ALLCatchR prediction. (D) Distribution of subtypes associated with risk for BCP-LBL based on known risk-associated subtypes in BCP-ALL. (E) Cumulative incidence of relapse in the BCP-LBL cohort based on genetic-risk groups known from BCP-ALL, comparing high-risk and nonhigh-risk genetic subtypes. Outcome or follow-up data was missing for 20 patients.
Overview of subtypes and genetic-risk group in BCP-LBL. (A) Comparison of frequencies of subtypes in BCP-LBL compared with published data from Brady et al,7 showing a largely similar distribution. (B) Confusion matrix showing a high degree of concordance between the subtypes assigned based on aneuploidies, gene fusions, and SNVs (reference, columns) and subtypes predicted using the ALLCatchR classifier (rows), which is solely based on gene expression data. (C) Bar graph showing for each of the subtypes, the sensitivity and specificity of the ALLCatchR prediction. (D) Distribution of subtypes associated with risk for BCP-LBL based on known risk-associated subtypes in BCP-ALL. (E) Cumulative incidence of relapse in the BCP-LBL cohort based on genetic-risk groups known from BCP-ALL, comparing high-risk and nonhigh-risk genetic subtypes. Outcome or follow-up data was missing for 20 patients.
Comparison of subtypes in BCP-LBL and BCP-ALL
Subtypes based on aneuploidies
The most prevalent subtype in the BCP-LBL cohort was HeH, observed in 25 of 87 patients (29%). HeH is also the most common in pediatric BCP-ALL, occurring in approximately a quarter of patients.7 We observed RAS pathway mutations (KRAS, NRAS, PTPN11, and FLT3) in 32% of patients with HeH. The iAMP21 subtype occurred in 8 of 87 patients with BCP-LBL (9%), comparable with the reported prevalence in BCP-ALL (6%). A gain in chromosome 21 was also found in subtypes other than HeH and iAMP21, making it the most frequent copy number-altered chromosome in BCP-LBL (48%). The low hypodiploid subtype was detected in 1 out of 87 patients. Lastly, the near-haploid subtype was observed in 1 out of 87 patients in our cohort. These frequencies were comparable to those observed in BCP-ALL (Figure 6A; supplemental Table 6).
TF-driven subtypes
The most common TF-driven subtype in our BCP-LBL cohort was ETV6::RUNX1, detected in 11 of 87 cases (13%). ETV6::RUNX1 fusions were detected in pediatric BCP-ALL with a frequency of 19% in the BCP-ALL comparison cohort and a frequency reaching 25% in the literature.6 Although not significant (supplemental Table 6), the percentage of patients with BCP-LBL with ETV6::RUNX1 subtype seems to be lower than in the BCP-ALL. The median age of patients with BCP-LBL in the ETV6::RUNX1 subtype was 6 years. Additional genetic alterations were found to be very heterogeneous in patients in the ETV6::RUNX1 subtype, but ∼70% of patients with BCP-ALL have ETV6 deletions. We did not detect ETV6 deletions in our ETV6::RUNX1 BCP-LBL cases, which could be due to the limited ability to detect focal deletions in the WES data from FFPE samples.
Other TF-driven BCP-LBL subtypes were detected, which also occurred in BCP-ALL: DUX4 rearrangement (6 patients, 7%), TCF3::PBX1 (5 patients, 6%), PAX5 alteration (4 patients, 5%), KMT2A rearrangement (4 patients, 5%), NUTM1 rearrangement (3 patients, 3%), IKZF1 N159Y (2 patients, 2%), MEF2D rearrangement (1 patient, 1%), and MYC rearrangement (1 patient, 1%). KMT2A-rearranged BCP-LBL was as infrequent as BCP-ALL in this cohort. The difference to our previous publication, in which we reported 19% (9/48) KMT2A-rearranged BCP-LBL9 is most likely due to the low number of cases with cutaneous biopsies in the current study, and in the different techniques (fluorescence in situ hybridization [FISH] vs RNA-seq) used to identify the gene fusions in the 2 studies. We also detected 2 KMT2A-like cases, which were classified as KMT2A-rearranged by ALLCatchR and characterized by MLLT10 rearrangement and increased HOXA9/HOXA10 expression.
Kinase/cytokine receptor-driven subtypes
The last major group of BCP-ALL is characterized by tyrosine kinase/cytokine receptor activation, resulting in constitutive kinase activity. In our BCP-LBL cohort, we observed ABL-class tyrosine kinase fusions BCR::ABL1 (n = 2), ETV6::ABL1 (n = 1), JAK-class tyrosine kinase fusion PAX5::JAK2 (n = 1), and cytokine receptor fusion P2RY8::CRLF2 (n = 1). Furthermore, 1 BCP-LBL sample out of 87 showed overexpression of CRLF2 without a chimeric transcript, possibly caused by a rearrangement of CRLF2 to the IGH enhance. Together, kinase/cytokine receptor-driven subtypes constituted 6% of the BCP-LBL cohort, which was comparable with that of BCP-ALL (8%).
Given the relative heterogeneity of our cohort in terms of material type (FFPE vs FF) or biopsy localization, we asked whether differences in the distribution of the identified subtypes could be observed. As shown in supplemental Figure 3, samples preserved as FFPE or FF showed no difference in subtype distribution, but there was a significant difference depending on the biopsy localization. Finally, for all the identified subtypes, the B-lymphopoiesis trajectories predicted by the ALLCatchR classifier were strikingly similar to those predicted in a pediatric BCP-ALL cohort (supplemental Figure 2).
In BCP-ALL, genetic-risk groups were defined as high-risk subtypes: iAMP21, ABL-class, KMT2A-rearranged, KMT2A-like, near haploid, low hypodiploid, and MYC-rearranged; intermediate-risk subtypes: IKZF1 N159Y, TCF3::PBX1, PAX5-altered, MEF2D-rearranged, BCP-ALL, and NOS; favorable-risk subtypes: DUX4-rearranged, HeH, ETV6::RUNX1, and NUTM1-rearranged (Figure 6D). Applying these categories to BCP-LBL, we identified high-risk genetics in 24% of the BCP-LBL cases. More relapses were observed in the group with high-risk genetics compared with the group without high-risk genetics but the cumulative incidence of relapse did not reach statistical significance (P = .2) (20%; 95% confidence interval, 4.4-43 vs 8.1%; 95% confidence interval, 2.5-18) (Figure 6E). There was no association between stage of disease and genetic-risk groups, as the distribution of stage I/II and stage III/IV was similar in the high-risk and nonhigh-risk groups (supplemental Figure 5).
Transcriptional comparison of BCP-LBL and BCP-ALL
The above shown analyses of RNA-seq data are limited to a set of genes able to discriminate among BCP-ALL subtypes. Next, we aimed to study how similar BCP-LBL and BCP-ALL are based on a whole-transcriptome comparison and whether we can identify a group of genes that are able to differentiate these 2 disease manifestations. The data shown in supplemental Figure 6A are the result of multidimensional scaling analysis performed on RNA-seq data of our BCP-LBL cohort in comparison with publicly available RNA-seq data from 40 pediatric BCP-ALL cases.30 Although the 2 manifestations clearly separate into 2 groups, the BCP-LBL samples have a marked variability as a group, with part of the samples showing a reduced distance relative to BCP-ALL, suggesting different degrees of similarities between BCP-LBL and BCP-ALL. By performing differential gene expression analysis, we found that the gene ontologies most significantly distinguishing BCP-LBL and BCP-ALL are associated with cell adhesion and collagen fibril organization and are therefore related to the different tissue organization of these 2 manifestations (supplemental Figure 6B).
Discussion
To our knowledge, this is the first study to date describing the genomic and transcriptomic landscape of pediatric BCP-LBL. Tissue material from patients with BCP-LBL is usually limited, hampering comprehensive molecular subtyping. However, we showed that the combination of WES and RNA-seq is able to detect genetic subtypes even in FFPE material. Our approach provides insight into the biology of BCP-LBL, its relation to BCP-ALL, and may also provide a basis for future diagnosis and risk stratification.
BCP-LBL is a malignancy of immature precursor B-cells, as demonstrated by the analysis of immunoglobulin and TR rearrangements, without any obvious difference from BCP-ALL regarding the maturation stage of the cell of origin. Although some studies have suggested that structural abnormalities, such as translocations, are more prevalent in leukemia, whereas numerical chromosome aberrations are more prevalent in lymphoma,10,31 this does not seem to apply to BCP neoplasms. For example, the frequency of aneuploidy-associated subtypes in BCP-LBL was not significantly different from that in BCP-ALL in our study. We found a broad overlap in somatic mutations between BCP-LBL and BCP-ALL. Nevertheless, for some of the mutated genes, the frequencies differed significantly between leukemia and lymphoma. Although alterations in genes encoding TFs of B-cell development, such as PAX5 and ETV6, were significantly more frequent in BCP-ALL, genes encoding epigenetic regulators (ARID1A, EP300, and KMT2D) were significantly more often mutated in BCP-LBL. This finding is of potential clinical relevance given that changes in the epigenome may be linked to drug resistance.29 We demonstrate that virtually all molecular subtypes identified in BCP-ALL were also present in BCP-LBL. We also show that a prediction tool trained on BCP-ALL gene expression data reliably identified subtypes in BCP-LBL, further stressing the genetic similarity between BCP-LBL and BCP-ALL. By comparing genetic-risk groups based on BCP-ALL, we show that patients with BCP-LBL with high-risk BCP-ALL genetics seem to have a higher cumulative incidence of relapse. However, this finding did not reach statistical significance, as the number of cases and events was too small for definite conclusions and, therefore, lack of statistical power. High-risk molecular subtypes occurred independent of disease stage, as single cases of stage I/II disease showed high-risk genetics. Thus, the clinical relevance and interdependence of stage, which is currently used for stratification of therapy and high-risk by molecular profiling, is still uncertain and requires larger cohorts to be analyzed to move forward using molecular risk-adapted treatment protocols.
In addition to finding fusions known from BCP-ALL, our study also led to the identification of novel fusions involving genes both known and not known in BCP-ALL, such as hitherto unknown fusion partners of TCF3 and PAX5 (GLIPR2 and BRD3, respectively). Another novel fusion involved mitochondrial translation optimization 1 (MTO1) and the membrane localization domain of junctophilin 3 (JPH3). One might speculate on the possible effect of this alteration on metabolism and protein translation but further studies are needed to understand its biological significance.
There are several limitations of our study. First, germ line DNA for most historic samples was not available; thus, we restricted the analysis to genes known to be drivers in BCP-ALL complemented with lymphoma genes and DNA repair genes to filter the BCP-LBL WES data. Thus, we cannot exclude that genes not previously reported in BCP-ALL may be mutated in BCL-LBL. Future analyses need to address this question, especially in BCP-LBL, in which no driver mutations known from BCP-ALL have been identified. Additionally, we found that a significant number of our BCP-LBL cases carried mutations in DNA repair genes. Future studies on paired tumor and normal DNA are needed to show whether germ line mutations in the DNA repair genes may play a role in BCP-LBL, similarly to what observed in BCP-ALL.32 Second, despite the absence of bias with respect to clinical parameters compared with previously published cohorts, our study may suffer from a selection bias due to the localization of the biopsies. A smaller cohort of BCP-LBL previously analyzed by FISH included 17% cases with cutaneous biopsies showing a frequency of KMT2A breakpoints of 19%,9 whereas in our current cohort with only 8% cutaneous biopsies, the frequency of KMT2A fusions was 5%. Understandably, cutaneous biopsies of pediatric patients are small and may often not qualify for molecular profiling, as conducted in the current study. Similarly, the frequency of BCP-LBL with ABL-class fusions needs to be finally determined in future studies using RNA-seq or break-apart FISH for the ABL-class kinase genes ABL1, ABL2, PDGFRB, and CSF1R. Whether these patients benefit from including imatinib in the treatment protocols need to be determined. Nevertheless, our study showed that molecular subtyping of BCP-LBL in analogy to BCL-ALL, may be helpful for individualized treatment decisions.
In summary, by carrying out a detailed molecular analysis of a large cohort of patient samples, we defined the mutational and transcriptional landscape of BCP-LBL. Our study revealed more similarities than differences between BCP-LBL and BCL-ALL, reinforcing the concept of the 2 manifestations of the same entity. In addition, the striking biological similarities between BCP-LBL and BCP-ALL challenge the concept of classification as leukemia or lymphoma based on the extent of BM infiltration. However, particularly in light of the molecular similarities defined here, it remains unanswered why BCP-LBL typically present as extramedullary disease whereas BCP-ALL present as medullary disease. Whole-transcriptome analysis suggested that BCP-LBL and BCP-ALL present as a continuum, in line with what has been described in the clinical presentation.2 Nevertheless, the expression of genes related to the tissue of origin is likely a strong confounding factor in whole-transcriptome analysis (supplemental Figure 6), as these genes could either contribute to the expansion of malignant B-cells in a certain environment or be considered pure tissue contaminants. Answering the highly relevant question of what causes either tissue or BM manifestation, will require a combination of in vivo and in vitro experimental approaches that go beyond the scope of this manuscript. Finally, our study provides a blueprint how to implement molecular analysis of BCP-LBL and thus presents the basis for further studies aimed at defining new genetics-based treatment protocols, in which patients with BCP-LBL may also benefit from new BCP-ALL treatment strategies.
Acknowledgments
The authors thank Dana Germer, Charlotte Botz von Drathen, Reina Zuhlke-Jenisch, and Lorena Valles Uriarte for excellent technical support. The authors thank the Princess Máxima Center Biobank and Dutch Pathology register PALGA for access to the material. The authors thank the University Medical Center Utrecht Pathology Department and Princess Máxima Center Diagnostic Laboratory for their excellent technical support. The authors thank Jules Meijerink for his role in awarding the grant. The authors are indebted to the patients, parents, and treating physicians for their contribution.
This work was supported by Stichting Kinderen Kankervrij (grant number 393) (J.L.C.L.), the Deutsche Forschungsgemeinschaft-funded clinical research unit CATCH ALL (KFO 5010/1), the KinderKrebsinitiative Buchholz (W.K., I.I.), Holm-Seppensen, the Ferenc Foundation (A.B.), and a grant from the Onderwater family (J.L.C.L., A.B.). B.B. is supported by the Deutsche Kinderkrebsstiftung Buchholz, Germany, to conduct the NHL-BFM Registry 2012.
Authorship
Contribution: M.L.d.B., J.M.B., J.L.C.L., A.B., I.I., and W.K. designed the study; L.A.K., M.K., M.M., M.P.H., and R.S.B. performed and analyzed the sequencing experiments; E.K., I.I., M.M.K., T.B., M.B., R.P.K., and J.M.B. analyzed and interpreted the molecular and clinical data; M.A.S.-V. and W.K. analyzed and interpreted the histopathology data; N.G., A.A., J.V.-A., R.S., E.M., A.B., and J.L.C.L. collected patient samples; K.S., L.A.P., G.C., and B.B. provided patient data; B.B., M.B., R.P.K., C.D.B., T.B., and L.A.P. provided important advice; E.K., I.I., J.M.B., and W.K. wrote the manuscript; and all other authors reviewed and approved the final version of the manuscript.
Conflict-of-interest disclosure: W.K. reports research funding from Roche, Amgen, Regeneron, Takeda, Janssen, Incyte, and advisory role (Roche) with all activities on behalf of the institution and without any relevance to the current project. G.C. received lecture fees from Amgen and Servier; and consultant fees and travel support from Jazz Pharmaceutical. C.D.B. reports advisory and speaker honoraria from AstraZeneca, Bristol Myers Squibb, Janssen, Kite, Novartis, Jazz Pharmaceutical, Astellas, and Amgen. E.M. has received speaker fees from Servier and served as the past President of the European Hematology Association. M.B. is contracted to carry out research on Affimed, Amgen, and Regeneron; is a member of the advisory boards of Amgen and Incyte; and participates in the speaker bureaus of Amgen, Janssen, Pfizer, and Roche. B.B. reports research funding from Roche; acts in advisory role with Miltenyi Biotec, Novartis, AbbVie, and Roche, with all activities on behalf of the institution and without any relevance to the current project. The remaining authors declare no competing financial interests.
Correspondence: Wolfram Klapper, Department of Pathology, Hematopathology Section and Lymph Node Registry, University Medical Center Schleswig-Holstein, Campus Kiel, Arnold-Heller-Str 3, D-24105 Kiel, Germany; email: wklapper@path.uni-kiel.de; and Judith M. Boer, Princess Máxima Center for Pediatric Oncology, Heidelberglaan 25, 3584CS Utrecht, The Netherlands; email: j.m.boer-20@prinsesmaximacentrum.nl.
References
Author notes
E.K. and I.I. contributed equally to this study.
J.M.B. and W.K. contributed equally to this study.
Next-generation sequencing data (RNA and whole-exome sequencing) have been deposited in the European Genome-phenome Archive (accession number EGAS50000000289 and EGAS50000000290, respectively).
The online version of this article contains a data supplement.
There is a Blood Commentary on this article in this issue.
The publication costs of this article were defrayed in part by page charge payment. Therefore, and solely to indicate this fact, this article is hereby marked “advertisement” in accordance with 18 USC section 1734.

This feature is available to Subscribers Only
Sign In or Create an Account Close Modal