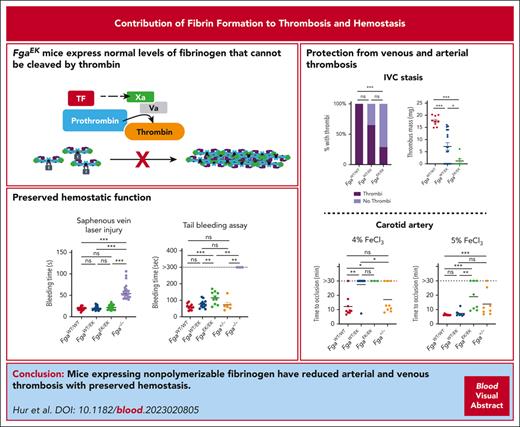
Mice expressing nonpolymerizable fibrinogen are protected against venous thrombosis and have suppressed arterial thrombosis.
Selective prevention of fibrin polymerization had minimal influence on hemostasis.
Visual Abstract
Elevated circulating fibrinogen levels correlate with increased risk for both cardiovascular and venous thromboembolic diseases. In vitro studies show that formation of a highly dense fibrin matrix is a major determinant of clot structure and stability. Here, we analyzed the impact of nonpolymerizable fibrinogen on arterial and venous thrombosis as well as hemostasis in vivo using FgaEK mice that express normal levels of a fibrinogen that cannot be cleaved by thrombin. In a model of carotid artery thrombosis, FgaWT/EK and FgaEK/EK mice were protected from occlusion with 4% ferric chloride (FeCl3) challenges compared with wild-type (FgaWT/WT) mice, but this protection was lost, with injuries driven by higher concentrations of FeCl3. In contrast, fibrinogen-deficient (Fga−/−) mice showed no evidence of occlusion, even with high-concentration FeCl3 challenge. Fibrinogen-dependent platelet aggregation and intraplatelet fibrinogen content were similar in FgaWT/WT, FgaWT/EK, and FgaEK/EK mice, consistent with preserved fibrinogen–platelet interactions that support arterial thrombosis with severe challenge. In an inferior vena cava stasis model of venous thrombosis, FgaEK/EK mice had near complete protection from thrombus formation. FgaWT/EK mice also displayed reduced thrombus incidence and a significant reduction in thrombus mass relative to FgaWT/WT mice after inferior vena cava stasis, suggesting that partial expression of nonpolymerizable fibrinogen was sufficient for conferring protection. Notably, FgaWT/EK and FgaEK/EK mice had preserved hemostasis in multiple models as well as normal wound healing times after skin incision, unlike Fga−/− mice that displayed significant bleeding and delayed healing. These findings indicate that a nonpolymerizable fibrinogen variant can significantly suppress occlusive thrombosis while preserving hemostatic potential in vivo.
Introduction
Thrombotic diseases are the leading cause of death in the United States.1 Cardiovascular disease and arterial thrombosis (AT) accounted for ∼20% of deaths in 20202 and are the leading cause of quality-of-life reduction.3-5 Venous thromboembolism affects ∼900 000 people annually in the United States, resulting in up to 100 000 deaths.6 Different mechanisms drive arterial and venous thrombosis. In AT, atherosclerotic plaque rupture and subsequent subendothelium exposure induce platelet aggregation and activation, leading to the formation of a platelet-rich thrombus.7 In venous thromboembolism, stasis of blood flow activates endothelial cells, triggers inflammation, and initiates the coagulation cascade, leading to a fibrin- and red blood cell (RBC)-rich thrombus.7 Despite unique modes of pathogenesis, quantitative and qualitative differences in fibrin(ogen) are major determinants of both arterial and venous thrombosis.
Activation of coagulation results in thrombin-mediated cleavage of monomeric fibrinogen to fibrin that self-polymerizes to form a fibrin matrix. In healthy individuals, fibrinogen circulates in plasma at a concentration of 2 to 4 mg/mL. Elevated circulating fibrinogen levels positively correlate with thrombosis risk in humans and mice.8 Hyperfibrinogenemia promotes increased coagulability and the formation of a dense and fibrinolysis-resistant fibrin matrix.8-11 Dense fibrin matrixes with highly branched fibrils support robust RBC retention and suppress platelet/fibrin-mediated clot contraction, resulting in delayed clot clearance.12,13 Conversely, genetically imposed hypofibrinogenemia or pharmacological reduction of circulating fibrinogen significantly reduces experimental venous thrombus formation in mice.14
Despite multiple documented correlations between fibrin(ogen) and thrombus formation,15-17 the specific roles of monomeric fibrinogen and polymerized fibrin in thrombosis and hemostasis in vivo have been largely unexplored. Here, we sought to selectively abrogate fibrin matrix formation with a nonpolymerizable fibrinogen variant to determine its impact on arterial and venous thrombotic challenges. To this end, we used FgaEK mice that express normal levels of fibrinogen with a mutation in the thrombin cleavage site sequence of the Aα-chain.18 The retention of fibrinopeptide A (FpA) in the FgaEK variant prevents A-knob/hole interactions required for fibrin polymerization.19 Thus, this variant is “locked” in the form of a fibrinogen monomer. Here, we show that mice carrying the nonpolymerizable fibrinogen variant in the heterozygous (FgaWT/EK) or the homozygous state (FgaEK/EK) were protected from venous thrombosis and AT, depending on the severity of the injury. However, both FgaWT/EK and FgaEK/EK mice had preserved hemostatic potential linked to normal platelet function.
Materials and methods
Detailed materials and methods may be found in the supplemental Materials and Methods, References, and Figures, available on the Blood website.
Mice
Mouse models of AT and venous thrombosis
The inferior vena cava (IVC) stasis model was performed as previously described.21 Side branches were ligated, and the lumbar branches cauterized. After 24 hours, thrombi were isolated from the IVC and weighed. Histological analyses were performed on 5-μm sections of formalin-fixed paraffin-embedded tissues using antibodies against fibrinogen (GAM-FGB-BIO, Thermo Fisher Scientific), CD41 (EPR17876, Abcam), and Ly6G (InVivoMab, Bio X Cell). The ferric chloride (FeCl3) model of AT was performed as previously described.22,23 Briefly, filter paper (1-2 mm2) soaked in 4% to 10% FeCl3 solution, was placed on the carotid artery for 1 to 3 minutes. Blood flow was measured for 30 minutes using a microvascular ultrasonic flow probe. Time to occlusion was defined as cessation of blood flow for ≥2 minutes. An embolic event was defined as a change in blood flow of >0.5 mL/min within 1 minute. Intravital microscopy was performed by injecting Alexa Fluor 488–conjugated antibodies to glycoprotein IX (2.5 μg, clone Xia.B4, Emfret Analytics) before FeCl3 application.
Mouse models of hemostasis and wound healing
Tail bleeding times were measured as previously described.14 A 3-mm tail tip was excised from anesthetized mice and the tail was submerged in Tris-buffered saline (pH 7.5) containing 2 mM calcium chloride at 37°C until cessation of bleeding was sustained for >30 seconds. Laser-induced saphenous vein injury was performed as previously described.24 Briefly, mice were injected with Alexa Fluor 488–conjugated antibodies to glycoprotein IX (2.5 μg; clone Xia.B4, Emfret Analytics) to detect platelets and labeled fibrinogen (100 μg per mouse) isolated from wild-type (FgaWT/WT), FgaWT/EK, or FgaEK/EK mice. Fga−/− mice were injected with Alexa Fluor 647–conjugated antibodies against fibrin (2 μg per mouse; gift from Rodney Camire). Platelet and fibrin accumulation at laser injury sites were assessed by intravital microscopy. Wound healing assay was performed as previously described.25 Briefly, a 1-cm incision was made on the dorsal skin, and monitored daily for 15 days. The wound site was fixed for histological evaluation.
Statistical analyses
Data was analyzed using Prism 9. Comparisons of multiple groups were performed using one-way analysis of variance, Kruskal-Wallis, or Mantel-Cox tests. Results were considered significant when P < .05.
Results
FgaEK mice are protected from AT, depending on the severity of injury, but display normal platelet aggregation responses in vitro
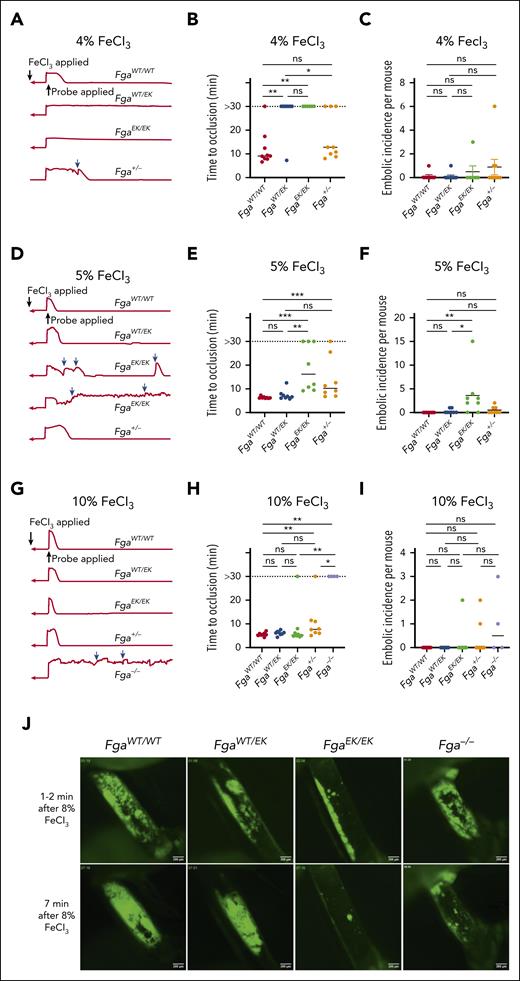
To examine the impact of nonpolymerizable fibrinogen on AT, 3-minute FeCl3 carotid artery injuries were performed. At a challenge dose of 4% FeCl3, FgaEK/EK mice were significantly protected from vascular occlusion. Interestingly, FgaWT/EK mice also displayed near complete protection, with only 1 animal developing an occlusive thrombus (Figure 1A-B). Only a subset of Fga+/− mice, which express 50% of WT fibrinogen (FibWT) levels, developed occlusive thrombi, without a significant difference in the overall time to occlusion from that of FgaWT/WT mice (Figure 1A-B). In Fga+/− mice, a trend toward an increased number of embolic events was observed (Figure 1C). After a 5%-FeCl3 challenge, FgaEK/EK mice displayed a reduction in the incidence of occlusive thrombi and a significant delay in time to occlusion compared with FgaWT/WT and FgaWT/EK mice (Figure 1D-E). The number of embolic events was significantly elevated in FgaEK/EK mice relative to that in FgaWT/WT and FgaWT/EK animals (Figure 1F) at this challenge dose. Increasing to 10% FeCl3 resulted in FgaWT/WT, FgaWT/EK, and FgaEK/EK mice displaying comparable flow profiles, characterized by similar mean times to occlusion (Figure 1G-H). Time to occlusion in Fga+/− mice was similar compared with that in FgaWT/EK mice but delayed compared with that in FgaWT/WT mice. In contrast, Fga−/− mice displayed little reduction in flow and did not develop occlusive thrombi over the entire 30-minute observation period (Figure 1G-H). Few embolic events were detected in any genotype with the 10% FeCl3 challenge (Figure 1I). In separate studies, the development of arterial thrombi was visualized by intravital microscopy immediately after challenging the mice with 8% FeCl3 for only 1 minute. There was a gradual and persistent accumulation of platelets at the injury site in FgaWT/WT and FgaWT/EK mice (Figure 1J; supplemental Video 1). In contrast, FgaEK/EK platelets formed small thrombi that were quickly dislodged. Results in Fga−/− mice were similar to that in FgaEK/EK mice, except that larger platelet clusters formed before embolization.
FgaWT/EK and FgaEK/EK mice are protected against the FeCl3-induced model of AT depending on injury severity. (A) Representative traces of blood flow, (B) vessel occlusion times, and (C) embolic incidence per mouse after a 3-minute exposure of 4% FeCl3 in FgaWT/WT, FgaWT/EK, FgaEK/EK, and Fga+/− mice. (D) Representative traces of blood flow, (E) vessel occlusion times, and (F) embolic incidence per mouse after 3-minute exposure of 5% FeCl3 in FgaWT/WT, FgaWT/EK, FgaEK/EK, and Fga+/− mice. (G) Representative traces of blood flow, (H) vessel occlusion times, and (I) embolic incidence per mouse after 3-minute exposure of 10% FeCl3 in FgaWT/WT, FgaWT/EK, FgaEK/EK, Fga+/−, and Fga−/− mice. Blue arrows indicate embolic events. Horizontal bars indicate the median. Data were analyzed using Kruskal-Wallis test. (J) Representative images of platelet accumulation (green) in the carotid arteries after injury with 8% FeCl3 for 1 minute. ∗P < .05; ∗∗P < .01; ∗∗∗P < .001. min, minute; ns, not significant.
FgaWT/EK and FgaEK/EK mice are protected against the FeCl3-induced model of AT depending on injury severity. (A) Representative traces of blood flow, (B) vessel occlusion times, and (C) embolic incidence per mouse after a 3-minute exposure of 4% FeCl3 in FgaWT/WT, FgaWT/EK, FgaEK/EK, and Fga+/− mice. (D) Representative traces of blood flow, (E) vessel occlusion times, and (F) embolic incidence per mouse after 3-minute exposure of 5% FeCl3 in FgaWT/WT, FgaWT/EK, FgaEK/EK, and Fga+/− mice. (G) Representative traces of blood flow, (H) vessel occlusion times, and (I) embolic incidence per mouse after 3-minute exposure of 10% FeCl3 in FgaWT/WT, FgaWT/EK, FgaEK/EK, Fga+/−, and Fga−/− mice. Blue arrows indicate embolic events. Horizontal bars indicate the median. Data were analyzed using Kruskal-Wallis test. (J) Representative images of platelet accumulation (green) in the carotid arteries after injury with 8% FeCl3 for 1 minute. ∗P < .05; ∗∗P < .01; ∗∗∗P < .001. min, minute; ns, not significant.
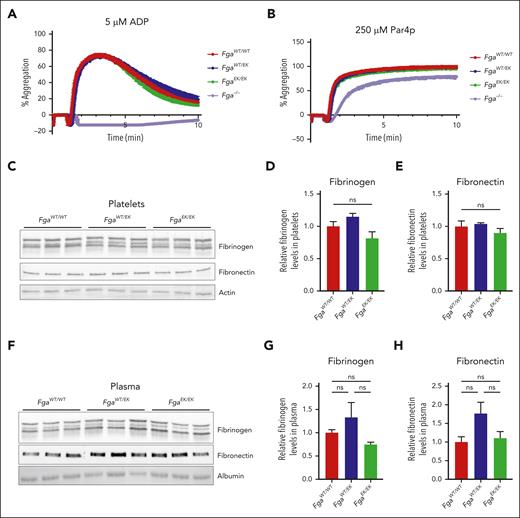
The formation of occlusive thrombi following severe injury in FgaEK/EK mice was hypothesized to be linked to preserved fibrinogenEK-dependent platelet functions. Platelet aggregation responses were measured in platelet-rich plasma (PRP) isolated from mice of each genotype after activation with adenosine 5′-diphosphate or protease-activated receptor 4–activating peptide (Par4p). Equivalent aggregation was observed for FgaWT/WT, FgaWT/EK, and FgaEK/EK platelets regardless of the activator (Figure 2A-B). Fga−/− platelets failed to aggregate in response to adenosine 5′-diphosphate (Figure 2A) but displayed preserved aggregation in response to Par4p stimulation (Figure 2B), similar to findings in previous studies.14,26-28 The relative amounts of fibrinogen and fibronectin in washed platelets and in plasma were similar among FgaWT/WT, FgaWT/EK, and FgaEK/EK mice (Figure 2C-H), suggesting that the FgaEK mutation does not alter the uptake or compartmentalization of these key extracellular matrix molecules in platelets.
Platelet aggregation and intraplatelet levels of fibrinogen and fibronectin are unaltered in FgaEK mice. Aggregation traces of platelet-rich plasma collected from FgaWT/WT, FgaWT/EK, FgaEK/EK, and Fga−/− mice after stimulation with (A) 5 μM adenosine 5′-diphosphate (ADP; n = 4 per genotype) or (B) 250 μM protease-activated receptor 4 activating peptide (Par4p; n = 4 per genotype). (C) Western blot (WB) analyses for fibrinogen, fibronectin, and actin of platelet lysates harvested from FgaWT/WT, FgaWT/EK, and FgaEK/EK mice. Quantification of platelet (D) fibrinogen and (E) fibronectin from the WBs. (F) Western blot analyses for fibrinogen, fibronectin, and albumin of plasma harvested from FgaWT/WT, FgaWT/EK, and FgaEK/EK mice (n = 3 per genotype). Quantification of plasma (G) fibrinogen and (H) fibronectin from the WBs. Data are presented as the mean ± standard error of the mean (SEM), and analyzed using one-way analysis of variance (ANOVA).
Platelet aggregation and intraplatelet levels of fibrinogen and fibronectin are unaltered in FgaEK mice. Aggregation traces of platelet-rich plasma collected from FgaWT/WT, FgaWT/EK, FgaEK/EK, and Fga−/− mice after stimulation with (A) 5 μM adenosine 5′-diphosphate (ADP; n = 4 per genotype) or (B) 250 μM protease-activated receptor 4 activating peptide (Par4p; n = 4 per genotype). (C) Western blot (WB) analyses for fibrinogen, fibronectin, and actin of platelet lysates harvested from FgaWT/WT, FgaWT/EK, and FgaEK/EK mice. Quantification of platelet (D) fibrinogen and (E) fibronectin from the WBs. (F) Western blot analyses for fibrinogen, fibronectin, and albumin of plasma harvested from FgaWT/WT, FgaWT/EK, and FgaEK/EK mice (n = 3 per genotype). Quantification of plasma (G) fibrinogen and (H) fibronectin from the WBs. Data are presented as the mean ± standard error of the mean (SEM), and analyzed using one-way analysis of variance (ANOVA).
FgaEK/EK mice are protected from venous thrombosis
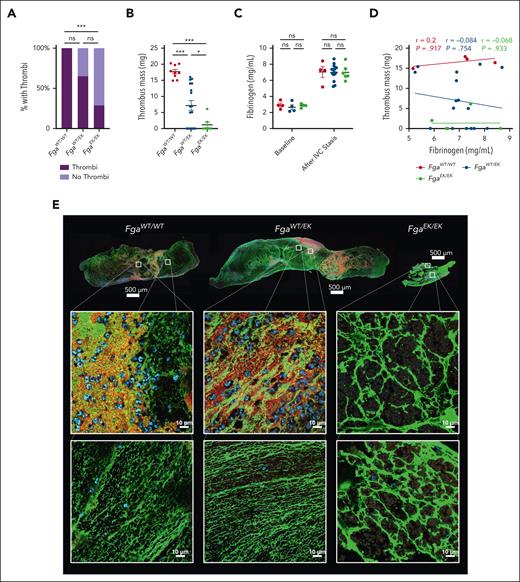
To examine the impact of nonpolymerizable fibrinogen on venous thrombosis, an IVC stasis model was performed. Large thrombi were observed in all FgaWT/WT mice after 24 hours. However, FgaEK/EK mice had significantly reduced incidence of thrombus formation compared with FgaWT/WT mice, with only ∼30% of animals developing measurable thrombi (Figure 3A). In addition, ∼30% of FgaWT/EK developed no measurable thrombi, although this difference did not achieve statistical significance relative to FgaWT/WT mice (Figure 3A). Notably, the masses of thrombi that did form were reduced in both FgaWT/EK and FgaEK/EK mice relative to FgaWT/WT mice (Figure 3B). Previous work revealed that the IVC stasis surgery drives an acute phase response resulting in significantly elevated plasma fibrinogen levels.14 Comparable increases in fibrinogen levels were observed in each of the genotypes after the IVC stasis procedure (Figure 3C) and no correlations were observed between thrombus mass and the circulating fibrinogen levels after IVC stasis (Figure 3D). Fibrin networks were observed in FgaWT/WT and FgaWT/EK thrombi, whereas FgaEK/EK thrombi contained thick aggregates or clumps of fibrinogen that were morphologically distinct (Figure 3E). In FgaWT/WT and FgaWT/EK thrombi, there was a heterogenous distribution of platelets and neutrophils. However, the material isolated from those few FgaEK/EK mice with thrombi consisted of areas that contained neutrophils and RBCs but were largely devoid of platelets (Figure 3E; supplemental Figure 1).
FgaEK/EK and FgaWT/EK mice are protected from venous thrombosis. (A) Incidence of thrombus formation and (B) thrombus weights from FgaWT/WT, FgaWT/EK, and FgaEK/EK mice 24 hours after IVC ligation (stasis model). (C) Circulating fibrinogen levels of before and after IVC ligation measured by enzyme-linked immunosorbent assay. (D) Spearman correlation analysis of circulating fibrinogen level after ligation, and thrombus mass. Data are presented as the mean ± SEM and analyzed using Kruskal-Wallis test. (E) Representative images of 5-μm-thick sections of thrombi stained against fibrin(ogen) (green), CD41 (red), and DAPI (4′,6-diamidino-2-phenylindole) (blue). Note that FgaEK/EK thrombi contained minimal platelets and nucleated cells as well as morphologically distinct aggregates of fibrinogen compared with FgaWT/WT and FgaWT/EK thrombi that display web-like fibrin matrixes. ∗P < .05; ∗∗∗P < .001.
FgaEK/EK and FgaWT/EK mice are protected from venous thrombosis. (A) Incidence of thrombus formation and (B) thrombus weights from FgaWT/WT, FgaWT/EK, and FgaEK/EK mice 24 hours after IVC ligation (stasis model). (C) Circulating fibrinogen levels of before and after IVC ligation measured by enzyme-linked immunosorbent assay. (D) Spearman correlation analysis of circulating fibrinogen level after ligation, and thrombus mass. Data are presented as the mean ± SEM and analyzed using Kruskal-Wallis test. (E) Representative images of 5-μm-thick sections of thrombi stained against fibrin(ogen) (green), CD41 (red), and DAPI (4′,6-diamidino-2-phenylindole) (blue). Note that FgaEK/EK thrombi contained minimal platelets and nucleated cells as well as morphologically distinct aggregates of fibrinogen compared with FgaWT/WT and FgaWT/EK thrombi that display web-like fibrin matrixes. ∗P < .05; ∗∗∗P < .001.
To begin to identify the mechanism by which nonpolymerizable fibrinogen suppresses venous thrombosis, we first performed standard clinical clotting tests. FgaWT/EK plasma had a modest but statistically significant delay in thrombin time, compared with FgaWT/WT and Fga+/− plasma (supplemental Figure 2A). In contrast, FgaWT/EK plasma performed similarly to Fga+/− plasma in prothrombin time and activated partial thromboplastin time assays with a slight delay in prothrombin time for each compared with that of FgaWT/WT plasma (supplemental Figure 2B-C). FgaEK/EK and Fga−/− plasma did not form clots (supplemental Figure 2A-C). Next, thromboelastography analyses were performed with and without tissue plasminogen activator (tPA). In the absence of tPA, robust clots formed over similar time scales in FgaWT/WT, FgaWT/EK, and Fga+/− whole blood. FgaEK/EK and Fga−/− whole blood did not form detectable clots by thromboelastography (Figure 4A). The maximum amplitude (MA) of FgaWT/EK and Fga+/− clots were comparable with each other but significantly lower than that of FgaWT/WT clots (Figure 4B). Intriguingly, the α angle, indicative of fibrin accumulation, was lower in Fga+/− clots compared with FgaWT/EK clots (Figure 4C). No differences were observed in the clot initiation time between FgaWT/WT, FgaWT/EK and Fga+/− clots (Figure 4D). In the presence of tPA, no significant differences in the MA, α angle or R were observed among FgaWT/WT, FgaWT/EK and Fga+/− clots (Figure 4E-H). However, the LY30 (ie, the percent reduction 30 minutes after MA) was significantly higher in FgaWT/WT and Fga+/− clots compared with FgaWT/EK clots (Figure 4I), consistent with a previous report indicating reduced plasmin generation in FgaWT/EK plasma.29 The impact of nonpolymerizable fibrin on whole-blood clot retraction was evaluated in vitro by measuring the clot mass remaining 2 hours after coagulation initiation in whole blood. Although no clots were formed in FgaEK/EK and Fga−/− whole blood, the final masses after retraction among FgaWT/WT, FgaWT/EK, and Fga+/− clots were virtually identical (Figure 4J). The activation rates of factor XIII (FXIII), which catalyzes fibrin fiber crosslinking, were similar in FgaWT/WT, FgaWT/EK, and FgaEK/EK plasma (Figure 4K-L), indicating that the nonpolymerizable fibrinogen variant supported normal FXIIIa activation. To elucidate the ramifications of a nonpolymerizable fibrin on structure, clots made from FgaWT/WT and FgaWT/EK platelet-poor plasma were analyzed by scanning electron microscopy (Figure 4M). The fiber diameters of FgaWT/EK clots were increased compared with those of FgaWT/WT clots (Figure 4N). Interestingly, the fibers from FgaWT/EK clots appeared to have more branch points, with a significant increase in the number of fiber terminal ends (Figure 4O).
FgaWT/EK clots have comparable mechanical strength and are resistant to lysis that is not accounted for by differences in clot contraction or FXIII activation. (A) Mean thromboelastography (TEG) curve tracings of whole blood activated with tissue factor and calcium. (B) Maximum amplitude (MA), (C) α angle (degree [deg]), and (D) clot initiation time (R) of whole blood isolated from FgaWT/WT, FgaWT/EK, FgaEK/EK, Fga+/−, and Fga−/− mice. (E) Mean TEG curve tracings of whole blood activated with tissue factor and calcium in the presence of 1.5 μg/mL of tPA. (F) MA, (G) α angle, (H) R time, and (I) percentage of lysis 30 minutes after reaching MA (LY30) of whole blood isolated from FgaWT/WT, FgaWT/EK, and Fga+/− mice. (J) Clot mass after clot retraction. (K) Representative western blots and (L) quantification (n = 3 per genotype) of FXIIIa during time course of thrombin-initiated clotting in FgaWT/WT, FgaWT/EK, and FgaEK/EK plasma. (M) Representative scanning electron microscopy images of clots made with platelet-poor plasma of FgaWT/WT and FgaWT/EK mice. Arrows indicate fiber termini. (N) Diameters of fibrin fibers of FgaWT/WT and FgaWT/EK clots. Large dots indicate biological replicates and small dots indicate total fibers analyzed from all samples. (O) Quantification of the number of fiber terminal ends per fiber in clots made from FgaWT/WT and FgaWT/EK mice. Data are presented as the mean ± SEM and analyzed using one-way ANOVA. ∗P < .05; ∗∗P < .01; ∗∗∗P < .001.
FgaWT/EK clots have comparable mechanical strength and are resistant to lysis that is not accounted for by differences in clot contraction or FXIII activation. (A) Mean thromboelastography (TEG) curve tracings of whole blood activated with tissue factor and calcium. (B) Maximum amplitude (MA), (C) α angle (degree [deg]), and (D) clot initiation time (R) of whole blood isolated from FgaWT/WT, FgaWT/EK, FgaEK/EK, Fga+/−, and Fga−/− mice. (E) Mean TEG curve tracings of whole blood activated with tissue factor and calcium in the presence of 1.5 μg/mL of tPA. (F) MA, (G) α angle, (H) R time, and (I) percentage of lysis 30 minutes after reaching MA (LY30) of whole blood isolated from FgaWT/WT, FgaWT/EK, and Fga+/− mice. (J) Clot mass after clot retraction. (K) Representative western blots and (L) quantification (n = 3 per genotype) of FXIIIa during time course of thrombin-initiated clotting in FgaWT/WT, FgaWT/EK, and FgaEK/EK plasma. (M) Representative scanning electron microscopy images of clots made with platelet-poor plasma of FgaWT/WT and FgaWT/EK mice. Arrows indicate fiber termini. (N) Diameters of fibrin fibers of FgaWT/WT and FgaWT/EK clots. Large dots indicate biological replicates and small dots indicate total fibers analyzed from all samples. (O) Quantification of the number of fiber terminal ends per fiber in clots made from FgaWT/WT and FgaWT/EK mice. Data are presented as the mean ± SEM and analyzed using one-way ANOVA. ∗P < .05; ∗∗P < .01; ∗∗∗P < .001.
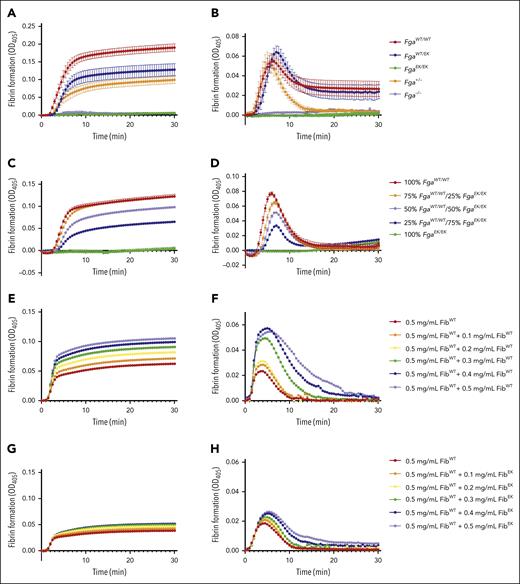
To further examine the genotype-dependent differences in fibrin formation, turbidity assays were performed. The turbidity profile of FgaWT/EK plasma was lower than FgaWT/WT plasma but modestly higher than that observed for Fga+/− plasma (Figure 5A). FgaEK/EK and Fga−/− plasma did not display any changes in turbidity (Figure 5A), consistent with a complete absence of fibrin formation. In the presence of tPA, initial clot formation was similar among FgaWT/WT, FgaWT/EK, and Fga+/− plasma, but Fga+/− clots displayed significantly faster lysis than both FgaWT/WT and FgaWT/EK clots (Figure 5B), suggesting that the presence of nonpolymerizable fibrinogen stabilized the fibrin matrix that did form. When FgaWT/WT and FgaEK/EK plasma were mixed in different ratios, there was a dose-dependent decrease in the MA of the turbidity profile with increasing proportions of FgaEK/EK plasma (Figure 5C). This reduction in turbidity was observed although total fibrinogen concentrations were equivalent across each condition. In the presence of tPA, increasing the ratio of FgaEK/EK plasma produced clots with reduced maximum turbidity. Interestingly, the times at which the clots were completely degraded were similar regardless of the ratio of FgaEK/EK plasma (Figure 5D). Complementary studies were performed using a constant concentration of FibWT from FgaWT/WT mice to which increasing amounts of FibWT or fibrinogen from FgaEK/EK mice (FibEK) were added. Increasing FibWT resulted in a dose-dependent increase in turbidity (Figure 5E; supplemental Figure 3A-C) and a delay in fibrinolysis (Figure 5F; supplemental Figure 3G-J). In sharp contrast, supplementing increasing FibEK to a constant level of FibWT resulted in little to no change in turbidity over the same concentration range evaluated for FibWT (Figure 5G; supplemental Figure 3D-F). Interestingly, there was a modest delay and reduction in fibrinolysis with increasing amounts of FibEK in the reaction mixtures (Figure 5H; supplemental Figure 3K-N), suggesting that the presence of nonpolymerizable fibrinogen was suppressing fibrinolysis.
Nonpolymerizable fibrinogenEK limits fibrin formation and suppresses fibrinolysis. (A-B) Turbidity analysis of FgaWT/WT, FgaWT/EK, FgaEK/EK, Fga+/−, and Fga−/− plasma (n = 3) in the (A) absence and (B) presence of 2 μg/mL of tPA. (C-D) Turbidity analysis of plasma containing different ratios of FgaWT/WT and FgaEK/EK plasma (n = 3 per ratio) in the (C) absence and (D) presence of tPA. (E-F) Turbidity analysis using increasing amount of purified FibWT reconstituted (0.5-1.0 mg/mL) in Fga−/− plasma (n = 2) in the (E) absence and (F) presence of tPA. (G-H) Turbidity analysis using purified FibWT (0.5 mg/mL) and increasing amounts of purified FibEK (0-0.5 mg/mL) reconstituted in Fga−/− plasma (n = 2) in the (G) absence and (H) presence of tPA. OD, optical density.
Nonpolymerizable fibrinogenEK limits fibrin formation and suppresses fibrinolysis. (A-B) Turbidity analysis of FgaWT/WT, FgaWT/EK, FgaEK/EK, Fga+/−, and Fga−/− plasma (n = 3) in the (A) absence and (B) presence of 2 μg/mL of tPA. (C-D) Turbidity analysis of plasma containing different ratios of FgaWT/WT and FgaEK/EK plasma (n = 3 per ratio) in the (C) absence and (D) presence of tPA. (E-F) Turbidity analysis using increasing amount of purified FibWT reconstituted (0.5-1.0 mg/mL) in Fga−/− plasma (n = 2) in the (E) absence and (F) presence of tPA. (G-H) Turbidity analysis using purified FibWT (0.5 mg/mL) and increasing amounts of purified FibEK (0-0.5 mg/mL) reconstituted in Fga−/− plasma (n = 2) in the (G) absence and (H) presence of tPA. OD, optical density.
FgaEK mice display preserved hemostatic potential
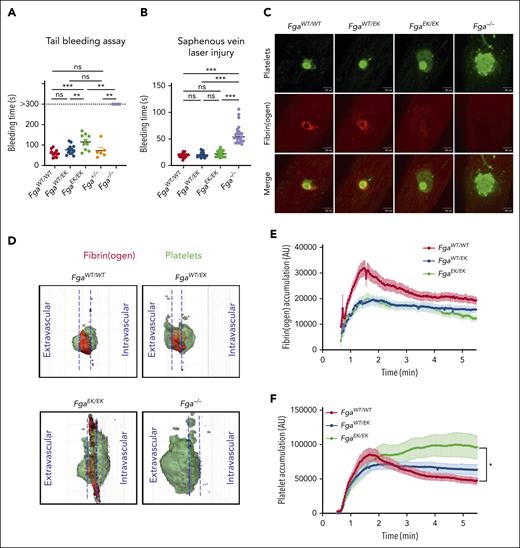
To first examine whether expression of nonpolymerizable fibrinogen alters hemostasis, tail bleeding analyses were performed. Although Fga−/− mice did not stop bleeding within a 5-minute observation window, FgaEK/EK mice uniformly achieved hemostasis, although the bleeding times were modestly increased compared with that of FgaWT/WT and FgaWT/EK mice (Figure 6A). Bleeding times of FgaWT/EK mice were similar to that of FgaWT/WT mice, indicating that nonpolymerizable fibrinogen, either alone or in combination with WT fibrinogen, does not prohibit hemostasis under these conditions.
FgaEK/EK mice have preserved hemostatic potential. (A) Time to cessation of bleeding (sustained >30 seconds) of FgaWT/WT, FgaWT/EK, FgaEK/EK, Fga+/−, and Fga−/− mice after 3-mm excision of the distal portion of the tail. Horizontal bar indicates the mean with data analyzed using the Kaplan-Meier log-rank test. (B) Time to cessation of bleeding of FgaWT/WT, FgaWT/EK, FgaEK/EK, and Fga−/− mice after laser-induced saphenous vein injury (n = 18-23 per genotype). Horizontal bar indicates the mean, with data analyzed using one-way ANOVA. (C) Representative images of platelet plug (green), fibrin(ogen) (red), and merged panels 5 minutes after laser-induced saphenous vein injury. (D) Representative 3-dimensional reconstruction of injury sites depicting the side view after injury. Each grid box = 50 μm × 50 μm. Quantification of (E) fibrin(ogen) and (F) platelet accumulation at the site of injury. Data are expressed as the mean ± SEM, and analyzed using one-way ANOVA. ∗P < .05; ∗∗P < .01; ∗∗∗P < .001. s, second.
FgaEK/EK mice have preserved hemostatic potential. (A) Time to cessation of bleeding (sustained >30 seconds) of FgaWT/WT, FgaWT/EK, FgaEK/EK, Fga+/−, and Fga−/− mice after 3-mm excision of the distal portion of the tail. Horizontal bar indicates the mean with data analyzed using the Kaplan-Meier log-rank test. (B) Time to cessation of bleeding of FgaWT/WT, FgaWT/EK, FgaEK/EK, and Fga−/− mice after laser-induced saphenous vein injury (n = 18-23 per genotype). Horizontal bar indicates the mean, with data analyzed using one-way ANOVA. (C) Representative images of platelet plug (green), fibrin(ogen) (red), and merged panels 5 minutes after laser-induced saphenous vein injury. (D) Representative 3-dimensional reconstruction of injury sites depicting the side view after injury. Each grid box = 50 μm × 50 μm. Quantification of (E) fibrin(ogen) and (F) platelet accumulation at the site of injury. Data are expressed as the mean ± SEM, and analyzed using one-way ANOVA. ∗P < .05; ∗∗P < .01; ∗∗∗P < .001. s, second.
Hemostasis was subsequently evaluated using a laser-induced saphenous vein injury model.24,30 No differences were observed in the bleeding time periods between FgaWT/WT, FgaWT/EK, and FgaEK/EK mice, whereas there was a significant delay in that of Fga−/− mice (Figure 6B). In FgaWT/WT and FgaWT/EK mice, a defined ring of fibrin(ogen) deposition around a platelet core was observed at the injury site. In contrast, fibrinogen accumulation was diffuse and dispersed throughout the injury site in FgaEK/EK mice, and nonexistent in Fga−/− mice (Figure 6C; supplemental Video 2). Three-dimensional reconstruction of the hemostatic plug 5 minutes after laser-induced injury further suggested that clots in FgaWT/WT and FgaWT/EK mice were composed of tightly packed platelet plugs with equivalent platelet densities in the intravascular and extravascular spaces and a ring of fibrin at the intersection with the vessel wall. In FgaEK/EK mice, both platelets and fibrinogen covered a larger area around the injury site, and the fibrinogen signal was diffuse (Figure 6D; supplemental Video 3). Fga−/− mice displayed a widespread platelet signal at the injury site with a substantial portion of the plug in the extravascular space. Quantification of platelets and fibrin(ogen) demonstrated an accumulation of both fibrino(gen) and platelets at the injury site of FgaWT/WT mice (Figure 6E-F) that peaked and then gradually reduced over time. In FgaWT/EK and FgaEK/EK mice, fibrin(ogen) accumulation was reduced compared with that in FgaWT/WT mice (Figure 6E). Interestingly, initial platelet accumulation in FgaEK/EK mice peaked at the same level and time as that of FgaWT/WT and FgaWT/EK mice but remained elevated throughout the observation period (Figure 6F).
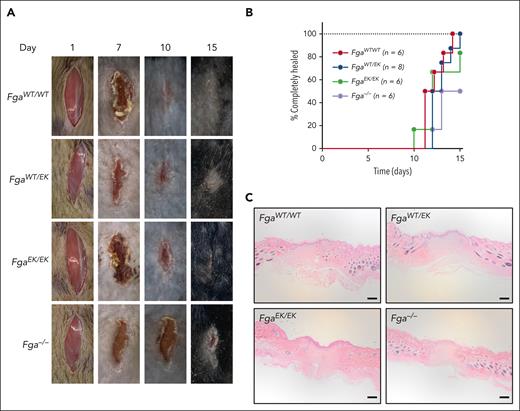
To determine the potential impact of nonpolymerizable fibrinogen on wound healing, a skin incision model was performed. No significant differences were observed among FgaWT/WT, FgaWT/EK, and FgaEK/EK mice in time to complete wound closure (Figure 7A-B). Although Fga−/− mice uniformly displayed a progressive reduction in the size of wound field over time, there was a significant delay in time to complete wound healing compared with that in FgaWT/WT and FgaWT/EK mice (Figure 7B). Histological evaluation of the wound fields at the end of the 15-day observation period revealed a similar appearance across all genotypes, as characterized by keratinocyte outgrowths that migrated into the wound fields and fusion of the outgrowths in mice that had completely healed (Figure 7C).
FgaWT/EK and FgaEK/EK mice have normal wound healing. (A) Representative images of wound fields and (B) plot of the percentage of mice healed after 1-cm surgical incision in FgaWT/WT (n = 6), FgaWT/EK (n = 8), FgaEK/EK (n = 6), and Fga−/− (n = 6) mice. Data were analyzed using Kaplan-Meier log-rank test with P < .05 for FgaWT/WT mice vs Fga−/− mice and for FgaWT/EK mice vs Fga−/− mice. (C) Representative images of hematoxylin and eosin–stained 5-μm-thick sagittal sections of wound sites of FgaWT/WT, FgaWT/EK, FgaEK/EK, and Fga−/− mice that healed 15 days after incision; scale bar, 200 μm.
FgaWT/EK and FgaEK/EK mice have normal wound healing. (A) Representative images of wound fields and (B) plot of the percentage of mice healed after 1-cm surgical incision in FgaWT/WT (n = 6), FgaWT/EK (n = 8), FgaEK/EK (n = 6), and Fga−/− (n = 6) mice. Data were analyzed using Kaplan-Meier log-rank test with P < .05 for FgaWT/WT mice vs Fga−/− mice and for FgaWT/EK mice vs Fga−/− mice. (C) Representative images of hematoxylin and eosin–stained 5-μm-thick sagittal sections of wound sites of FgaWT/WT, FgaWT/EK, FgaEK/EK, and Fga−/− mice that healed 15 days after incision; scale bar, 200 μm.
Discussion
Fibrin(ogen), denoted with parentheses when the specific form of the molecule is not definitively known, is a major protein component of occlusive thrombi. However, the precise requirement for each molecular form across distinct settings of thrombotic disease (eg, AT vs venous thrombosis) has been a fundamental question. Here, using FgaEK mice, which express fibrinogen that cannot be converted to fibrin by thrombin, allowed us to unambiguously interrogate specific roles of fibrinogen and fibrin in thrombus formation without simultaneously disrupting other elements of coagulation (eg, thrombin-mediated platelet activation).18 Moreover, we used this animal model system to reveal that the presence of a nonpolymerizable fibrinogen in the milieu with normal fibrinogen suppressed fibrin matrix formation and significantly reduced thrombosis.
The pathogenesis of AT is mediated by platelets, which serve as the primary driver of thrombus growth (ie, arterial thrombi are platelet rich).7 Consistent with that concept, we observed that, given an adequately severe injury, fibrinogen (ie, not fibrin) was sufficient for the formation of a stable occlusive carotid artery thrombus. Indeed, FgaEK/EK mice readily developed occlusive arterial thrombi after challenge with 10% FeCl3 for 3 minutes, but reducing either the FeCl3 concentration (ie, 4%-5%) or exposure time (1 vs 3 minutes) resulted in FgaEK/EK mice displaying protection from occlusive thrombosis. The protection in these animals was likely a result of small loosely packed thrombi becoming dislodged under high arterial shear rates. In support of this possibility, we detected a modestly increased incidence of embolization in FgaEK/EK mice with a 3-minute 5% FeCl3 challenge. At the lower intensity challenges (ie, 4% FeCl3 for 3 minutes or 8% FeCl3 for 1 minute), we postulate that even smaller aggregates rapidly dislodged from the injury site, a conclusion supported by our analyses directly visualizing carotid artery thrombus formation in real time (supplemental Video 1). Notably, relative to Fga+/− mice, FgaWT/EK mice were significantly protected from occlusive arterial thrombi formation at the lowest FeCl3 concentration (4%) analyzed, suggesting that the addition of nonpolymerizable fibrinogen in the milieu with FibWT can provide some degree of protection against occlusive AT.
Mice with complete fibrinogen deficiency (Fga−/−) did not form an occlusive thrombus, even under the most severe carotid artery injury conditions evaluated (ie, 10% FeCl3 for 3 minutes). These results are consistent with those of previous studies using a model of FeCl3 injury in mesenteric arteries. It was shown that platelets initially accumulate at the site of injury because of local deposition of plasma fibronectin, but the platelet aggregates consistently dissociate off the vessel wall.26 These observations indicated that fibrin(ogen) is required for stable thrombus formation in these small vessels. Similar trends are observed in humans, with the frequency of AT in patients with hypofibrinogenemia and afibrinogenemia being extremely low.31 The contribution of fibrinogen in driving AT is, at least in part, linked to fibrinogen-mediated platelet aggregation, which we document is preserved in FgaWT/EK and FgaEK/EK mice. Our findings indicate that other plasma proteins (eg, fibronectin) do not compensate for the absence of fibrin(ogen) in arterial thrombotic settings.
In contrast to AT, the pathogenesis of venous thrombosis is inherently tied to fibrin matrix formation. Studies have suggested that the configuration of the fibrin matrix itself is a major determinant of clot formation, stability, and, ultimately, venous thrombosis.8,12,13,32 High thrombin and fibrinogen concentrations result in the formation of thin fibrin fibers in a highly dense matrix that promotes RBC retention and suppresses platelet/fibrin-mediated clot contraction, leading to delayed clearance.12,32,33 Previous studies revealed that FXIIIa crosslinks fibrin α-chains13 to establish this dense matrix composed of more elastic fibrin fibers that promote RBC retention and subsequently larger thrombi.12 Our experiments indicated that FXIII was activated by thrombin in an equivalent manner among FgaWT/WT, FgaWT/EK, and FgaEK/EK plasma, consistent with FXIII exacerbating venous thrombosis through fibrin-dependent mechanisms. Collectively, our studies support and extend these previous works to highlight that fibrin polymerization is required for the formation of large venous thrombi, particularly under IVC stasis conditions.
The impact of nonpolymerizable fibrinogen on hemostatic function was also analyzed. Notably, hemostasis in FgaEK/EK mice is not perfect. Previous work showed that pregnant FgaEK/EK dams uniformly die midgestation because of fatal hemorrhage, similar to Fga−/− mice.18 Nevertheless, monomeric fibrinogen confers significant hemostatic potential not observed with complete fibrinogen deficiency. Bleeding time periods for FgaEK/EK mice were identical to that of FgaWT/WT mice in the saphenous vein injury model and were only modestly prolonged after tail transection. In contrast, Fga−/− mice do not stop bleeding after tail transection. Thus, monomeric fibrinogen significantly contributes to hemostasis, but its requirement is dependent on the specific vessel injured, the severity of injury, or both. These studies build on clinical observations. Patients with afibrinogenemia are at elevated risk of spontaneous bleeding,34 whereas patients with hypofibrinogenemia are often asymptomatic and undiagnosed until undergoing a significant challenge such as major trauma or surgery.31 Similarly, preserved hemostasis is observed in Fga270 mice, which express 10% of fibrinogen with αC-region truncation, and in mice with WT fibrinogen reduced to ∼10% after bleeding assays.14 Therefore, even low levels of fibrin(ogen) offer significant hemostatic benefit over complete fibrinogen deficiency.
Preservation of platelet function appears to be a major mechanism of the hemostatic activity displayed by FgaEK mice. Notably, FgaEK/EK and FgaWT/EK mice have normal platelet counts18 as well as intraplatelet fibrinogen and fibronectin content. Profiles of FgaEK/EK and FgaWT/EK platelet aggregation were identical to that of FgaWT/WT mice with agonist stimulation. After saphenous vein injury, initial platelet accumulation at the site of injury was similar across genotypes. The platelet signal for both FgaWT/WT and FgaWT/EK animals decreased after reaching the peak, but the signal for FgaEK/EK mice persisted over time. Fga−/− mice displayed diffuse and broad platelet accumulation at the site of injury, with a substantial fraction of the platelet mass accumulating in the extravascular space adjacent to the vessel injury. We postulate that the basis for the differences in platelet accumulation is linked to clot contraction that occurs in the FgaWT/WT and FgaWT/EK mice but is absent in FgaEK/EK and Fga−/− mice. Studies have shown that the mass and density of fibrin networks can affect clot contraction.35 However, it has not been possible to address whether a hemostatic plug undergoes contraction when formed in an environment in which thrombin and platelets are unperturbed and only fibrinogen (ie, not fibrin) contributes to the plug. Using the FgaEK model, analyses of the roles of fibrinogen and fibrin in supporting platelet-driven mechanical forces may be performed. Collectively, these findings suggest that fibrinogen contributes substantially to the formation of a functional hemostatic plug but that fibrin formation is required for the maturation of the plug.
An ideal antithrombotic therapy is one that prevents thrombosis without markedly increasing bleeding risk. Current anticoagulants, such as warfarin, heparin, rivaroxaban, and dabigatran, ultimately limit thrombin activity but increase bleeding risk because thrombin activates multiple pathways.36,37 Our data suggest that a customized nonpolymerizable fibrinogen variant in a milieu with normal fibrinogen (ie, as in the case of FgaWT/EK mice) can suppress thrombus formation without directly impeding thrombin-mediated activation of platelets, protease-activated receptors, FXIII, protein C, or thrombin-activatable fibrinolysis inhibitor. The FgaEK variant has altered amino acid residues that render the FpA sequence insensitive to thrombin but leaving the γ-chain binding pocket available to integrate into growing fibrils. Thus, this variant can act as a “fibrin(ogen) lock” by limiting fibrin formation through “capping” and terminating extension of a growing fibril in much the same way as a dideoxynucleotide terminates DNA polymerization.38 Intriguingly, our findings suggest that incorporating nonpolymerizable fibrinogen into a milieu with polymerizable fibrinogen also stabilizes the clot by rendering it less sensitive to lysis (Figure 4E-I). Moreover, FgaWT/EK in vitro clots had increased branch points with increased fibril termini further suggesting that nonpolymerizable fibrinogen may interact with the growing fibrin fiber to act as a fibrin polymer terminating agent. The truncated fibers and decreased density may contribute to increased extrusion of RBCs from the clot leading to smaller thrombi in FgaWT/EK mice than those in FgaWT/WT mice. Such a mechanism could have important implications for simultaneously suppressing thrombus formation and limiting embolization, but formal studies of pulmonary embolism remain to be performed.
In conclusion, our study reveals differential suppression of AT and venous thrombosis with marked preservation of hemostatic potential in mice expressing a nonpolymerizable fibrinogen variant. Our results from the FgaEK mouse model may also have important clinical relevance to patients with fibrinogen Hershey III (FGAR16C), whose FpA cannot be cleaved by thrombin.39 Moreover, our results suggest that selective prevention of fibrin matrix formation may be a therapeutic strategy against thrombosis without a significant increase in bleeding risk. Such a strategy could be particularly powerful in pathological conditions in which venous thrombosis is a significant comorbidity (eg, cancer, obesity, and inflammatory diseases). Furthermore, a nonpolymerizable fibrinogen may have combined beneficial effects with antiplatelet therapies for conditions in which AT is a significant risk factor (eg, obesity and metabolic syndrome).40,41 Future studies will focus on using nonpolymerizable fibrinogen in disease settings associated with exacerbated thrombosis.
Acknowledgments
The authors thank Sara Abrahams and Alyssa Dandridge for their technical assistance.
This work was supported by the Canadian Institutes of Health Research (MFE181897) (W.S.H.), WFU Translational Science Center (ID0576 U04634) (M.G.), National Institutes of Health grants R01DK112778 (M.J.F.), R01CA211098 (M.J.F.), R01HL160046 (M.J.F. and A.S.W.), R35HL144976 (W.B.), R01HL126974 (A.S.W.), and R35HL144976 (N.M.).
The content is solely the responsibility of the authors and does not necessarily represent the official views of the National Institutes of Health.
Authorship
Contribution: W.S.H., T.K., J.M.N.M., D.S.P., R.H.L., E.G.C., E.G.B., A.D., C.C., S.R.B., and M.J.F. designed the research, performed experiments, and analyzed the data; W.S.H. and M.J.F. wrote the manuscript; M.G., A.S.W., N.M., P.M., and W.B. provided critical guidance on experimental procedures, and helped in writing the manuscript; and all authors read and approved the final manuscript.
Conflict-of-interest disclosure: The authors declare no competing financial interests.
Correspondence: Matthew J. Flick, Department of Pathology and Laboratory Medicine University of North Carolina at Chapel Hill, 8018B Mary Ellen Jones Bldg, 116 Manning Dr, CB 7035, Chapel Hill, NC 27599-7035; email: matthew_flick@med.unc.edu.
References
Author notes
Data are available on request from the corresponding author, Matthew J. Flick (matthew_flick@med.unc.edu).
The online version of this article contains a data supplement.
There is a Blood Commentary on this article in this issue.
The publication costs of this article were defrayed in part by page charge payment. Therefore, and solely to indicate this fact, this article is hereby marked “advertisement” in accordance with 18 USC section 1734.

![FgaWT/EK clots have comparable mechanical strength and are resistant to lysis that is not accounted for by differences in clot contraction or FXIII activation. (A) Mean thromboelastography (TEG) curve tracings of whole blood activated with tissue factor and calcium. (B) Maximum amplitude (MA), (C) α angle (degree [deg]), and (D) clot initiation time (R) of whole blood isolated from FgaWT/WT, FgaWT/EK, FgaEK/EK, Fga+/−, and Fga−/− mice. (E) Mean TEG curve tracings of whole blood activated with tissue factor and calcium in the presence of 1.5 μg/mL of tPA. (F) MA, (G) α angle, (H) R time, and (I) percentage of lysis 30 minutes after reaching MA (LY30) of whole blood isolated from FgaWT/WT, FgaWT/EK, and Fga+/− mice. (J) Clot mass after clot retraction. (K) Representative western blots and (L) quantification (n = 3 per genotype) of FXIIIa during time course of thrombin-initiated clotting in FgaWT/WT, FgaWT/EK, and FgaEK/EK plasma. (M) Representative scanning electron microscopy images of clots made with platelet-poor plasma of FgaWT/WT and FgaWT/EK mice. Arrows indicate fiber termini. (N) Diameters of fibrin fibers of FgaWT/WT and FgaWT/EK clots. Large dots indicate biological replicates and small dots indicate total fibers analyzed from all samples. (O) Quantification of the number of fiber terminal ends per fiber in clots made from FgaWT/WT and FgaWT/EK mice. Data are presented as the mean ± SEM and analyzed using one-way ANOVA. ∗P < .05; ∗∗P < .01; ∗∗∗P < .001.](https://ash.silverchair-cdn.com/ash/content_public/journal/blood/143/2/10.1182_blood.2023020805/2/m_blood_bld-2023-020805-gr4.jpeg?Expires=1767699752&Signature=zZB0hXs5FmqVPc~MrbxKxuH2TngeN5bvMxxjBa0drktrOTaQfqcWIcyKkk3fuppmK~-DMiu0hQuMeLWrLtLKmlzY9dP2hR7ETJmBnxyrn~e411uiMvH2Zl7lu0nsaTZBajiwvvzkfaaw7-wcjkNa3srGTrtVEpMy7-aFx6BNOtB2es1ReTzyqt9w~6-thiSX3qnDlmRR24MjjvrZacayyMV1hmRlV4ywqGf8eJSFUAhzNdK5Xk7e2fDyXx5yjjCtmjORo-dvzztF8nkREBo8ax~6OhleAA5Ixl6IJ9s9BD4VxBmrx081NNSAhfVZw0JnR~btdeT6RRLH-dFUtWWnUw__&Key-Pair-Id=APKAIE5G5CRDK6RD3PGA)
This feature is available to Subscribers Only
Sign In or Create an Account Close Modal