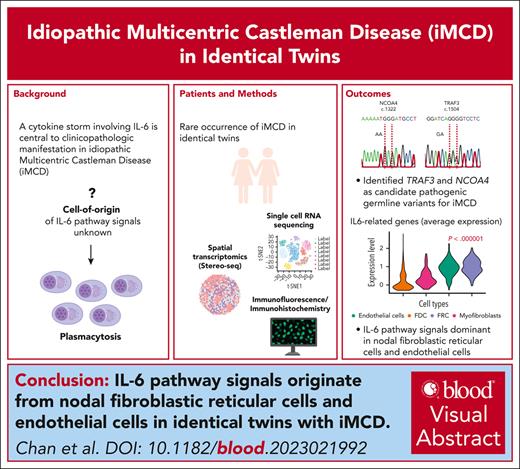
Candidate pathogenic germ line variants in TRAF3 and NCOA4 were identified for iMCD occurring in identical twins.
Using scRNAseq and Stereo-seq, IL-6 pathway signals were dominant in nodal fibroblastic reticular cells and endothelial cells.
Visual Abstract
Idiopathic multicentric Castleman disease (iMCD) is a rare cytokine-driven disorder characterized by systemic inflammation, generalized lymphadenopathy, and organ dysfunction. Here, we present an unusual occurrence of iMCD in identical twins and examined the immune milieu within the affected lymphoid organs and the host circulation using multiomic high-dimensional profiling. Using spatial enhanced resolution omics sequencing (Stereo-seq) transcriptomic profiling, we performed unsupervised spatially constrained clustering to identify different anatomic structures, mapping the follicles and interfollicular regions. After a cell segmentation approach, interleukin 6 (IL-6) pathway genes significantly colocalized with endothelial cells and fibroblastic reticular cells, confirming observations using a single-cell sequencing approach (10× Chromium). Furthermore, single-cell sequencing of peripheral blood mononuclear cells revealed an “inflammatory” peripheral monocytosis enriched for the expression of S100A family genes in both twins. In summary, we provided evidence of the putative cell-of-origin of IL-6 signals in iMCD and described a distinct monocytic host immune response phenotype through a unique identical twin model.
Introduction
Castleman disease is a heterogeneous group of lymphoproliferative disorders classified into unicentric and multicentric (MCD) forms. Elevated immunoglobulin levels and prominent plasmacytosis in the bone marrow and lymph nodes are frequently present (idiopathic plasmacytic lymphadenopathy type), whereas others present as a more homogenous TAFRO (thrombocytopenia, anasarca, fever, reticulin fibrosis, and organomegaly) syndrome.1 Etiologically, MCD is associated with the Kaposi sarcoma herpesvirus in the setting of immunodeficiency or a viral-negative idiopathic form (iMCD).2 Importantly, a cytokine storm involving interleukin 6 (IL-6) is central to clinicopathologic manifestation in some cases of iMCD and established anti–IL-6 agents as firstline therapy.3-5
Genomic alterations at the IL-6/IL-6R loci, oncogenic signaling pathways, epigenetic regulators, and inflammation-related genes have been implicated in iMCD.6-13 However, the cell-of-origin and mechanisms of IL-6 overproduction in iMCD remain elusive, the genetic determinants of disease susceptibility are poorly understood, and the immune milieu within affected lymphoid organs and in circulation have not been deeply studied. Here, we describe the unusual occurrence of iMCD in identical twins, which provided a unique model to study iMCD by genomic characterization and high-dimensional profiling at single-cell resolution.
Study design
Clinical and genomic data curation
Retrospective review of clinical data was performed and the diagnosis of iMCD was based on the Castleman Disease Collaborative Network consensus diagnostic criteria.14 Assessment of various tissue or plasma markers are detailed in the supplemental Data, available on the Blood website. Whole-genome sequencing was performed on genomic DNA isolated from affected lymph nodes and buccal swabs from the study participants.
Written consent for the use of biospecimens and clinical data were obtained in accordance with the Declaration of Helsinki. Tissue collection and consent protocols were performed as part of the Singapore Lymphoma Study and were under approval from the SingHealth Centralized Institution Review Board.
Single-cell sequencing and spatial transcriptomics
Single-cell RNA-sequencing libraries were prepared from tissue samples from Twin-CS (lymph node and bone marrow), as well as from peripheral blood mononuclear cells (PBMCs) from the affected twins and unaffected sister. Spatial enhanced resolution omics sequencing was applied to spatially resolve the transcriptome of the lymph node from Twin-CS. Refer to supplemental Methods for details.
Results and discussion
Clinical course of identical twins with iMCD
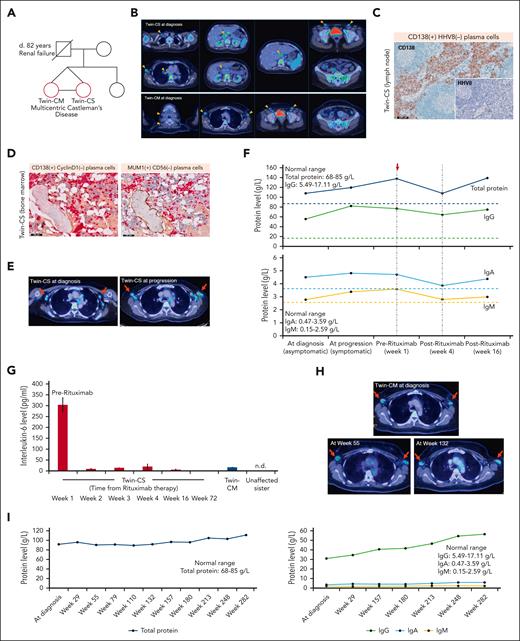
The index patients were identical twins aged 42 years (Figure 1A). Twin-CM had incidentally discovered enlarged axillary lymph nodes from screening mammography, whereas Twin-CS had discovered anemia from routine health screening. An [18F]fluorodeoxyglucose positron emission tomography/computed tomography (18-FDG PET/CT) scan revealed hypermetabolic lymph nodes in multiple stations and diffuse bone marrow involvement (Figure 1B). Twin-CS was on active surveillance until progression of nodal disease 42 months later, accompanied by increased serum total protein and immunoglobulin levels. Bone marrow biopsy demonstrated mature CD138+/cyclin D1− and MUM1+/CD56− plasma cells. Lymph node biopsy from Twin-CS at progression demonstrated medullary and interfollicular CD138+/HHV8− plasma cells, polytypic for kappa and lambda light chains (Figure 1C-F; supplemental Figure 1A-G), as was observed in the lymph node from Twin-CM (supplemental Figure 1H-M).
Disease characteristics of affected twins with iMCD. (A) Pedigree chart of affected twins with iMCD (red circles). (B) Representative 18-FDG PET/CT images in the affected twins. Twin-CS: enlarged, hypermetabolic lymph nodes in the neck, axilla, chest, abdomen and pelvis, as well as diffuse increased FDG uptake in the bone marrow and spleen. Twin-CM: enlarged, hypermetabolic lymph nodes in the neck, axilla, and pelvis, as well as diffuse increased FDG uptake in the bone marrow. Orange arrows: enlarged lymph nodes (short axis diameter ≥1 cm). Asterisk: bone marrow involvement. (C) Medullary and interfollicular CD138+/HHV8− plasma cells in the lymph node from Twin-CS (scale bar, 500 μm). (D) Dual immunohistochemistry for CD138 (red)-cyclin D1 (brown) and MUM1 (red)-CD56 (brown) showing that mature plasma cells in the bone marrow are CD138+/cyclin D1− and MUM1+/CD56−. Physiological expression of cyclin D1 can be observed in scattered histiocytic nuclei and expression of CD56 is seen in osteoblastic rims surrounding a bony trabeculae (scale bar, 100 μm). (E) 18-FDG PET/CT showing hypermetabolic enlargement and metabolic progression of axillary nodal disease (red arrows, axillary nodes) 42 months from diagnosis for Twin-CS (SUVmax, 3.9-5.4; short axis diameter, 1.5-1.7 cm). (F) Increasing serum total protein levels along with disease progression. A transient decline in immunoglobulin levels was observed after 4 doses of rituximab therapy. Dotted lines represent upper limit of normal ranges of protein levels. Red arrow indicates start of rituximab therapy. (G) Rapid and sustained decline of IL-6 levels after rituximab treatment in Twin-CS (week 1, 303.3 pg/mL; week 2, 10.2 pg/mL; week 16, 6.7 pg/mL; week 72, 0.7 pg/mL). As comparison, IL-6 level of affected but asymptomatic Twin-CM was 16.9 pg/mL and was not detectable (n.d.) in the unaffected sister. Results are represented by mean values and standard deviations (error bars). Panels B and C are illustrated again in supplemental Figure 1. (H) 18-FDG PET/CT showed hypermetabolic bilateral axillary lymph nodes demonstrating interval stability (red arrows) for Twin-CM. (I) Trend of serum total protein, IgG, IgA, and IgM levels from diagnosis and follow-up for Twin-CM. IgG, immunoglobulin G; SUVmax, maximum standardized uptake value.
Disease characteristics of affected twins with iMCD. (A) Pedigree chart of affected twins with iMCD (red circles). (B) Representative 18-FDG PET/CT images in the affected twins. Twin-CS: enlarged, hypermetabolic lymph nodes in the neck, axilla, chest, abdomen and pelvis, as well as diffuse increased FDG uptake in the bone marrow and spleen. Twin-CM: enlarged, hypermetabolic lymph nodes in the neck, axilla, and pelvis, as well as diffuse increased FDG uptake in the bone marrow. Orange arrows: enlarged lymph nodes (short axis diameter ≥1 cm). Asterisk: bone marrow involvement. (C) Medullary and interfollicular CD138+/HHV8− plasma cells in the lymph node from Twin-CS (scale bar, 500 μm). (D) Dual immunohistochemistry for CD138 (red)-cyclin D1 (brown) and MUM1 (red)-CD56 (brown) showing that mature plasma cells in the bone marrow are CD138+/cyclin D1− and MUM1+/CD56−. Physiological expression of cyclin D1 can be observed in scattered histiocytic nuclei and expression of CD56 is seen in osteoblastic rims surrounding a bony trabeculae (scale bar, 100 μm). (E) 18-FDG PET/CT showing hypermetabolic enlargement and metabolic progression of axillary nodal disease (red arrows, axillary nodes) 42 months from diagnosis for Twin-CS (SUVmax, 3.9-5.4; short axis diameter, 1.5-1.7 cm). (F) Increasing serum total protein levels along with disease progression. A transient decline in immunoglobulin levels was observed after 4 doses of rituximab therapy. Dotted lines represent upper limit of normal ranges of protein levels. Red arrow indicates start of rituximab therapy. (G) Rapid and sustained decline of IL-6 levels after rituximab treatment in Twin-CS (week 1, 303.3 pg/mL; week 2, 10.2 pg/mL; week 16, 6.7 pg/mL; week 72, 0.7 pg/mL). As comparison, IL-6 level of affected but asymptomatic Twin-CM was 16.9 pg/mL and was not detectable (n.d.) in the unaffected sister. Results are represented by mean values and standard deviations (error bars). Panels B and C are illustrated again in supplemental Figure 1. (H) 18-FDG PET/CT showed hypermetabolic bilateral axillary lymph nodes demonstrating interval stability (red arrows) for Twin-CM. (I) Trend of serum total protein, IgG, IgA, and IgM levels from diagnosis and follow-up for Twin-CM. IgG, immunoglobulin G; SUVmax, maximum standardized uptake value.
iMCD of idiopathic plasmacytic lymphadenopathy type was established after excluding infections, malignancies, and autoimmune disorders (supplemental Table 1).14 At progression, Twin-CS manifested daily low-grade fevers approaching 37.8°C, myalgia, and fainting spells, with raised erythrocyte sedimentation rate at >150 mm per hour. Because anti–IL-6 agents were inaccessible at that time, IV rituximab (375 mg/m2) was given once weekly for 4 doses, with prompt symptom resolution. A rapid and sustained decline of plasma IL-6 levels was observed (week 1, 303.3 pg/mL; week 2, 10.2 pg/mL; week 16, 6.7 pg/mL; week 72, 0.7 pg/mL). Erythrocyte sedimentation rate levels reduced to 119 mm per hour by week 16. Comparatively, IL-6 level of asymptomatic Twin-CM was 16.9 pg/mL and was undetectable in her unaffected sister (Figure 1F-G). Twin-CM’s clinical course was relatively indolent not necessitating treatment and remained on active surveillance (Figure 1H-I).
NCOA4 and TRAF3 as candidate pathogenic germ line variants
Germ line homozygous NCOA4 c.G1322A (NM_005437:exon8) and monoallelic TRAF3 c.G1504A (NM_003300:exon11) variants were identified in the twins (supplemental Figure 2A). Their unaffected sister and paternal uncle were heterozygous for NCOA4 c.G1322A and homozygous wildtype for TRAF3 c.G1504A. The altered NCOA4 locus has a minor allele frequency of 0.01920 (East Asian, Gnomad database v2.1.1; allele count 383 of 19 952), with only 2 homozygotes described. The altered TRAF3 locus has not been described. The nonsynonymous substitution at NCOA4 c.G1322A results in an amino acid alteration from glycine to glutamic acid (p.G441E), whereas TRAF3 c.G1504A results in a change from glycine to arginine (p.G502R). Both are predicted deleterious in silico. Candidate germ line and somatic variants are summarized in supplemental Table 2. NCOA4, a coactivator of several nuclear receptors, was recently suggested to be somatically mutated in 23% (5 of 22 cases) of iMCD and speculated to be involved in its pathogenesis through the MAP kinase pathway and IL-6 activation.10 TRAF3 is an adaptor protein that inhibits plasma cell development by blocking IL-6 signaling, and both germ line and somatic variants have been implicated in B-cell malignancies and immune deregulation syndromes.15 TRAF3 deficiency in mice has been shown to enhance IL-6 responsiveness in B cells and plasma cell expansion.16 Taken together, we hypothesize that altered NCOA4 and TRAF3 functions may have played a role in the development of iMCD in the twins, and further studies will be required for validation. The differing clinical course of the twins further implicates an environmental influence in addition to genetic predisposition.
IL-6 pathway signals dominant in nodal endothelial and fibroblastic reticular cells (FRCs)
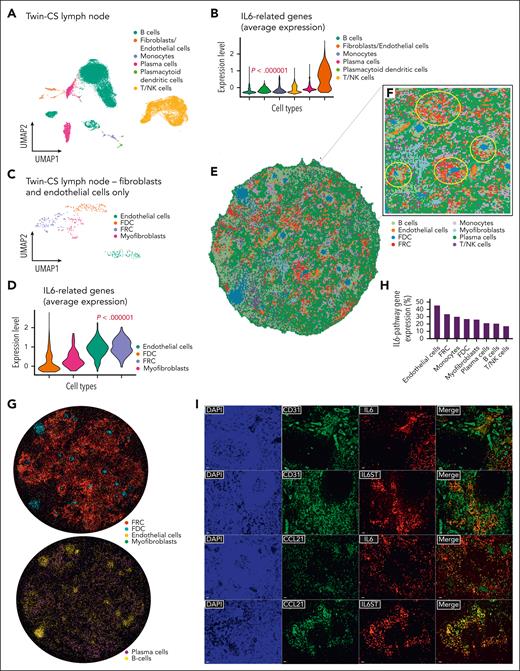
Transcriptomic profiles of 94 947 cells from bone marrow, lymph node, and PBMCs were grouped into distinct clusters (supplemental Figure 3A; supplemental Table 3). We specifically examined the expression of genes previously implicated in unicentric Castleman disease and MCD (supplemental Figure 3B-C), as well as NCOA4 and TRAF3 (supplemental Figure 2D-I).15 IL-6 pathway genes (IL6, IL6ST, OSMR, and LIFR) were dominant in the lymph node. Distinct cell types were present in the lymph node, including plasma cells, B cells, T/natural killer cells, and others (Figure 2A; supplemental Figure 3D). TRAF3 and NCOA4 were expressed mainly in the lymph node and PBMCs, respectively (supplemental Figure 2D-I; supplemental Table 4). The expression of IL-6 pathway genes was strongest in the nodal endothelial cells and fibroblasts (Figure 2B; supplemental Figure 3E), with the latter comprising T-cell zone FRCs (CCL19+/CCL21+/IL7+/PDPN+), follicular dendritic cells (CD21+/CD35+), and myofibroblasts (ACTA2+/PDGFRB+/TGFB1+) (Figure 2C; supplemental Figure 3F). IL-6 pathway genes were largely expressed in nodal endothelial cells and FRCs (Figure 2D; supplemental Figure 3F). Using spatial enhanced resolution omics sequencing, we retrieved transcriptomic information for 33 303 bins (bin-50, 37.5 μm diameter), with an average of 474 captured genes per bin. We performed unsupervised spatially constrained clustering to identify different anatomic structures, mapping the follicles and interfollicular regions. After a cell segmentation approach, after filtering out low-capture cells, we obtained 96 725 segmented cells (bin-20, 15 μm diameter), with an average of 55 captured genes per cell. Cell-type specific markers similarly annotated them to their expected spatial regions. Confirming the observations from single-cell profiling, IL-6 pathway genes significantly colocalized with endothelial cells and FRCs over other cell types (Figure 2E-2H). Immunofluorescence/immunohistochemistry staining of nodal tissue confirmed IL-6 and IL-6ST coexpression with both endothelial cells (CD31+) and FRCs (CCL21+) (Figure 2I; supplemental Figures 4 and 5).17
Single-cell transcriptomic sequencing identifies nodal endothelial and FRCs expressing IL-6–related genes. (A) UMAP plot of 25 445 cells from the affected lymph node of Twin-CS demonstrating distinct clusters by cell types, with a majority of B cells, followed by T/NK cells, plasma cells, and others. (B) Violin plot showing the average expression of IL-6 pathway genes (IL6, IL6ST, OSMR, and LIFR) was strongest in the nodal endothelial cells and fibroblasts (2-tailed P < .000001; Kruskal-Wallis test). (C) UMAP plot of 406 cells identified as fibroblasts and endothelial cells from the affected lymph node of Twin-CS showing 4 distinct clusters, with the fibroblast compartment further segregated into FRCs, follicular dendritic cells (FDCs), and myofibroblasts. (D) Violin plot showing the average expression of IL-6 pathway genes were most prominent in FRCs and endothelial cells (2-tailed P < .000001; Kruskal-Wallis test). (E) Cell-type annotation on the spatial enhanced resolution omics sequencing (Stereo-seq) bin50 data encompassing the same cell types identified on single-cell RNA-sequencing (scRNAseq) analysis of affected lymph node of Twin-CS. (F) Enlarged region showing enrichment of endothelial cells corresponding to vascular structures (circled in cyan), whereas follicle structures (circled in yellow) were enriched in B cells and FDCs, and surrounded by FRCs, endothelial cells, and other cell types. (G) After a cell segmentation approach (bin 20, 15 μm diameter), cell-type specific markers similarly annotated them to their expected regions on the spatial map. (H) The proportion of cells expressing IL-6–pathway genes (IL6, IL6ST, OSMR, and LIFR) above the threshold (Q3, third quartile) within each cell type as annotated on bin50 data as shown in panel E. (I) Lymph node tissue of Twin-CS demonstrated IL-6 and IL-6ST coexpression with endothelial cells (CD31+) and FRCs (CCL21+) on double immunofluorescence (scale bars, 20 μm). NK cell, natural killer cell; UMAP, uniform manifold approximation and projection.
Single-cell transcriptomic sequencing identifies nodal endothelial and FRCs expressing IL-6–related genes. (A) UMAP plot of 25 445 cells from the affected lymph node of Twin-CS demonstrating distinct clusters by cell types, with a majority of B cells, followed by T/NK cells, plasma cells, and others. (B) Violin plot showing the average expression of IL-6 pathway genes (IL6, IL6ST, OSMR, and LIFR) was strongest in the nodal endothelial cells and fibroblasts (2-tailed P < .000001; Kruskal-Wallis test). (C) UMAP plot of 406 cells identified as fibroblasts and endothelial cells from the affected lymph node of Twin-CS showing 4 distinct clusters, with the fibroblast compartment further segregated into FRCs, follicular dendritic cells (FDCs), and myofibroblasts. (D) Violin plot showing the average expression of IL-6 pathway genes were most prominent in FRCs and endothelial cells (2-tailed P < .000001; Kruskal-Wallis test). (E) Cell-type annotation on the spatial enhanced resolution omics sequencing (Stereo-seq) bin50 data encompassing the same cell types identified on single-cell RNA-sequencing (scRNAseq) analysis of affected lymph node of Twin-CS. (F) Enlarged region showing enrichment of endothelial cells corresponding to vascular structures (circled in cyan), whereas follicle structures (circled in yellow) were enriched in B cells and FDCs, and surrounded by FRCs, endothelial cells, and other cell types. (G) After a cell segmentation approach (bin 20, 15 μm diameter), cell-type specific markers similarly annotated them to their expected regions on the spatial map. (H) The proportion of cells expressing IL-6–pathway genes (IL6, IL6ST, OSMR, and LIFR) above the threshold (Q3, third quartile) within each cell type as annotated on bin50 data as shown in panel E. (I) Lymph node tissue of Twin-CS demonstrated IL-6 and IL-6ST coexpression with endothelial cells (CD31+) and FRCs (CCL21+) on double immunofluorescence (scale bars, 20 μm). NK cell, natural killer cell; UMAP, uniform manifold approximation and projection.
Heterogeneous monocyte subpopulations in peripheral blood
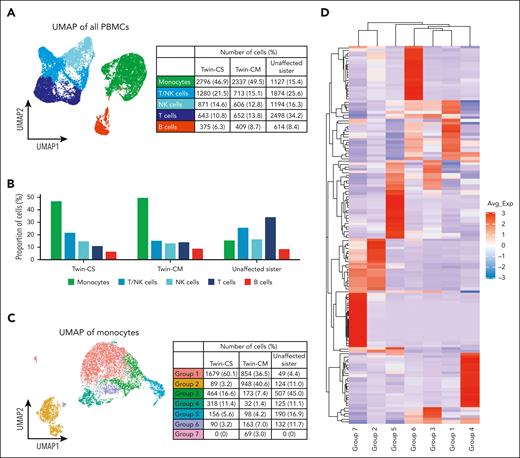
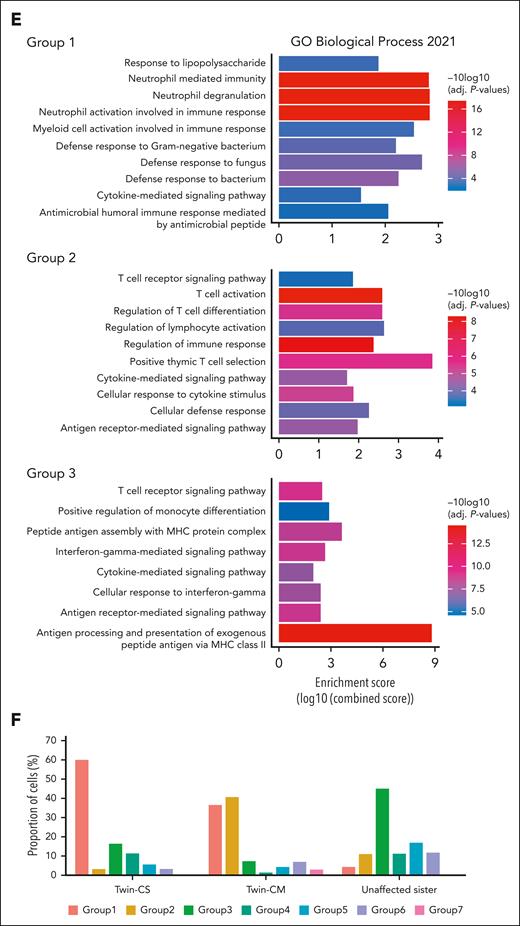
We investigated PBMC profiles in all 3 sisters. Interestingly, the uniform manifold approximation and projection (UMAP) of PBMCs displayed heterogeneity within the monocyte population, which formed the largest proportion of cells within the PBMCs of the twins, in contrast to their sister (Figure 3A-B). Previously, the ratio of circulating classical (CD14+CD16−) to nonclassical (CD14−CD16+) monocytes was suggested to be higher in iMCD-TAFRO than with healthy individuals,18 prompting us to explore potential monocyte subsets relevant to our patients. Further analysis of monocytes revealed 7 subpopulations defined by different gene expression profiles (Figure 3C). Group 1 monocytes were enriched for the expression of S100A family genes (eg, S100A8, S100A12, S100A9, and S100A6), which have been implicated in inflammatory response signaling and immunological processes.19 Group 2 monocytes expressed a cytotoxic gene signature including PRF1, GNLY, CTSW, GZMA, and GZMH. Group 3 monocytes were enriched for expression of major histocompatibility complex class II genes (eg, HLA-DRA, HLA-DPB1, HLA-DRB1, HLA-DPA1, CD74, HLA-DMA, HLA-DQB1, and HLA-DQA1). The “inflammatory” subtype resembles the previously described Mono1 classical monocyte, whereas the “cytotoxic” subtype resembles the Mono4 intermediate monocyte.20 Minor subgroups include FCGR2B-expressing monocytes (group 4), FCGR3B-expressing nonclassical monocytes (group 5), and others (groups 6 and 7). Gene ontology pathway analysis demonstrated enrichment of neutrophil degranulation and activation pathways in group 1 monocytes. Group 2 harbored signatures of T-cell activation and cytokine signaling. Group 3 was enriched for signatures of antigen processing (Figure 3D-E; supplemental Tables 5 and 6). Group 1 monocytes were enriched in Twin-CS, whereas Twin-CM carried a higher proportion of groups 1 and 2 monocytes. Group 3 monocytes were dominant in the unaffected sister (Figure 3F).
Distinct monocyte subpopulations dominate peripheral blood in iMCD-affected and -unaffected sisters. (A) UMAP of the PBMCs from all 3 sisters (Twin-CS and Twin-CM at asymptomatic “baseline” state), showing heterogeneity within monocytes and other cell types. (B) The monocyte population formed the largest proportion of cell type within the PBMCs of affected twins, in contrast to their unaffected sister. (C) Further analysis of monocytes showed different subpopulations enriched within both affected twins (group 1) and their unaffected sister (group 3). The asymptomatic affected Twin-CM carried a relatively higher proportion of group 2 monocytes. (D) Group 1 monocytes were enriched for the expression of acute and chronic inflammatory genes including several S100A family genes (eg, S100A8, S100A12, S100A9, and S100A6). Group 2 monocytes expressed a cytotoxic gene signature including PRF1, GNLY, CTSW, GZMA, and GZMH. Group 3 monocytes enriched for expression of major histocompatibility complex (MHC) class II genes (eg, HLA-DRA, HLA-DPB1, HLA-DRB1, HLA-DPA1, CD74, HLA-DMA, HLA-DQB1, and HLA-DQA1). Minor subgroups identified include FCGR2B-expressing monocytes (group 4), FCGR3B-expressing nonclassical monocytes (group 5), and others (groups 6 and 7). (E) Gene ontology (GO) pathway analysis demonstrated enrichment of neutrophil degranulation and activation pathways in group 1 monocytes. Group 2 monocytes harbored signatures of T-cell activation and cytokine signaling. Group 3 monocytes were enriched for signatures of antigen processing. (F) Both the affected twins, particularly in Twin-CS, were predominantly carrying group 1 monocytes enriched for the expression of acute and chronic inflammatory gene signatures. Twin-CM carried a higher proportion of group 2 monocytes harboring signatures of cytotoxic T-cell activation. PBMCs from the twins were obtained at their asymptomatic “baseline” state (for Twin-CS, after rituximab therapy). In the unaffected sister, group 3 monocytes enriched for signatures of antigen processing were dominant.
Distinct monocyte subpopulations dominate peripheral blood in iMCD-affected and -unaffected sisters. (A) UMAP of the PBMCs from all 3 sisters (Twin-CS and Twin-CM at asymptomatic “baseline” state), showing heterogeneity within monocytes and other cell types. (B) The monocyte population formed the largest proportion of cell type within the PBMCs of affected twins, in contrast to their unaffected sister. (C) Further analysis of monocytes showed different subpopulations enriched within both affected twins (group 1) and their unaffected sister (group 3). The asymptomatic affected Twin-CM carried a relatively higher proportion of group 2 monocytes. (D) Group 1 monocytes were enriched for the expression of acute and chronic inflammatory genes including several S100A family genes (eg, S100A8, S100A12, S100A9, and S100A6). Group 2 monocytes expressed a cytotoxic gene signature including PRF1, GNLY, CTSW, GZMA, and GZMH. Group 3 monocytes enriched for expression of major histocompatibility complex (MHC) class II genes (eg, HLA-DRA, HLA-DPB1, HLA-DRB1, HLA-DPA1, CD74, HLA-DMA, HLA-DQB1, and HLA-DQA1). Minor subgroups identified include FCGR2B-expressing monocytes (group 4), FCGR3B-expressing nonclassical monocytes (group 5), and others (groups 6 and 7). (E) Gene ontology (GO) pathway analysis demonstrated enrichment of neutrophil degranulation and activation pathways in group 1 monocytes. Group 2 monocytes harbored signatures of T-cell activation and cytokine signaling. Group 3 monocytes were enriched for signatures of antigen processing. (F) Both the affected twins, particularly in Twin-CS, were predominantly carrying group 1 monocytes enriched for the expression of acute and chronic inflammatory gene signatures. Twin-CM carried a higher proportion of group 2 monocytes harboring signatures of cytotoxic T-cell activation. PBMCs from the twins were obtained at their asymptomatic “baseline” state (for Twin-CS, after rituximab therapy). In the unaffected sister, group 3 monocytes enriched for signatures of antigen processing were dominant.
The temporal changes of PBMCs were charted for Twin-CS from time of disease flare to partial remission after rituximab. There was a decrease in T/natural killer cells and increase in monocytes by week 72 at the patient’s asymptomatic baseline state (supplemental Figures 6A-C). Over the time points, we observed changes in monocyte clusters corresponding to the major subgroups identified earlier (supplemental Figures 6D-F). Interestingly, group 4 and group 6 monocytes were dominant at week 1, whereas group 1 monocytes increased in proportion over time and were dominant over other monocyte subgroups at week 72 (Figure 6G).
In conclusion, we described a case of iMCD in identical twins. IL-6 pathway signals originate from nodal FRCs and endothelial cells, whereas a distinctive monocyte response in the peripheral blood may differentiate clinical phenotypes, providing the basis for detailed evaluation in future studies.
Acknowledgments
This work was supported by the Tanoto Foundation Professorship in Medical Oncology, New Century Foundation Limited, Ling Foundation, Singapore Ministry of Health’s National Medical Research Council Research Transition Award (TA21jun-0005), Large Collaborative Grant (OFLCG18May-0028), and TETRAD II Collaborative Centre Grant (CG21APR2002).
Authorship
Contribution: J.Y.C. and J.W.L. analyzed the data and prepared the first draft the manuscript; D.Y.B.S. and C.L.C. provided pathological assessment of tissues; J.C.H.H. provided clinical information and samples; J.W.L., J.Q.L., H.L., and Z.G. performed the statistical and bioinformatic analyses; E.C.Y.L., J.Y.L., B.K., B.Y.L., K.L., C.C.-Y.N., T.K.K., and D.H. processed tissue and performed experiments; S.H.C., J.N., B.T.T., and S.T.L. contributed to data interpretation; J.Y.C. and C.K.O. conceptualized the study, interpreted the results, had unrestricted access to all data, and revised the manuscript; and all authors agreed to submit the manuscript, read and approved the final draft, and take full responsibility for its content.
Conflict-of-interest disclosure: The authors declare no competing financial interests.
Correspondence: Choon Kiat Ong, Division of Cellular and Molecular Research, Lymphoma Genomic Translational Research Laboratory, National Cancer Centre Singapore, 30 Hospital Blvd, Singapore 168583; email: cmrock@nccs.com.sg; and Jason Yongsheng Chan, Division of Medical Oncology, National Cancer Centre Singapore, Singapore, 30 Hospital Blvd, Singapore 168583; email: jason.chan.y.s@nccs.com.sg.
References
Author notes
J.Y.C. and J.W.L. contributed equally.
The data sets supporting the conclusions of this article are available in the European Genome-Phenome Archive repository (EGAS00001007390). The data sets supporting the conclusions of this article are included within the article and its additional files.
The online version of this article contains a data supplement.
There is a Blood Commentary on this article in this issue.
The publication costs of this article were defrayed in part by page charge payment. Therefore, and solely to indicate this fact, this article is hereby marked “advertisement” in accordance with 18 USC section 1734.

This feature is available to Subscribers Only
Sign In or Create an Account Close Modal