Key Points
EGR1 is overexpressed and further upregulated upon ibrutinib treatment in ibrutinib-resistant activated B-cell–like DLBCL and MCL cells.
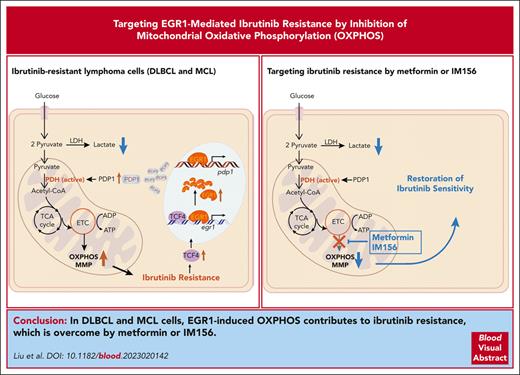
EGR1 mediates metabolic reprogramming to OXPHOS through PDP1 transcription, and targeting OXPHOS with IM156 overcomes ibrutinib resistance.
Abstract
The use of Bruton tyrosine kinase inhibitors, such as ibrutinib, to block B-cell receptor signaling has achieved a remarkable clinical response in several B-cell malignancies, including mantle cell lymphoma (MCL) and diffuse large B-cell lymphoma (DLBCL). Acquired drug resistance, however, is significant and affects the long-term survival of these patients. Here, we demonstrate that the transcription factor early growth response gene 1 (EGR1) is involved in ibrutinib resistance. We found that EGR1 expression is elevated in ibrutinib-resistant activated B-cell–like subtype DLBCL and MCL cells and can be further upregulated upon ibrutinib treatment. Genetic and pharmacological analyses revealed that overexpressed EGR1 mediates ibrutinib resistance. Mechanistically, TCF4 and EGR1 self-regulation induce EGR1 overexpression that mediates metabolic reprogramming to oxidative phosphorylation (OXPHOS) through the transcriptional activation of PDP1, a phosphatase that dephosphorylates and activates the E1 component of the large pyruvate dehydrogenase complex. Therefore, EGR1-mediated PDP1 activation increases intracellular adenosine triphosphate production, leading to sufficient energy to enhance the proliferation and survival of ibrutinib-resistant lymphoma cells. Finally, we demonstrate that targeting OXPHOS with metformin or IM156, a newly developed OXPHOS inhibitor, inhibits the growth of ibrutinib-resistant lymphoma cells both in vitro and in a patient-derived xenograft mouse model. These findings suggest that targeting EGR1-mediated metabolic reprogramming to OXPHOS with metformin or IM156 provides a potential therapeutic strategy to overcome ibrutinib resistance in relapsed/refractory DLBCL or MCL.
Introduction
Targeting Bruton tyrosine kinase (BTK) in the B-cell receptor (BCR) pathway by small molecule inhibitors has revolutionized the treatment of B-cell non-Hodgkin lymphoma.1 The first-in-class BTK inhibitor ibrutinib is a Food and Drug Administration–approved agent for the treatment of patients with mantle cell lymphoma (MCL), chronic lymphocytic leukemia (CLL), marginal zone lymphoma, and Waldenstrom macroglobulinemia, based on a high clinical response rate in these patients.1 In diffuse large B-cell lymphoma (DLBCL), single ibrutinib treatment achieved partial or complete responses in 37% of the relapsed/refractory patients with the activated B-cell–like (ABC) subtype, in which BCR is chronically activated.2 When combined with rituximab plus cyclophosphamide, doxorubicin, vincristine, and prednisone (R-CHOP) chemotherapy, ibrutinib led to improved 3-year event-free survival of all younger patients with DLBCL (age ≤60 years) with the cooccurrence of MYD88L265P and CD79B mutations and NOTCH1 mutations genetic subtypes.3 Despite a high response rate, acquired ibrutinib resistance is significant and affects the long-term survival of these responders.4
Ibrutinib resistance is not fully understood, although several acquired resistance mechanisms have been suggested in MCL, CLL, and DLBCL. Next-generation sequencing analysis of patients with relapsed CLL has demonstrated frequently acquired mutations in BTK at the binding site of ibrutinib (C481) with a cysteine-to-serine mutation (BTKC481S) and activating mutations in phospholipase C gamma 2 (PLCγ2), a direct substrate of BTK,5-7 whereas these mutations are not common in MCL.8-11 A recent study has revealed that the mitochondrial oxidative phosphorylation (OXPHOS) pathway components are highly upregulated in samples from patients who are ibrutinib-resistant, suggesting that ibrutinib-resistant tumor cells rely more heavily on the OXPHOS pathway than on glycolysis to produce energy more efficiently.10 A functional genomics approach in ABC DLBCL cell lines has uncovered an epigenetic mechanism of acquired ibrutinib resistance in which the transcription factor 4 (TCF4) upregulates the expression of the Rac family small GTPase 2 (RAC2) that substitutes for BTK in the activation of PLCγ2 and downstream NF-κB signaling.12
Our recent study has demonstrated that early growth response gene 1 (EGR1), a transcription factor and downstream effector of BCR signaling and epigenetic target of JAK1 signaling in ABC DLBCL,13 is overexpressed and promotes the survival and proliferation of ABC DLBCL cells.14 Mechanistically, EGR1 upregulates gene expression in multiple oncogenic pathways, such as MYC and E2F, while repressing expression of the type I interferon pathway genes.14 In this study, we show that EGR1 is also involved in ibrutinib resistance. We found that EGR1 is upregulated further in ibrutinib-resistant ABC DLBCL and MCL cell lines as well as in ibrutinib-resistant primary MCL cells upon ibrutinib treatment. TCF4 and EGR1 self-regulation lead to EGR1 overexpression that mediates metabolic reprogramming to OXPHOS and ibrutinib resistance through transcriptional activation of PDP1, a phosphatase that dephosphorylates and activates the E1 component of the large pyruvate dehydrogenase (PDH) complex.15,16
Materials and methods
See supplemental Materials and methods, available on the Blood website, for details.
Cell viability assay
CellTiter-Glo (Promega) luminescent cell viability assay was performed according to the manufacturer’s instructions. Briefly, cells were seeded at 3000 to 8000 cells per well in a 96-well plate in the presence of single drugs or drug combinations for 3 days. The number of viable cells in culture is proportional to or linearly correlated with the amount of adenosine triphosphate (ATP) detected by a luminescent signal. SynergyFinder 2.017 was used to quantify the degree of synergy between 2 drugs. A score >0 indicates a synergistic effect of 2 drugs. A higher score value suggests a stronger synergistic effect. The interactive synergy distribution plots and summary synergy scores were generated for each pair of drugs. The 50% inhibitory concentration (IC50) values were determined by GraphPad Prism (9.0), using a 4-parameter nonlinear regression model.
Cell cycle assay
Cell cycle was analyzed with the allophycocyanin (APC) bromodeoxyuridine (BrdU) Kit (BD Pharmingen), following the manufacturer’s instructions. Cells were incubated with BrdU for 4 hours. The cells were washed in the staining buffer, fixed/permeabilized with the cytofix/cytoperm buffer or cytofix/cytoperm buffer plus and washed with the perm/wash buffer. After permeabilization, cells were treated with DNase for 1 hour at 37°C, and then stained with APC-conjugated anti-BrdU antibody and 7-amino-actinomycin D (25 mg/mL). The stained samples were analyzed using an Attune flow cytometer (Thermo Fisher).
Apoptosis assays
Cell apoptosis was measured using the APC–annexin V and propidium iodide (PI) staining kit (BD Pharmingen no. 556547), following the manufacturer’s protocols. Briefly, cells with different treatments were collected, washed twice with cold phosphate-buffered saline (PBS), and then resuspended in 1× binding buffer from the kit. APC–annexin V and PI were added and incubated for 15 minutes at room temperature in the dark. Samples were evaluated with an Attune flow cytometer, and the data were analyzed by FlowJo 10.8.2 software.
RNA sequencing
Total RNA was extracted using the RNeasy Plus mini kit (Qiagen) according to the manufacturer’s protocol. RNA sequencing (RNA-seq) libraries were prepared by using the Illumina TruSeq stranded messenger RNA (mRNA) LT sample preparation kit (Illumina). Gene set enrichment analysis (GSEA) was performed by GSEA software (version 3.0; http://software.broadinstitute.org/gsea/index.jsp).
Patient-derived xenograft MCL model
All 4 primary MCL samples were provided by Vu N. Ngo at the Beckman Research Institute of City of Hope and were used according to a recent study.18 A total of 2 × 10⁶ MCL-7 cells were resuspended in 0.1 mL PBS and injected into the tail vein of sublethally irradiated (2 Gy) NOD scid γc−/− NSG mice. After 35 days, the spleens and livers of mice were collected to obtain the single-cell suspensions of the tumor. Subsequently, 8 × 10⁶ freshly isolated tumor cells were directly injected into the flanks of separate male and female NSG mice. Mice were randomized to receive vehicle, ibrutinib, IM156, or a combination of both at the indicated doses in the figure or main text. MCL-7 cells were virally transduced to express luciferase.18 Mice were imaged for luciferase activity to monitor the tumor signal. Luciferase-based bioluminescent imaging and analysis were performed using the Xenogen IVIS Imaging System (Caliper Life). Briefly, mice were anesthetized and injected intraperitoneally with 1.5 mg D-luciferin (15 mg/mL in PBS; Gold Biotechnology). Images were taken 15 minutes after the injection. For bioluminescence plots, total photon flux was calculated for each mouse in the gated areas. Imaging was performed every week, and end point assays were conducted 4 weeks after injection.
Statistical analysis
The two-tailed student t test was used to determine a significant difference between 2 groups. One-way or two-way analysis of variance was used to analyze variance for comparisons between 3 or more groups. Survival was compared by the log-rank test. Results were presented as mean ± standard deviation or standard error of the mean. ∗P < .05, ∗∗P < .01, ∗∗∗P < .001, and ∗∗∗∗P < .0001 were used to show statistical significance.
Results
EGR1 overexpression and upregulation by ibrutinib in ibrutinib-resistant lymphoma cells
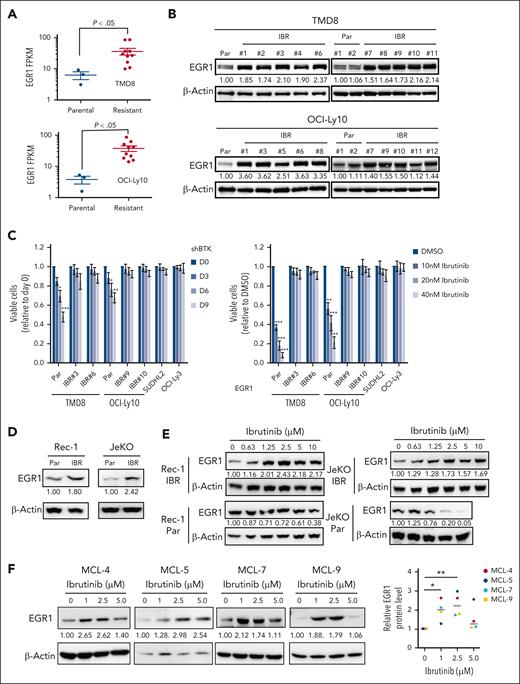
We developed ibrutinib-resistant ABC DLBCL cells by starting with a very low dose of 0.1 nM ibrutinib and increasing the drug concentration stepwise up to 100 nM for a period of 40 weeks. The cells were kept under permanent pressure by adding 10 to 20 nM of ibrutinib to the culture media. Then single-cell clones were generated. For each cell line, we performed RNA-seq analysis on 10 resistant clones and 3 parental cell replicates. A CLL study has shown that BCR gene signature19 is enriched in ibrutinib-resistant, BTKC418S expressing CLL cells.20 Based on these 27 BCR signature genes, our RNA-seq data demonstrated that 22 of them were upregulated in 1 or both ibrutinib-resistant cell lines, and EGR1 was the second-most upregulated gene (Figure 1A; supplemental Figure 1A; supplemental Table 1). Immunoblot analysis confirmed increased EGR1 expression in all resistant clones compared with that in their parental cells (Figure 1B). Our recent study revealed that EGR1 expression is higher in ABC DLBCL than germinal center B-cell–like DLBCL and normal mature B cells and is selectively required for the survival and proliferation of ABC DLBCL cells.14 Interestingly, our single-nucleotide polymorphism analysis did not identify any mutation in BTK in resistant clones (supplemental Table 1). We tested 2 resistant clones of TMD8 or OCI-Ly10 for sensitivity to BTK inhibition by BTK short hairpin RNA (shRNA)21 or ibrutinib. Two primary ibrutinib-resistant cell lines, SUDHL22 and OCI-Ly3,22 served as controls. Indeed, all resistant clones were not sensitive to BTK shRNA or ibrutinib, like the 2 controls (Figure 1C). Of note, EGR1 expression was maintained at a high level for at least a month when resistant cells were cultured without ibrutinib (supplemental Figure 1B).
EGR1 expression is elevated and further upregulated upon ibrutinib treatment in ibrutinib-resistant cells. (A) RNA-seq analysis shows significantly increased EGR1 expression in ibrutinib-resistant cell clones (IBR; 10 clones) compared with that in the parental (Par) cells (3 replicates). (B) Immunoblot analysis shows increased EGR1 protein levels in IBR clones. (C) IBR clones are not sensitive to BTK shRNA (left) or ibrutinib (right). SUDHL2 and OCI-Ly3 are ibrutinib-resistant cell lines used as controls. Error bars represent mean ± standard deviation (SD) (∗P < .05; ∗∗P < .01; ∗∗∗P < .001; n = 3). (D) Immunoblot analysis shows increased EGR1 protein levels in IBR clones. (E) Immunoblot analysis shows increased EGR1 expression in resistant cells but reduced EGR1 expression in parental cells after 72 hours of ibrutinib treatment. (F) Immunoblot analysis shows increased EGR1 protein levels after 72 hours of ibrutinib treatment in all 4 patient samples. Protein bands were quantified by densitometry (∗P < .05; ∗∗P < .01). β-actin served as a loading control for all immunoblot experiments. DMSO, dimethyl sulfoxide; FPKM, fragments per kilobase of transcript per million mapped reads.
EGR1 expression is elevated and further upregulated upon ibrutinib treatment in ibrutinib-resistant cells. (A) RNA-seq analysis shows significantly increased EGR1 expression in ibrutinib-resistant cell clones (IBR; 10 clones) compared with that in the parental (Par) cells (3 replicates). (B) Immunoblot analysis shows increased EGR1 protein levels in IBR clones. (C) IBR clones are not sensitive to BTK shRNA (left) or ibrutinib (right). SUDHL2 and OCI-Ly3 are ibrutinib-resistant cell lines used as controls. Error bars represent mean ± standard deviation (SD) (∗P < .05; ∗∗P < .01; ∗∗∗P < .001; n = 3). (D) Immunoblot analysis shows increased EGR1 protein levels in IBR clones. (E) Immunoblot analysis shows increased EGR1 expression in resistant cells but reduced EGR1 expression in parental cells after 72 hours of ibrutinib treatment. (F) Immunoblot analysis shows increased EGR1 protein levels after 72 hours of ibrutinib treatment in all 4 patient samples. Protein bands were quantified by densitometry (∗P < .05; ∗∗P < .01). β-actin served as a loading control for all immunoblot experiments. DMSO, dimethyl sulfoxide; FPKM, fragments per kilobase of transcript per million mapped reads.
Using a similar dose-increasing strategy, we generated 2 MCL-resistant cell lines Rec-1 and JeKo-1, although single-cell clones were not successful (supplemental Figure 1C). EGR1 expression was also elevated in resistant cells (Figure 1D). Of note, EGR1 expression is further upregulated in Rec-1– and JeKo-1–resistant cells but reduced in their parental cells upon ibrutinib treatment (Figure 1E). A reduction in EGR1 expression after BTK inhibition in parental cells is expected, as EGR1 is a downstream target of BCR signaling.14,23
To examine EGR1 expression in primary cancer cells, we started by using 4 patient-derived xenograft (PDX) MCL samples, which were used in a recent study.18 The samples came from patients with relapsed MCL who were heavily treated with chemotherapy drugs and ibrutinib and lacked mutations in BTK based on whole-exome sequencing analysis in our other study.24 To expand primary cancer cells from the 4 PDX MCL samples, we injected 2 million cells IV into immunocompromised NSG mice after sublethal total body irradiation of 2 Gy (supplemental Figure 2A). After 35 to 45 days of injection, flow cytometric analysis of livers and spleens confirmed that 85% to 90% cells were cancer cells without phenotypical changes, as assessed by continued positivity for human CD19 and negativity for human CD38 (supplemental Figure 2B-C). Furthermore, there were no phenotypical changes in MCL cells after a second expansion in NSG mice (supplemental Figure 2D). We obtained 500 to 1500 million cells per animal that were cryopreserved for future use.
After 3 days of ibrutinib treatment, we found drug resistance in all 4 samples (MCL-4, MCL-5, MCL-7, and MCL-9; supplemental Figure 2E). To test the possibility that ibrutinib treatment regulates EGR1 expression, we performed an immunoblot assay after 72 hours of ibrutinib treatment. The result demonstrated a significant increase in EGR1 expression in all 4 samples upon 1 or 2.5 μM ibrutinib treatment (Figure 1F). EGR1 expression in MCL-4, MCL7, and MCL9 was slightly increased after 5 μM ibrutinib treatment, the highest dose that likely led to nonspecific toxicity to the cells (Figure 1F). Taken together, these results reveal that EGR1 is overexpressed in ibrutinib-resistant ABC DLBCL and MCL cells and is further upregulated by ibrutinib treatment, suggesting a role EGR1 plays in acquired ibrutinib resistance.
EGR1 overexpression contributes to ibrutinib resistance
To examine the role of EGR1 in ibrutinib resistance, we used an inducible retroviral vector to express EGR1 complementary DNA in TMD8 and OCI-Ly10 cells and then performed an in vitro survival assay after treatment with various concentrations of ibrutinib. The result demonstrated that EGR1 overexpressed cells significantly reduced sensitivity to ibrutinib treatment as IC50 was increased by more than threefold compared with uninduced control cells (Figure 2A). Conversely, EGR1 knockdown in the ibrutinib-resistant TMD8 or OCI-Ly10 clones increased the sensitivity of these cells to ibrutinib treatment both in vitro (Figure 2B) and in a xenograft mouse model (Figure 2C). Altogether, the data support a role for EGR1 in ibrutinib resistance.
EGR1 mediates ibrutinib resistance. (A) Retroviral EGR1 expression after induction with 20 ng/mL doxycycline (Dox; left). Trypan blue cell viability assay after 3-day ibrutinib treatment with or without induction of EGR1 expression by 20 ng/mL Dox (right). Error bars represent mean ± SD of triplicates (∗P < .05; ∗∗P < .01; ∗∗∗P < .001; ∗∗∗∗P < .0001). (B) Flow cytometric analysis of cell viability of GFP-positive shRNA-expressing cells for up to 9 days of EGR1 shRNA or control shRNA expression in the presence of ibrutinib or DMSO control. Error bars represent mean ± SD of triplicates (∗∗∗P < .001; ∗∗∗∗P < .0001). (C) Ibrutinib-resistant ABC DLBCL xenografts. OCI-Ly10 ibrutinib-resistant cells were established as a subcutaneous tumor (average, 150 mm3) in NSG mice, and then treated with 3 mg/kg ibrutinib (intraperitoneally.) daily for 4 weeks or PBS vehicle. EGR1 shRNA or control shRNA expression was induced with 2 mg/mL Dox in drinking water. Tumor volume and the survival of recipient mice in each group are shown. Error bars represent mean ± standard error of the mean (SEM); two-way analysis of variance [ANOVA], ∗P < .05; ∗∗P < .01; ∗∗∗P < .001).
EGR1 mediates ibrutinib resistance. (A) Retroviral EGR1 expression after induction with 20 ng/mL doxycycline (Dox; left). Trypan blue cell viability assay after 3-day ibrutinib treatment with or without induction of EGR1 expression by 20 ng/mL Dox (right). Error bars represent mean ± SD of triplicates (∗P < .05; ∗∗P < .01; ∗∗∗P < .001; ∗∗∗∗P < .0001). (B) Flow cytometric analysis of cell viability of GFP-positive shRNA-expressing cells for up to 9 days of EGR1 shRNA or control shRNA expression in the presence of ibrutinib or DMSO control. Error bars represent mean ± SD of triplicates (∗∗∗P < .001; ∗∗∗∗P < .0001). (C) Ibrutinib-resistant ABC DLBCL xenografts. OCI-Ly10 ibrutinib-resistant cells were established as a subcutaneous tumor (average, 150 mm3) in NSG mice, and then treated with 3 mg/kg ibrutinib (intraperitoneally.) daily for 4 weeks or PBS vehicle. EGR1 shRNA or control shRNA expression was induced with 2 mg/mL Dox in drinking water. Tumor volume and the survival of recipient mice in each group are shown. Error bars represent mean ± standard error of the mean (SEM); two-way analysis of variance [ANOVA], ∗P < .05; ∗∗P < .01; ∗∗∗P < .001).
TCF4 and EGR1 self-regulation mediate EGR1 overexpression in ibrutinib-resistant cells
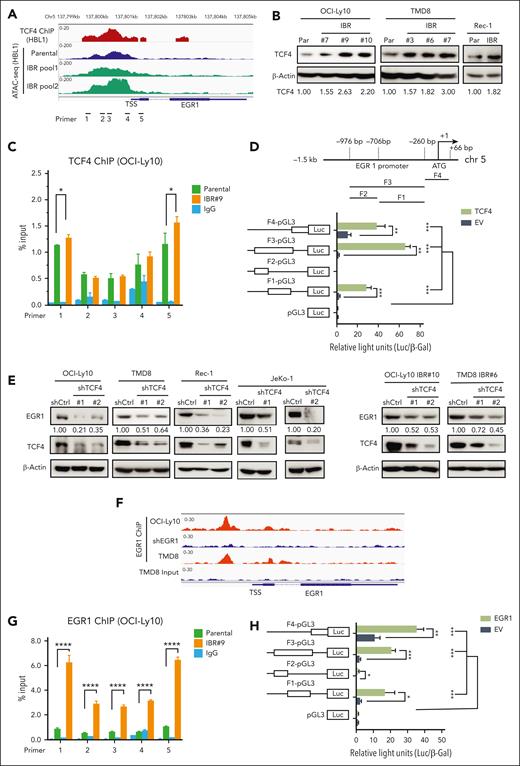
A recent study using ABC DLBCL cell lines demonstrated that EGR1 is a transcriptional target gene of TCF4, a transcription factor and driver for epigenetic ibrutinib resistance in ABC DLBCL.12 We reanalyzed TCF4 chromatin immunoprecipitation (ChIP)-seq data from this study and found significant TCF4 genomic occupancy on the EGR1 promoter region in ABC DLBCL cells (Figure 3A). Transposase-accessible chromatin with sequencing (ATAC-seq) data also revealed genomic openness of the EGR1 promoter region in both ibrutinib-resistant and their parental cells (Figure 3A). Motif analysis of ATAC-seq peak-located regions revealed a significant enrichment of the TCF4 motif (ITF2) in ibrutinib-resistant cells (supplemental Figure 3A). To test whether EGR1 upregulation in ibrutinib-resistant cells is mediated by TCF4, we first found increased TCF4 expression in ibrutinib-resistant cells (Figure 3B). We then performed TCF4 ChIP- quantitative polymerase chain reaction (qPCR) analysis, and the result showed TCF4 binding to the EGR1 promoter region and increased binding signals in 2 pairs of primers in ibrutinib-resistant cells compared with that in their parental cells (Figure 3C). We also used a standard dual luciferase reporter gene assay and confirmed that TCF4-induced EGR1 transcription occurred by binding to the EGR1 promoter core region (Figure 3D). Furthermore, we generated 2 TCF4 shRNAs and found reduced EGR1 expression in both ABC DLBCL and MCL cell lines tested compared with that in the control shRNA, confirming EGR1 as a target of TCF4 in these lymphoma cells (Figure 3E, left). In addition, EGR1 expression was reduced in TCF4 shRNA-expressing ibrutinib-resistant cells compared with in cells expressing control shRNA (Figure 3E, right). Therefore, the data suggest that TCF4 mediates EGR1 overexpression in ibrutinib-resistant cells.
TCF4 and EGR1 self-regulation mediate EGR1 overexpression in ibrutinib-resistant cells. (A) The peaks of TCF4 ChIP-seq in HBL1 ABC DLBCL cells and ATAC-seq in the ibrutinib-resistant pool and parental HBL1 cells located at genomic regions of the EGR1 gene from a recent study.12 (B) Immunoblot analysis of TCF4 expression in ibrutinib-resistant cells of OCI-Ly10, TMD8, and Rec-1 compared with that in their parent cells. β-actin served as a loading control. (C) TCF4 ChIP-qPCR analysis with the indicated 5 pairs of primers for the EGR1 promoter and transcription start site regions. Immunoglobulin G (IgG) served as a control. Error bars represent mean ± SD (∗P < .05; n = 3). (D) TCF4 binds to the EGR1 promoter region (top) and induces EGR1 transcription by a standard dual luciferase reporter gene assay in 293T cells (bottom) (∗∗P < .01; ∗∗∗P < .001; n = 3). Firefly luciferase activity from the pGL3 basic reporter was normalized with β-galactosidase activity. (E) Immunoblot analysis of EGR1 and TCF4 expression after knockdown of TCF4 by 2 shRNAs or a control shRNA. β-Actin served as a loading control. (F) The peaks of EGR1 ChIP-seq OCI-Ly10 or TMD8 cells on genomic regions of the EGR1 gene from our recent study.14 EGR1 shRNA expression sample served as a ChIP control in OCI-Ly10 cell line. (G) EGR1 ChIP-qPCR analysis with the same EGR1 primers as in panel C. IgG served as a control. Error bars represent mean ± SD (∗∗∗∗P < .0001; n = 3). (H) EGR1 binds to its own promoter region for transcription. The same luciferase reporter gene constructs were used as in panel D (∗P < .05; ∗∗P < .01; ∗∗∗P < .001; n = 3). Firefly luciferase activity from the pGL3 basic reporter was normalized with β-galactosidase activity.
TCF4 and EGR1 self-regulation mediate EGR1 overexpression in ibrutinib-resistant cells. (A) The peaks of TCF4 ChIP-seq in HBL1 ABC DLBCL cells and ATAC-seq in the ibrutinib-resistant pool and parental HBL1 cells located at genomic regions of the EGR1 gene from a recent study.12 (B) Immunoblot analysis of TCF4 expression in ibrutinib-resistant cells of OCI-Ly10, TMD8, and Rec-1 compared with that in their parent cells. β-actin served as a loading control. (C) TCF4 ChIP-qPCR analysis with the indicated 5 pairs of primers for the EGR1 promoter and transcription start site regions. Immunoglobulin G (IgG) served as a control. Error bars represent mean ± SD (∗P < .05; n = 3). (D) TCF4 binds to the EGR1 promoter region (top) and induces EGR1 transcription by a standard dual luciferase reporter gene assay in 293T cells (bottom) (∗∗P < .01; ∗∗∗P < .001; n = 3). Firefly luciferase activity from the pGL3 basic reporter was normalized with β-galactosidase activity. (E) Immunoblot analysis of EGR1 and TCF4 expression after knockdown of TCF4 by 2 shRNAs or a control shRNA. β-Actin served as a loading control. (F) The peaks of EGR1 ChIP-seq OCI-Ly10 or TMD8 cells on genomic regions of the EGR1 gene from our recent study.14 EGR1 shRNA expression sample served as a ChIP control in OCI-Ly10 cell line. (G) EGR1 ChIP-qPCR analysis with the same EGR1 primers as in panel C. IgG served as a control. Error bars represent mean ± SD (∗∗∗∗P < .0001; n = 3). (H) EGR1 binds to its own promoter region for transcription. The same luciferase reporter gene constructs were used as in panel D (∗P < .05; ∗∗P < .01; ∗∗∗P < .001; n = 3). Firefly luciferase activity from the pGL3 basic reporter was normalized with β-galactosidase activity.
EGR1 can target itself based on our recent EGR1 ChIP-seq analysis (Figure 3F).14 ChIP-qPCR confirmed EGR1 binding to its own promoter region and also demonstrated that its binding capacity was significantly increased in ibrutinib-resistant cells compared with their parental cells (Figure 3G). Similar to TCF4, EGR induces its own transcription through binding to its promoter core region (Figure 3H). Thus, in addition to TCF4, EGR1 self-regulation also contributes to the high level of its expression in ibrutinib-resistant cells.
Metabolic reprogramming to OXPHOS in ibrutinib-resistant cells
A recent study has revealed that mitochondrial OXPHOS is a hallmark of ibrutinib resistance in MCL.10 RNA-seq analysis on clinical specimens isolated from 15 ibrutinib-sensitive and 6 ibrutinib-resistant primary MCL samples demonstrated that in addition to the known players associated with ibrutinib resistance, such as mTOR and MYC, the mitochondrial OXPHOS pathway components are highly upregulated in these samples from patients who are ibrutinib-resistant.10 To investigate the molecular mechanisms underlying ibrutinib resistance in ABC DLBCL, we conducted GSEA for RNA-seq data and found downregulation of glycolysis genes and upregulation of protein secretion and interferon signaling pathway genes in ibrutinib-resistant clones compared with in parental cells (supplemental Figure 4A-B). We hypothesized that ibrutinib-resistant tumor cells relied more heavily on the OXPHOS pathway than on glycolysis to produce energy more efficiently.
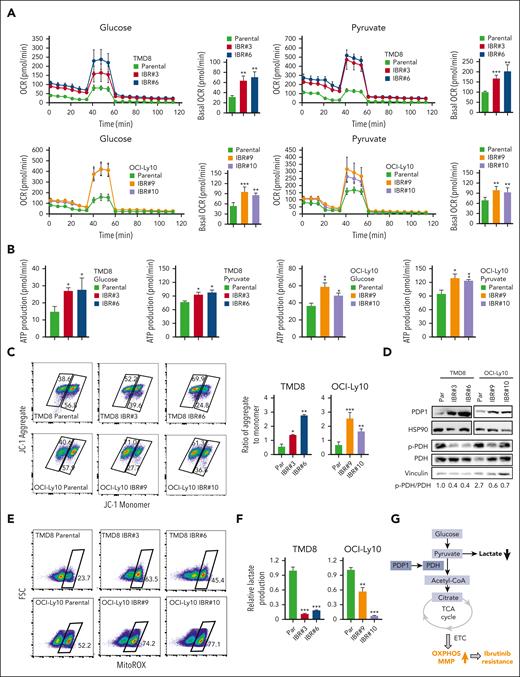
To test this hypothesis, we focused on the PDH complex that converts pyruvate into acetyl-CoA and links the glycolysis metabolic pathway to the tricarboxylic acid cycle in mitochondria.25 We found increased oxygen consumption rates (OCRs; Figure 4A), ATP production (Figure 4B), and mitochondrial membrane potential (MMP; Figure 4C), all of which are indicators of mitochondrial OXPHOS activity in ibrutinib-resistant TMD8 and OCI-Ly10 cells. Immunoblot analysis indicated increased expression of PDP1, a phosphatase for PDH,15,16 leading to a reduction in PDH phosphorylation in resistant cells (Figure 4D). Reduced PDH phosphorylation is known to increase PDH activity, which converts pyruvate into acetyl-CoA, which is used in the tricarboxylic acid cycle in the mitochondria.26,27 We then measured mitochondrial superoxide production and demonstrated increased reactive oxygen species production in the resistant cells (Figure 4E), supporting an increase in mitochondrial OXPHOS in these cells. To support these results, we found that PDH enzyme activity was increased in ibrutinib-resistant clones compared with their parental cells (supplemental Figure 5A). Consistent with RNA-seq data, lactate production was reduced in the ibrutinib-resistant cells because of reduced glycolysis (Figure 4F). In summary, metabolic reprogramming from glycolysis to OXPHOS is a phenotypical change in the ibrutinib-resistant cells, which likely results from increased PDP1 activity that dephosphorylates and then activates PDH (Figure 4G).
Metabolic reprogramming to OXPHOS is a hallmark of ibrutinib resistance. (A) OCRs were determined by a Seahorse XFe96 extracellular flux analyzer. Increased basal OCRs in IBRs compared with Par cells. Error bars represent mean ± SD (∗∗P < .01; ∗∗∗P < .001; n = 3). (B) Increased ATP production in IBRs compared with that in the Par cells. Error bars represent mean ± SD (∗P < .05; ∗∗P < .01; n = 3). (C) Flow cytometric analyses of MMP by incorporation of 5,5,6,6'-tetrachloro-1,1',3,3' tetraethylbenzimi-dazoylcarbocyanine iodide (JC1) dye. The ratio of aggregate to monomer is shown. Error bars represent mean ± SD (∗P < .05; ∗∗P < .01; ∗∗∗P < .001; n = 3). (D) Immunoblot analysis of PDP1, p-PDH, and PDH. HSP90 or vinculin served as a loading control. (E) Flow cytometric analysis of reactive oxygen species (ROS) production using MitoSOX dye. Data represent 3 independent experiments. (F) Reduced relative lactate production in IBRs compared with that in the Par cells. Error bars represent mean ± SD (∗∗P < .01; ∗∗∗P < .001; n = 3). (G) Schematic illustration of metabolic reprogramming to OXPHOS in ibrutinib resistance. ETC, electron transport chain; FSC, forward scatter; LDH, lactate dehydrogenase; TCA, trichloroacetic acid.
Metabolic reprogramming to OXPHOS is a hallmark of ibrutinib resistance. (A) OCRs were determined by a Seahorse XFe96 extracellular flux analyzer. Increased basal OCRs in IBRs compared with Par cells. Error bars represent mean ± SD (∗∗P < .01; ∗∗∗P < .001; n = 3). (B) Increased ATP production in IBRs compared with that in the Par cells. Error bars represent mean ± SD (∗P < .05; ∗∗P < .01; n = 3). (C) Flow cytometric analyses of MMP by incorporation of 5,5,6,6'-tetrachloro-1,1',3,3' tetraethylbenzimi-dazoylcarbocyanine iodide (JC1) dye. The ratio of aggregate to monomer is shown. Error bars represent mean ± SD (∗P < .05; ∗∗P < .01; ∗∗∗P < .001; n = 3). (D) Immunoblot analysis of PDP1, p-PDH, and PDH. HSP90 or vinculin served as a loading control. (E) Flow cytometric analysis of reactive oxygen species (ROS) production using MitoSOX dye. Data represent 3 independent experiments. (F) Reduced relative lactate production in IBRs compared with that in the Par cells. Error bars represent mean ± SD (∗∗P < .01; ∗∗∗P < .001; n = 3). (G) Schematic illustration of metabolic reprogramming to OXPHOS in ibrutinib resistance. ETC, electron transport chain; FSC, forward scatter; LDH, lactate dehydrogenase; TCA, trichloroacetic acid.
EGR1 mediates OXPHOS and ibrutinib resistance through direct PDP1 transcription
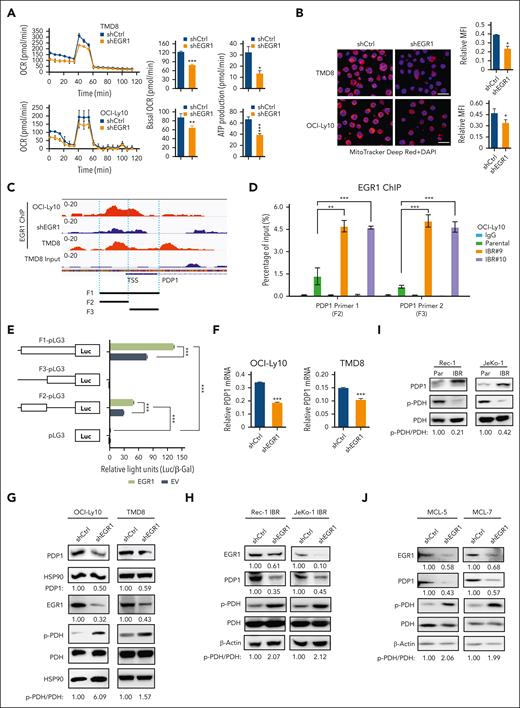
To test the possibility that EGR1 is involved in metabolic reprogramming in ibrutinib resistance, we conducted OCR and MMP analyses and found that EGR1 knockdown significantly reduced OCR (Figure 5A) and MMP (Figure 5B) in ABC DLBCL cells. Reduced OCR and ATP production were also observed in 2 MCL cell lines with ibrutinib resistance (supplemental Figure 5B). Of note, the concentration of doxycycline (20 ng/mL) that was used for shRNA expression did not change the basal level of OCR (supplemental Figure 5C). We searched for mitochondrial functionally related genes that EGR1 binds to and discovered PDP1 as a significant target (Figure 5C), based on our recent ChIP-seq analysis.14 To validate EGR1 binding to PDP1, we performed an EGR1 ChIP-qPCR assay and found increased binding of EGR1 to the promoter and transcription start site regions of PDP1 in ibrutinib-resistant clones compared with their parental cells (Figure 5D). We then used the aforementioned luciferase reporter gene assay and confirmed that EGR1 induced PDP1 transcription through binding to the PDP1 promoter core region (Figure 5E). As expected, EGR1 knockdown reduced expression levels of PDP1 mRNA (Figure 5F) and PDP1 protein (Figure 5G-H) and increased PDH phosphorylation (Figure 5G-H).
EGR1 upregulates PDP1 expression to promote OXPHOS. (A) OCRs were determined by Seahorse XFe96 extracellular flux analyzer. Reduced basal OCR and ATP production after EGR1 knockdown in ABC DLBCL cells. Error bars represent mean ± SD of 3 replicates (∗P < .05; ∗∗P < .01; ∗∗∗P < .001). (B) Reduced MMP after EGR1 knockdown. Representative images of colocalized mitochondrial tracker Deep Red and 4′,6-diamidino-2-phenylindole (DAPI) nuclear staining in the indicated cells. Mean fluorescence intensity (MFI) of MitoTracker Deep Red relative to DAPI nuclear DNA staining was determined by NIH ImageJ. Error bars represent mean ± SD (∗P < .05; n = 3). Scale bar, 20 μm. (C) EGR1 ChIP-seq data show EGR1 binding peaks on the PDP1 promoter region. (D) EGR1 ChIP-qPCR analysis with 2 pairs of primers (F2 and F3) for the PDP1 promoter core regions. IgG served as a control. Error bars represent mean ± SD (∗∗P < .01; ∗∗∗P < .001; n = 3). (E) EGR1 induces PDP1 transcription by a standard dual luciferase reporter gene assay in 293T cells (∗∗∗P < .001; n = 3). Firefly luciferase activity from the pGL3 basic reporter was normalized with β-galactosidase activity. (F) Real-time PCR for PDP1 mRNA expression relative to β-actin. Error bars represent mean ± SD of 3 replicates (∗∗∗P < .001). (G) Immunoblot analysis of PDP1, p-PDH, and PDH expression after EGR1 knockdown in ABC DLBCL cells. HSP90 served as a loading control. (H) Immunoblot analysis of PDP1, p-PDH, and PDH expression after EGR1 knockdown in the ibrutinib-resistant MCL cell lines. β-actin served as a loading control. (I) Immunoblot analysis of PDP1, p-PDH, and PDH expression in MCL parental and ibrutinib-resistant cells. β-actin served as a loading control. (J) Immunoblot analysis of PDP1, p-PDH, and PDH expression after EGR1 knockdown in the ibrutinib-resistant primary MCL cells. β-actin served as a loading control. TSS, transcription start site.
EGR1 upregulates PDP1 expression to promote OXPHOS. (A) OCRs were determined by Seahorse XFe96 extracellular flux analyzer. Reduced basal OCR and ATP production after EGR1 knockdown in ABC DLBCL cells. Error bars represent mean ± SD of 3 replicates (∗P < .05; ∗∗P < .01; ∗∗∗P < .001). (B) Reduced MMP after EGR1 knockdown. Representative images of colocalized mitochondrial tracker Deep Red and 4′,6-diamidino-2-phenylindole (DAPI) nuclear staining in the indicated cells. Mean fluorescence intensity (MFI) of MitoTracker Deep Red relative to DAPI nuclear DNA staining was determined by NIH ImageJ. Error bars represent mean ± SD (∗P < .05; n = 3). Scale bar, 20 μm. (C) EGR1 ChIP-seq data show EGR1 binding peaks on the PDP1 promoter region. (D) EGR1 ChIP-qPCR analysis with 2 pairs of primers (F2 and F3) for the PDP1 promoter core regions. IgG served as a control. Error bars represent mean ± SD (∗∗P < .01; ∗∗∗P < .001; n = 3). (E) EGR1 induces PDP1 transcription by a standard dual luciferase reporter gene assay in 293T cells (∗∗∗P < .001; n = 3). Firefly luciferase activity from the pGL3 basic reporter was normalized with β-galactosidase activity. (F) Real-time PCR for PDP1 mRNA expression relative to β-actin. Error bars represent mean ± SD of 3 replicates (∗∗∗P < .001). (G) Immunoblot analysis of PDP1, p-PDH, and PDH expression after EGR1 knockdown in ABC DLBCL cells. HSP90 served as a loading control. (H) Immunoblot analysis of PDP1, p-PDH, and PDH expression after EGR1 knockdown in the ibrutinib-resistant MCL cell lines. β-actin served as a loading control. (I) Immunoblot analysis of PDP1, p-PDH, and PDH expression in MCL parental and ibrutinib-resistant cells. β-actin served as a loading control. (J) Immunoblot analysis of PDP1, p-PDH, and PDH expression after EGR1 knockdown in the ibrutinib-resistant primary MCL cells. β-actin served as a loading control. TSS, transcription start site.
Similar to ABC DLBCL–resistant cells, PDP1 was overexpressed in 2 MCL-resistant cell lines, thus leading to reduced PDH phosphorylation (Figure 5I). This is EGR1-dependent because knockdown of EGR1 significantly reduced PDP1 expression (Figure 5H). Reduced PDP1 was also observed in 2 ibrutinib-resistant patient samples after EGR1 knockdown (Figure 5J). As expected, knockdown of EGR1 significantly reduced PDH activity (supplemental Figure 5D). Of note, PDP1 is a specific target of EGR1 because EGR1 knockdown did not change PDP2 or PDK1 expression (supplemental Figure 5E), and no significant changes in PDP2 or PDK1 expression were observed in ibrutinib-resistant clones compared with that in their parental cells (supplemental Figure 5F).
Next, we used an inducible retroviral vector to express PDP1 complementary DNA in ABC DLBCL and MCL parental cells with 20 ng/ml of doxycycline and found that PDP1 overexpression reduced PDH phosphorylation but did not change the expression of PDP2 or PDK1 (supplemental Figure 6A). A negative result was shown in the empty vector control (supplemental Figure 6B). Increased PDH enzyme activity due to PDP1 overexpression was confirmed by the PDH activity assay (supplemental Figure 6C). Together, these data support our hypothesis that EGR1 transcriptionally activates PDP1 expression and then mediates metabolic reprogramming to OXPHOS and ibrutinib resistance.
Targeting OXPHOS with metformin or IM156 to overcome ibrutinib resistance
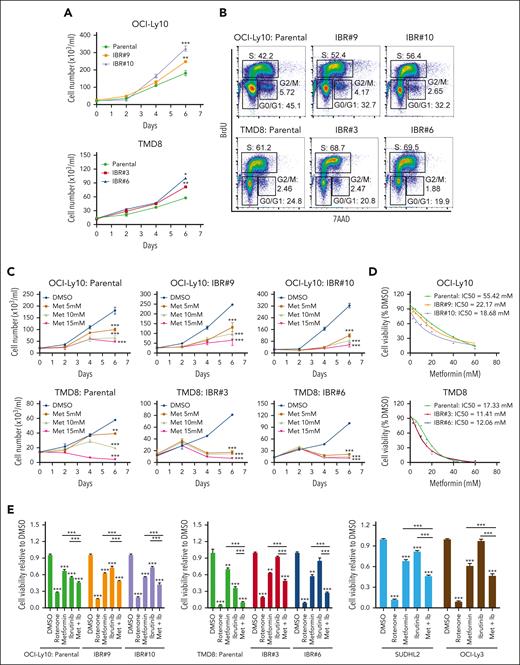
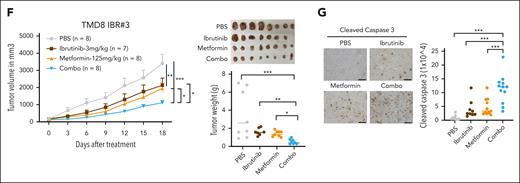
To target EGR1-mediated OXPHOS and ibrutinib resistance, we used metformin as an OXPHOS inhibitor, a generic diabetes drug that has been used for cancer treatment.28 We first validated ibrutinib-resistant ABC DLBCL cells by xenografts, which demonstrated that ibrutinib treatment significantly reduced the growth of parental cells but not ibrutinib-resistant cells (supplemental Figure 7A). We observed an in vitro growth advantage of the resistant ABC DLBCL cells over their parental cells (Figure 6A) by promoting cell cycle progression from the G1 to the S phase (Figure 6B). The cell viability assay showed that both the resistant and parental cells are sensitive to metformin treatment (Figure 6C), but the IC50 of the resistant cells was lower than that of the corresponding parental cells (Figure 6D), suggesting that the resistant cells are more dependent on OXPHOS for their survival and fitness. Reduced viable cells in the culture by metformin treatment were due to apoptosis (supplemental Figure 7B) and cell cycle blocks at the G1-S or G2-M phases (supplemental Figure 7C). As expected, metformin treatment restored the sensitivity of the ibrutinib-resistant cells to ibrutinib (Figure 6E). For the 2 primary resistant cell lines SUDHL2 and OCI-Ly3, we titrated metformin concentrations upon 10 nM ibrutinib treatment and found increased sensitivity to ibrutinib at all 3 concentrations (5 mM, 10 mM, and 15 mM) tested (supplemental Figure 7D) and observed a similar pattern in ibrutinib-resistant OCI-Ly10 or TMD8 clones when 5 mM metformin was used (Figure 6E). We next performed the above xenograft experiment (supplemental Figure 8A) and found that the combination of metformin and ibrutinib treatment achieved a greater antitumor effect than the single drug, based on tumor volume and weight measurement (Figure 6F). The treatments did not significantly change mouse body weight in each group (supplemental Figure 8B). The combination treatment triggered more apoptosis than the single drug treatment, as indicated by cleaved caspase 3 (Figure 6G).
Metformin inhibits the proliferation and growth of ibrutinib-resistant cells. (A) The advantage of ibrutinib-resistant cells in cell growth over parental cells. The cell number was counted by trypan blue staining. Error bars represent mean ± SD of 3 replicates (∗P < .05; ∗∗P < .01; ∗∗∗P < .001). (B) Cell cycle analysis by flow cytometry after 4 hours of BrdU incorporation in the indicated cell lines. Data represent 3 independent experiments. (C) Reduced cell number after metformin treatment in parental and resistant cells by trypan blue staining. Error bars represent mean ± SD (∗∗P < .01; ∗∗∗P < .001; n = 3). (D) The resistant cells are more sensitive to metformin treatment than parental cells, based on the CellTiter-Glo luminescent cell viability assay. IC50 was calculated by GraphPad Prism (9.0) using a 4-parameter nonlinear regression model. (E) CellTiter-Glo luminescent cell viability assay shows that metformin restores the sensitivity of the resistant cells to ibrutinib treatment. Cells were treated with 1 μM rotenone (control), 5 mM metformin, 10 nM ibrutinib, or a combination of metformin and ibrutinib. Rotenone was used as a strong inhibitor of complex I of the mitochondrial respiratory chain (MRC). SUDHL2 and OCI-Ly3 are primary ibrutinib-resistant cells. Error bars represent mean ± SD (one-way ANOVA, ∗P < .05; ∗∗P < .01; ∗∗∗P < .001; n = 3). (F) Ibrutinib-resistant ABC DLBCL xenografts. TMD8 ibrutinib-resistant cells were established as a subcutaneous tumor (average, 150 mm3) in NSG mice and then treated with 3 mg/kg ibrutinib (intraperitoneally) daily, 125 mg/kg metformin (met; intraperitoneally) daily, or with a combination of the 2 drugs until the end point (day 18). Error bars represent mean ± SEM (two-way ANOVA, ∗P < .05; ∗∗ P < .01; ∗∗∗P < .001). (G) Immunohistochemical analysis of cleaved caspase 3 in tumor tissues (∗∗∗P < .001). Representative images of each group are shown. Scale bar, 100 μm. Combo, combination.
Metformin inhibits the proliferation and growth of ibrutinib-resistant cells. (A) The advantage of ibrutinib-resistant cells in cell growth over parental cells. The cell number was counted by trypan blue staining. Error bars represent mean ± SD of 3 replicates (∗P < .05; ∗∗P < .01; ∗∗∗P < .001). (B) Cell cycle analysis by flow cytometry after 4 hours of BrdU incorporation in the indicated cell lines. Data represent 3 independent experiments. (C) Reduced cell number after metformin treatment in parental and resistant cells by trypan blue staining. Error bars represent mean ± SD (∗∗P < .01; ∗∗∗P < .001; n = 3). (D) The resistant cells are more sensitive to metformin treatment than parental cells, based on the CellTiter-Glo luminescent cell viability assay. IC50 was calculated by GraphPad Prism (9.0) using a 4-parameter nonlinear regression model. (E) CellTiter-Glo luminescent cell viability assay shows that metformin restores the sensitivity of the resistant cells to ibrutinib treatment. Cells were treated with 1 μM rotenone (control), 5 mM metformin, 10 nM ibrutinib, or a combination of metformin and ibrutinib. Rotenone was used as a strong inhibitor of complex I of the mitochondrial respiratory chain (MRC). SUDHL2 and OCI-Ly3 are primary ibrutinib-resistant cells. Error bars represent mean ± SD (one-way ANOVA, ∗P < .05; ∗∗P < .01; ∗∗∗P < .001; n = 3). (F) Ibrutinib-resistant ABC DLBCL xenografts. TMD8 ibrutinib-resistant cells were established as a subcutaneous tumor (average, 150 mm3) in NSG mice and then treated with 3 mg/kg ibrutinib (intraperitoneally) daily, 125 mg/kg metformin (met; intraperitoneally) daily, or with a combination of the 2 drugs until the end point (day 18). Error bars represent mean ± SEM (two-way ANOVA, ∗P < .05; ∗∗ P < .01; ∗∗∗P < .001). (G) Immunohistochemical analysis of cleaved caspase 3 in tumor tissues (∗∗∗P < .001). Representative images of each group are shown. Scale bar, 100 μm. Combo, combination.
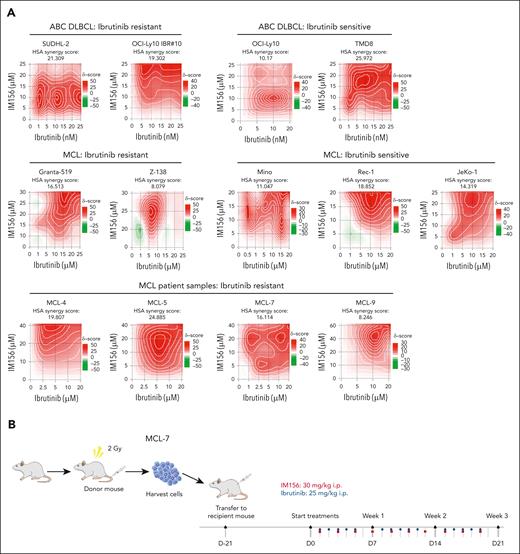
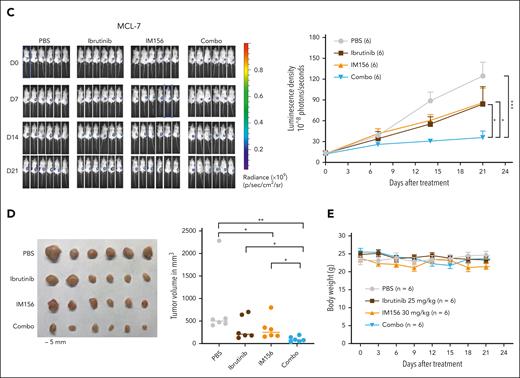
Because the 125 mg/kg metformin used for ABC DLBCL was not effective in MCL xenografts and a higher dose was toxic to the animals, we performed MCL PDX using IM156. IM156 is a novel chemical derivative of metformin that is more potent than metformin and other biguanides, based on preclinical and clinical studies on solid cancers.29-32 We first found that 20 μM of IM156 reduced OCR and cell viability in vitro (supplemental Figure 9A). Synergistic analysis demonstrated that IM156 synergized with ibrutinib in killing all ABC DLBCL and MCL cell lines and 4 primary samples from patients with MCL examined (Figure 7A; supplemental Figure 9B). We then used the MCL-7 patient sample in a PDX model.
Targeting OXPHOS with IM156 restores the sensitivity of the resistant cells to ibrutinib treatment. (A) Synergistic assay in the indicated cell lines and samples from patients with MCL. Synergistic scores were calculated by SynergyFinder 2.0. A score >0 (pink) indicated a synergistic effect of the 2 drugs. (B) Schematic illustration of PDXs of MCL and the treatment procedure. (C) PDXs of MCL. Freshly collected MCL-7 cells were inoculated subcutaneously into NSG mice, and tumor signals were monitored by the Xenogen IVIS Imaging System (Caliper Life) until they reached ∼1 × 10⁸ radiance ps−1 cm2 sr−1, then treated with 25 mg/kg ibrutinib (intraperitoneally) at 5 days a week, 30 mg/kg IM156 (intraperitoneally) every other day for 3 weeks, or with a combination of the 2 drugs. Bioluminescence images of mice before and after treatment (left) and tumor growth curves (right) are shown. The color scale depicts the photon flux (photons per second) emitted by tumors. Error bars represent mean ± SEM (two-way ANOVA, ∗P < .05; ∗∗∗P < .001). (D) Shown are photographs of tumors (left) and tumor volumes (right) from each group on day 21 (∗P < .05; ∗∗P < .01). (E) No significant mouse body weight changes were observed during treatment.
Targeting OXPHOS with IM156 restores the sensitivity of the resistant cells to ibrutinib treatment. (A) Synergistic assay in the indicated cell lines and samples from patients with MCL. Synergistic scores were calculated by SynergyFinder 2.0. A score >0 (pink) indicated a synergistic effect of the 2 drugs. (B) Schematic illustration of PDXs of MCL and the treatment procedure. (C) PDXs of MCL. Freshly collected MCL-7 cells were inoculated subcutaneously into NSG mice, and tumor signals were monitored by the Xenogen IVIS Imaging System (Caliper Life) until they reached ∼1 × 10⁸ radiance ps−1 cm2 sr−1, then treated with 25 mg/kg ibrutinib (intraperitoneally) at 5 days a week, 30 mg/kg IM156 (intraperitoneally) every other day for 3 weeks, or with a combination of the 2 drugs. Bioluminescence images of mice before and after treatment (left) and tumor growth curves (right) are shown. The color scale depicts the photon flux (photons per second) emitted by tumors. Error bars represent mean ± SEM (two-way ANOVA, ∗P < .05; ∗∗∗P < .001). (D) Shown are photographs of tumors (left) and tumor volumes (right) from each group on day 21 (∗P < .05; ∗∗P < .01). (E) No significant mouse body weight changes were observed during treatment.
As described earlier, we expanded primary MCL cells in NSG mice, and 21 days after subcutaneous injection of the tumor cells, we treated the mice intraperitoneally with 25 mg/kg of ibrutinib daily for 3 weeks, 30 mg/kg of IM156 every other day for 3 weeks, or both and compared them with PBS-treated controls (Figure 7B). The results demonstrated that tumor volumes were significantly reduced in the combination group compared with the single drug or PBS groups (Figure 7C-D), suggesting that IM156 restored the sensitivity of MCL-7 cells to ibrutinib treatment. No apparent toxicities were observed in the IM156 and ibrutinib-treated MCL PDX mice, and body weights were not significantly different from each treatment group (Figure 7E). It is reasonably speculated that an increased dependence on OXPHOS for survival and overall fitness in ibrutinib-resistant cells contributes to their resensitization to ibrutinib when cotreated with metformin or IM156. In conclusion, the data demonstrate that EGR1-mediated metabolic reprogramming to OXPHOS is a molecular mechanism underlying ibrutinib resistance, and targeting this mechanism with an OXPHOS inhibitor is a potential novel therapeutic strategy for the treatment of refractory or relapsed ABC DLBCL or MCL.
Discussion
The use of BTK inhibitors has advanced the treatment of B-cell malignancies, but resistance to monotherapy negatively affects clinical outcomes, such as those in DLBCL and MCL.2,33,34 Here, we demonstrate that the transcription factor EGR1 is involved in acquired ibrutinib resistance in DLBCL and MCL. We established ibrutinib-resistant cell lines and found that BCR pathway genes, including EGR1, are upregulated. EGR1 expression is further increased when these resistant cell lines or primary MCL cells are treated with ibrutinib. The overexpression of EGR1 in ibrutinib-resistant cells is likely to result from the transcription factor TCF4-mediated EGR1 transcription and EGR1 self-regulation. Genetic and pharmacological inhibition of EGR1 restores the sensitivity of the resistant cells to ibrutinib, suggesting a role EGR1 plays in ibrutinib resistance. The underlying mechanism is that EGR1 mediates metabolic reprogramming to mitochondrial OXPHOS by transcriptional activation of PDP1, which increases ATP production. Targeting OXPHOS with metformin or IM156 is effective to overcome ibrutinib resistance both in vitro and in vivo.
Acquired ibrutinib resistance can result from activation of compensatory survival pathways, genetic mutations, or clonal selection in malignant cells after chronic exposure to ibrutinib during treatment. BTK or PLCG2 mutations associated with acquired ibrutinib resistance that have been identified frequently after treatment in CLL5,20,35-37 are not common after treatment in DLBCL38 and MCL.10,11 Nongenetic ibrutinib resistance, however, has been documented. Activation of the phosphatidylinositol 3-kinase (PI3K)/protein kinase B (AKT)/mammalian target of rapamycin (mTOR) pathway has been implicated as a way to override the effects of ibrutinib, yielding ibrutinib resistance in MCL.8 Metabolic reprogramming to OXPHOS is a hallmark of ibrutinib resistance in MCL, despite unknown underlying molecular mechanisms.10 Epigenetic ibrutinib resistance driven in part by TCF4 has been shown in ABC DLBCL.12 Reprograming BCR signaling to alternative NF-κB pathways, such as RAC2/PLCγ2, promotes the survival and proliferation of resistant ABC DLBCL cells.12 These molecular mechanisms provide a rationale for the development of targeted therapeutic strategies to overcome ibrutinib resistance. For example, targeting the BCR-mediated PI3K signaling pathway, the use of PI3K inhibitors such as idelalisib39 or rapamycin analogs (eg, everolimus and temsirolimus)40,41 in combination with ibrutinib could be therapeutic options in MCL.
As a downstream target of BCR signaling, EGR1 expression is reduced upon ibrutinib treatment in ABC DLBCL cells, whereas it increases in healthy B cells after BCR stimulation.14,23 Our previous study demonstrated that EGR1 is also a downstream target of the JAK-STAT pathway, in which JAK1 upregulates EGR1 expression through phosphorylation of histone protein H3 in ABC DLBCL.13 In addition to TCF4 in EGR1 regulation and EGR1 self-regulation elucidated in this study, other molecular mechanisms could also underlie EGR1 upregulation and ibrutinib resistance. Our RNA-seq data (supplemental Figure 4) revealed upregulation of the interferon signaling pathway genes in ibrutinib-resistant ABC DLBCL cells. Tumor interferon signaling is involved in drug resistance to immune checkpoint inhibitors.42,43 OAS3, an interferon-induced antiviral enzyme,44 is the most upregulated gene in BCR signaling in ibrutinib-resistant ABC DLBCL cells (supplemental Figure 1A). OAS3 has been suggested as a prognostic and immunotherapeutic biomarker in solid cancers.44 Whether interferon signaling regulates EGR1 expression and contributes to ibrutinib resistance and whether OAS3 can be used as a biomarker for ibrutinib therapy in patients with lymphoma, will be an important area of future studies.
Targeting mitochondrial OXPHOS has emerged as an attractive strategy for cancer therapy. The OXPHOS inhibitor IACS-01075945 has been used in a preclinical study in MCL10 and 2 phase 1 trials in solid cancers and acute myeloid leukemia.46 Because of limited antitumor activity and neurotoxicity, however, both trials were discontinued.46 In this study, we used IM156, a new metformin derivative that is more potent than other biguanides, such as metformin and phenformin.29-32 In a phase 1 trial in solid cancers,31 the IM156 treatment-related side effects were mild to moderate and quite manageable. A phase 1b study of gemcitabine and nab-paclitaxel in combination with IM156 in patients with advanced pancreatic cancer is ongoing (NCT05497778). Potential cotargeting of BTK and mitochondrial OXPHOS by ibrutinib and IM156, like in this preclinical study, could be tested in the clinic for the treatment of refractory/relapsed DLBCL and MCL.
Acknowledgments
This work was supported by the National Institutes of Health, National Cancer Institute (NIH/NCI) grant R01 CA266354 (L.R.), UW-Madison Forward Lymphoma Fund (S.K., L.L.), ASH Bridge Grant (L.R.), UW Center for Human Genomics and Precision Medicine Seed Grant (L.R.), Midwest Athletes Against Childhood Cancer, Inc Fund (P.D.B., C.M.C.), and UW Carbone Cancer Center pilot grant NIH, NCI P30 CA014520 (C.M.C., L.R.). The study was supported in part by the Intramural Research Program of the NIH, NCI (T.A.W.).
The contents of this article do not necessarily reflect the views or policies of the Department of Health and Human Services, nor does mention of trade names, commercial products, or organizations imply endorsement by the US Government.
Authorship
Contribution: L.R. conceived and designed the study and supervised research; T.A.W. and C.M.C. supervised xenograft experiments; Y. Liu, S.K., N.M.H., A.D., L.L., Y. Li, P.D.B., X.G., S.B., M.C., R.C., X.Z., and P.E.S. performed research; L.S. contributed to the expansion of PDX samples; Y. Liu, S.K., L.L., N.M.H., and L.R. analyzed data; V.N.N. provided PDX samples and some intellectual input; V.P.K. provided some intellectual input; Y. Liu, S.K., and L.R. drafted and revised the manuscript; and all authors revised and approved the submitted manuscript.
Conflict-of-interest disclosure: C.M.C. receives honorarium for advisory board membership for Bayer, Elephas, Nektar Therapeutics, Novartis, and WiCell Research Institute, which had no input in the study design, analysis, manuscript preparation, or decision to submit for publication. The remaining authors declare no competing financial interests.
Thomas A. Waldmann died on 25 September 2021.
Correspondence: Lixin Rui, University of Wisconsin-Madison, Department of Medicine, 1111 Highland Ave, WIMR 4053, Madison, WI 53705; e-mail: lrui@medicine.wisc.edu.
References
Author notes
∗Y. Liu and S.K. contributed equally to this work.
RNA-seq data are deposited in the National Center for Biotechnology Information Gene Expression Omnibus database (accession number GSE223150).
The online version of this article contains a data supplement.
There is a Blood Commentary on this article in this issue.
The publication costs of this article were defrayed in part by page charge payment. Therefore, and solely to indicate this fact, this article is hereby marked “advertisement” in accordance with 18 USC section 1734.

![EGR1 mediates ibrutinib resistance. (A) Retroviral EGR1 expression after induction with 20 ng/mL doxycycline (Dox; left). Trypan blue cell viability assay after 3-day ibrutinib treatment with or without induction of EGR1 expression by 20 ng/mL Dox (right). Error bars represent mean ± SD of triplicates (∗P < .05; ∗∗P < .01; ∗∗∗P < .001; ∗∗∗∗P < .0001). (B) Flow cytometric analysis of cell viability of GFP-positive shRNA-expressing cells for up to 9 days of EGR1 shRNA or control shRNA expression in the presence of ibrutinib or DMSO control. Error bars represent mean ± SD of triplicates (∗∗∗P < .001; ∗∗∗∗P < .0001). (C) Ibrutinib-resistant ABC DLBCL xenografts. OCI-Ly10 ibrutinib-resistant cells were established as a subcutaneous tumor (average, 150 mm3) in NSG mice, and then treated with 3 mg/kg ibrutinib (intraperitoneally.) daily for 4 weeks or PBS vehicle. EGR1 shRNA or control shRNA expression was induced with 2 mg/mL Dox in drinking water. Tumor volume and the survival of recipient mice in each group are shown. Error bars represent mean ± standard error of the mean (SEM); two-way analysis of variance [ANOVA], ∗P < .05; ∗∗P < .01; ∗∗∗P < .001).](https://ash.silverchair-cdn.com/ash/content_public/journal/blood/142/22/10.1182_blood.2023020142/1/m_blood_bld-2023-020142-gr2.jpeg?Expires=1769086277&Signature=HzqhFtAMHqsufRAEMqXpeJi4HTIqPJoRFenW~IeudKeOwklI1iau2HB5uXIjqIvS49BN7ltiZWDkz4X4wj5wR8gB3a~iZzUQFZ5b1hs-OtwxV-xQvkCY1Mum9FifdxquoeuteuKT9fsuo5AP-Exhn~Tptg~B3o4JXyhQr9YLpUr2dM6JbrUef6Bt~od7rO~w14VxMuIYYx5AidTqTctkdnjA8VV5iN4uS7tSWKGNmkLVLne3OrOAlYQNhICtqz5EtRaeiecsi21p7PKjF2HsEltKweGf9e9C4pf2uvLNL1271V1q16HfhBUczcn7rSmj-PA7XA2C0hEzZGdPeP1wHA__&Key-Pair-Id=APKAIE5G5CRDK6RD3PGA)
This feature is available to Subscribers Only
Sign In or Create an Account Close Modal