

Key Points
Sterile inflammation in SCD promotes GSDMD-dependent shedding of NETs in the liver.
NETs travel intra-vascularly (embolize) from the liver to the lung, to promote P-selectin–independent lung vascular vaso-occlusion in SCD.
Visual Abstract

Abstract
Acute lung injury, referred to as the acute chest syndrome, is a major cause of morbidity and mortality in patients with sickle cell disease (SCD), which often occurs in the setting of a vaso-occlusive painful crisis. P-selectin antibody therapy reduces hospitalization of patients with SCD by ∼50%, suggesting that an unknown P-selectin–independent mechanism promotes remaining vaso-occlusive events. In patients with SCD, intraerythrocytic polymerization of mutant hemoglobin promotes ischemia-reperfusion injury and hemolysis, which leads to the development of sterile inflammation. Using intravital microscopy in transgenic, humanized mice with SCD and in vitro studies with blood from patients with SCD, we reveal for the first time that the sterile inflammatory milieu in SCD promotes caspase-4/11–dependent activation of neutrophil–gasdermin D (GSDMD), which triggers P-selectin–independent shedding of neutrophil extracellular traps (NETs) in the liver. Remarkably, these NETs travel intravascularly from liver to lung, where they promote neutrophil-platelet aggregation and the development of acute lung injury. This study introduces a novel paradigm that liver-to-lung embolic translocation of NETs promotes pulmonary vascular vaso-occlusion and identifies a new GSDMD-mediated, P-selectin–independent mechanism of lung injury in SCD.
Introduction
Sickle cell disease (SCD) is a genetic disorder that affects millions of people worldwide.1-4 Sickle cell anemia, the most common form of SCD, is caused by a homozygous mutation (SS) in the β-globin gene.1,3 The mutant hemoglobin (HbS) polymerizes under hypoxic conditions, leading to erythrocyte sickling, vaso-occlusion, and hemolysis.5-8 Vaso-occlusion contributes to the development of acute painful vaso-occlusive episodes, which are the primary reason for hospitalization of patients with SCD.1 Clinical evidence suggests that acute chest syndrome, a type of acute lung injury and one of the leading causes of mortality among patients with SCD, is a sequela of an vaso-occlusive episode.1,9,10 Histopathological findings in patients with SCD11,12 and in vivo lung imaging in transgenic-humanized mice with SCD13,14 have identified that occlusion of lung arterioles (pulmonary vaso-occlusion) by neutrophil-platelet–erythrocyte aggregates promotes the development of acute chest syndrome. This etiology also offers a therapeutic window to prevent the development of lung injury in SCD, provided new therapies are identified to treat pulmonary vaso-occlusion. Previously, we have shown that P-selectin blockade13 led to partial (∼50%) protection from pulmonary vaso-occlusion in mice with SCD. A major clinical trial also reported ∼50% reduction in frequency of hospitalization among patients with SCD receiving anti–P-selectin antibody (Ab) therapy.15 Altogether, these findings suggest that pulmonary vaso-occlusion in SCD may also be enabled by a yet unidentified P-selectin–independent mechanism, and new therapies targeting this unknown pathway would be necessary to prevent the development of acute chest syndrome in patients with SCD.
Hemolysis promotes sterile inflammation in SCD by releasing erythrocyte-derived damage-associated molecular-pattern molecules (DAMPs) such as hemoglobin and its oxidation-product heme that scavenge nitric oxide, generate reactive oxygen species (ROS), prime innate immune pathways, and promote the generation of neutrophil extracellular traps (NETs).5,7,14,16-18 NETs are potent neutrophil-derived DAMPs, composed of externalized decondensed-chromatin decorated with citrullinated histones and neutrophil proteases.19-22 Although recent findings suggest a role for NETs in promoting lung injury in mice with SCD18 and patients with SCD,23 the innate immune signaling in neutrophils that promotes NETs generation and NETs-dependent lung injury in SCD remains largely unknown.4,5 Emerging evidence supports a role for pore-forming protein gasdermin D (GSDMD)24 in enabling NETs generation during bacterial infection25,26; however, whether this pathway plays a role in the sterile inflammation of SCD remains unknown.
Here, we use intravital (in vivo) lung13 and liver27 microscopy in mice with SCD and imaging flow cytometry of blood from patients with SCD in vitro to reveal for the first time that the sterile inflammatory milieu in SCD promotes caspase-4 (human) or caspase-11 (mouse)-dependent activation of neutrophil-GSDMD, which triggers shedding of NETs in the liver microcirculation. These NETs travel intravascularly (embolize) from the liver to the lung, to promote P-selectin–independent lung vaso-occlusion in SCD.
Methods
Refer to supplemental Data, available on the Blood Web site for a full description of reagents and methods.
Mice
qFILM
Quantitative fluorescence intravital lung microscopy (qFILM) has been used widely for in vivo assessment of pulmonary vaso-occlusion in mice with SCD.13,14,28,33,35 In the current study, qFILM was used to assess pulmonary vaso-occlusion and detect NETs in the intact lung microcirculation of live mice following IV challenge with saline, oxy-hemoglobin (oxy-Hb), hemin, or lipopolysaccharide with or without pretreatment with N-terminus active domain (GSDMD-NT) inhibitors LDC7559,26 NSA,36 Disulfiram,37 or the pan-caspase inhibitor Z-VAD-FMK,26 haptoglobin,31 or TLR4-inhibitor (TAK242).31 qFILM was conducted with a Nikon multiphoton excitation fluorescence microscope and an APO LWD 25× water immersion objective with 1.1 NA. Before imaging, mice were anesthetized with an intraperitoneal injection of ketamine HCl and xylazine. A cannula was inserted into the right carotid artery, and tracheotomy was performed to facilitate mechanical ventilation with 95% O2 and supply maintenance anesthesia (1% to 2% isoflurane). The left lung was surgically exposed, and a small portion of the lung was immobilized against a coverslip using a vacuum-enabled micromachined device as described elsewhere.35,38 Next, fluorescent Abs and dyes were injected into the carotid artery catheter for visualization of the pulmonary microcirculation, extracellular DNA, and in vivo staining of neutrophil elastase (NE), citrullinated histones, neutrophils, and platelets, respectively. Pulmonary vaso-occlusions and NETs were quantified and compared between treatment groups using the strategy described in supplemental Methods and described previously.13,14,18,28,33,39
Intravital liver microscopy
The liver intravital microscopy experimental setup has been described previously in detail.27,29,40 The same strains of mice and treatment groups as those used in qFILM studies were used. Mice were anesthetized with an intraperitoneal injection of ketamine HCl and xylazine. The right carotid artery was cannulated, and the right lobe of the liver was gently immobilized against a coverslip using a vacuum-enabled micromachined liver-imaging window described elsewhere.27,29,40 Next, fluorescent dyes and Abs were injected into the carotid artery catheter, and intravital observations were conducted with a Nikon multiphoton excitation fluorescence microscope.
Human blood collection
Venous blood was collected in BD Vacutainers (containing sodium citrate) from healthy race-matched control humans (control) and steady state (not in crisis) patients with SCD (SS or S/β0) in accordance with the guidelines set by the Institutional Review Board at the University of Pittsburgh and the Declaration of Helsinki.
Imaging flow cytometry of human and mouse plasma
Imaging flow cytometry was conducted using Image Stream equipment (Amnis, Seattle, WA), and data were analyzed using IDEAS application software version 6.2.187.0 (Amnis).
Isolation of neutrophils from murine blood
Isolation of neutrophils from human blood
Venous blood was incubated for 15 minutes with agonists or inhibitors. After the incubation, blood was transferred into a 15-mL BD Falcon tube containing 4.5 mL PolymorphPrep, and neutrophils were isolated as described elsewhere.44
Western blotting of human and murine neutrophils
Supplemental Tables 1 and 2 show the list of primary and secondary Abs, respectively, and the dilutions used.
Messenger RNA analysis of murine neutrophils
The primer sequences used in the quantitative reverse transcription polymerase chain reaction are listed in the supplemental Table 3.
Statistical analysis
Means were compared using the unpaired Student t test without or with Bonferroni correction or one-way analysis of variance with Games-Howell's multiple comparison test. Percentages were compared using the fourfold table analysis with χ2 statistics.13,14,28P < .05 was considered significant. Unpaired or paired 2-tailed Student t test was used to confirm the significance in western blot analyses.
Results
NETs promote lung vaso-occlusion in mice with SCD in vivo
Using an IV oxy-Hb triggered model of vaso-occlusive crisis in mice with SCD,31 we found that 10 μmol/kg IV oxy-Hb led to acute lung injury in mice with SCD but not control mice (Figure 1A; supplemental Figure 1). Intravital lung microscopy analysis (experimental scheme in Figure 1B) revealed that IV oxy-Hb–induced lung injury was associated with the development of lung vaso-occlusion in mice with SCD. Neutrophils (red) were observed trafficking through the pulmonary arteriole and into the pulmonary capillaries of control mice administered IV oxy-Hb (Figure 1C; supplemental Video 1), indicating the absence of in situ lung vaso-occlusion. In contrast, IV oxy-Hb led to occlusion of pulmonary arteriole “bottlenecks” (junction of a pulmonary arteriole with pulmonary capillaries) by large neutrophil-platelet aggregates (marked by dotted ellipses in Figure 1D; supplemental Video 2). Pulmonary vaso-occlusions were quantified using the strategy described in “Methods” and supplemental data.13,14,33 Number of pulmonary vaso-occlusions per field of view (FOV; Figure 1E), percent FOVs with pulmonary vaso-occlusions (Figure 1F), and number of large pulmonary vaso-occlusions (area >1000 μm2) per FOV (Figure 1G) were significantly higher in mice with SCD administered IV oxy-Hb than control mice administered IV oxy-Hb or mice with SCD administered IV saline. Pulmonary vaso-occlusions were also defined as neutrophil-rich (neutrophil aggregates with few platelets) or platelet-rich (platelet aggregates with few neutrophils), and both groups (representative examples shown in Figure 1D) were found to be significantly higher in mice with SCD than in control mice administered IV oxy-Hb (Figure 1H). Intravital studies using the IV-hemin triggered model of lung injury in mice with SCD30,31 led to similar findings (supplemental Figure 2; supplemental Videos 3-4). Intravital lung microscopy (experimental scheme in Figure 1I) revealed significant abundance of NETs (extracellular DNA colocalized with NE and/or citrullinated-histones18,20,39) in the lung of mice with SCD administered IV oxy-Hb than mice with SCD administered IV saline (Figure 1J) or control mice administered IV oxy-Hb (Figure 1K). To our surprise, these NETs were sequestered primarily within the pulmonary arteriole bottlenecks (Figure 1L-M; supplemental Videos 5-6) and localized within the large-neutrophil aggregates occluding the pulmonary arterioles in mice with SCD (Figure 1N; supplemental Video 7). Intravital studies using the IV-lipopolysaccharide triggered model of lung vaso-occlusion in mice with SCD13,14,33,45 led to similar findings (supplemental Figure 3). NETs components such as citrullinated histones may promote intravascular thrombosis, which contributes to the development of lung vaso-occlusion in mice with SCD.45-47 Indeed, fibrin was present within and around the neutrophil-platelet aggregates occluding the pulmonary arterioles in mice with SCD administered IV oxy-Hb (supplemental Figure 4). Importantly, both pulmonary vaso-occlusions and NETs were significantly fewer in mice with SCD IV administered 10 µmol/kg oxy-Hb with 10 µmol/kg haptoglobin31 than mice with SCD IV administered 10 µmol/kg oxy-Hb alone (supplemental Figure 5).

NETs promote lung vaso-occlusion in mice with SCD in vivo. (A) Lung histology (Hematoxylin and Eosin staining; 10× magnification) of control mice and mice with SCD, 3 hours after IV administration of 10 µmol/kg oxy-Hb. Refer to supplemental Figure 1 for larger FOVs and lung injury quantification. (B) Experimental scheme used in panels C to H: Control mice and mice with SCD were IV administered 10 µmol/kg oxy-Hb or saline, and qFILM was used to assess the absence or presence of platelet-neutrophil aggregate mediated pulmonary vaso-occlusion (PVO). Pulmonary microcirculation (pseudo-colored purple), neutrophils (red), and platelets (pseudo-colored green) were labeled in vivo by IV administration of fluorescein isothiocyanate (FITC) dextran, AF546-anti-Ly6G Ab, and V450-anti-CD49b Ab, respectively. Representative qFILM images are shown in panels C to D. (C) IV oxy-Hb led to minimal lung vaso-occlusion in a control mouse. (D) IV oxy-Hb led to occlusion of arteriolar bottlenecks in the lung of a mouse with SCD by large neutrophil-platelet aggregates (marked by dotted white ellipse). Magnified cropped images of the individual neutrophil-platelet aggregates are shown on the right. Colocalization of neutrophils (red) with platelet (green) appears yellow. (E-H) PVOs were quantified using strategy described in supplemental Methods. IV oxy-Hb led to significantly more (E) PVOs per FOV, (F) percent FOVs with PVOs, (G) large PVOs (with area >1000 µm2) per FOV, and (H) both neutrophil-rich and platelet-rich PVOs per FOV, in mice with SCD compared with control mice. Control IV saline (n = 3 mice; 38 FOVs), SCD IV saline (n = 4 mice; 49 FOVs), control IV oxy-Hb (n = 5 mice; 71 FOVs), SCD IV oxy-Hb (n = 5 mice; 75 FOVs). (I) Experimental scheme used in panels J to N: Control mice and mice with SCD were IV administered 10 µmol/kg oxy-Hb, and qFILM was used to assess the absence or presence of NETs within the pulmonary microcirculation. Pulmonary microcirculation (pseudo-colored purple), neutrophils (blue), extracellular DNA (green), and citrullinated histones (H3-Cit; red) or NE (red) were labeled in vivo by IV administration of Evans blue, Pacific blue–anti-Ly6G Ab, Sytox green, and AF546–anti-H3-Cit Ab or AF546–anti-NE Ab, respectively. (J-K) NETs were quantified as described in supplemental Methods. Number of NETs per FOV (#NETs/FOV) was significantly higher in mice with SCD administered IV oxy-Hb (n = 4 mice; 44 FOVs) than (J) mice with SCD administered IV saline (n = 4 mice; 49 FOVs) or (K) control mice administered IV oxy-Hb (n = 4 mice; 43 FOVs). Representative qFILM images (L-N) reveal NETs (marked by dotted white ellipse) in the pulmonary arteriole bottlenecks of mice with SCD administered IV Oxy-Hb. NETs were identified based on colocalization of Ly6G (blue) with exDNA (green) and (L) H3-cit (red) or (M,N) NE (red). “X” (in panel N) denotes loss of blood flow (purple dye absent) downstream of NETs-associated lung vaso-occlusion (marked by white ellipse). White arrows denote the direction of blood flow within the pulmonary arterioles. Alveoli are marked with white asterisks. Scale bars, 200 µm, in panel A and 20 µm in panels C-D, L-N. qFILM FOV size ∼65 536 µm2. *P < .05 for SCD compared with control. #P < .05 for IV oxy-Hb compared with IV saline. Means in panels E,G compared using Student t test with Bonferroni correction. Percentages in panel F compared using fourfold table analyses with Bonferroni χ2 statistics. Means in panels H, J-K compared using Student t test. Data in panels E, G, H, J, and K represent mean ± standard error (SE). The diameter of pulmonary arteriole in panels C, D, L, M, and N is ∼28 µm, 26 µm, 14 µm, 14 µm, and 28 µm, respectively.
NETs embolize to the lung from other organs in SCD
Remarkably, intravital lung microscopy (experimental scheme in Figure 2A) revealed circulating NETs (cNETs) entering the lung microcirculation via the pulmonary arterioles in mice with SCD administered IV oxy-Hb (Figure 2B; supplemental Figure 6; supplemental Videos 8-9). Entrance of cNETs through the pulmonary arterioles suggested that cNETs could not be originating in the pulmonary circulation but were probably shed by neutrophils in a nonpulmonary vascular bed and then carried by the blood to the lung. Intravital microscopy images of 3 representative FOVs #1 (top row in Figure 2B; supplemental Video 8), #2 (bottom row in Figure 2B; supplemental Video 9), and #3 (supplemental Figure 6) at different time points show several cNETs (green; marked with dotted ellipses) entering the lung microcirculation (purple) via the pulmonary arterioles over few milliseconds in an SCD but not control mouse (supplemental Figure 7; supplemental Video 10) administered IV oxy-Hb. Time series of intravital microscopy images were quantified over several FOVs in the lung of 3 to 5 mice per group, to estimate the average number of cNETs entering per FOV of lung per minute, which was significantly higher in SCD than control mice administered IV saline (Figure 2C), mice with SCD administered IV oxy-Hb than IV saline (Figure 2D), and mice with SCD than control mice administered IV oxy-Hb (Figure 2E). Recently,33 we generated SCD-Selp−/− mice that genetically lack P-selectin in all tissues. Unexpectedly, the average number of cNETs entering per FOV of lung per minute was not significantly different between SCD and SCD-Selp−/− mice (Figure 2F), suggesting that shedding of cNETs in mice with SCD is P-selectin–independent. Next, we used imaging flow cytometry (experimental scheme in Figure 2G) to confirm whether cNETs in SCD mice blood were indeed NETs shed by neutrophils rather than DNA released by other cells. A representative imaging flow cytometry image (Figure 2H) shows a cNET as an extracellular DNA fragment positive for both neutrophil-elastase and citrullinated-histones (NETs markers), confirming that cNETs were indeed neutrophil-derived NETs. Identical to the intravital findings in Figure 2F, imaging flow cytometry also revealed that cNETs were not only abundant in plasma of mice with SCD administered IV oxy-Hb but also not significantly different from SCD-Selp−/− mice administered IV oxy-Hb (Figure 2I), thus again confirming the shedding of cNETs in mice with SCD to be P-selectin–independent. Identical to mice with SCD and consistent with a previous report,23 imaging flow cytometry (experimental scheme in Figure 2J) revealed that cNETs were also present in steady-state SCD patient blood (representative image in Figure 2K) and significantly more abundant than in control human blood (Figure 2L). The clinical characterization of human subjects is shown in Table 1. Cell-free oxy-Hb released following intravascular hemolysis undergoes oxidation in the vasculature in vivo to release the major DAMPs heme (ferrous protoporphyrin IX) and its oxidized form hemin (ferric protoporphyrin IX)4,5,17 that promote sterile inflammation and NETs generation.4,5,18 Thus, to more closely mimic the in vivo pathology, human blood samples were incubated with hemin instead of oxy-Hb in all in vitro studies to compensate for the absence of vasculature. Imaging flow cytometry revealed that in vitro incubation of SCD patient blood with hemin led to further (significant) increase in cNETs concentration (Figure 2M), suggesting that the inflammatory milieu (DAMPs) in SCD promotes shedding of cNETs.

Embolic NETs arrive in the lung from other organs, in a P-selectin–independent manner in SCD. (A) Experimental scheme used in panels B to E: Control, SCD, or SCD-Selp−/− mice were IV administered 10 µmol/kg oxy-Hb or saline, and qFILM was used to assess the absence or presence of cNETs within the pulmonary microcirculation. Pulmonary microcirculation (pseudo-colored purple), neutrophils (pseudo-colored red), and extracellular DNA (pseudo-colored green) were labeled in vivo by IV administration of FITC dextran, Pacific blue–anti-Ly6G Ab and Sytox orange, respectively. (B) Two representative qFILM FOVs (#1 and #2) showing several cNETs (green fragments marked with white circles) entering the lung microcirculation (purple) via the pulmonary arteriole at different time points in mice with SCD administered IV oxy-Hb. FOV#1 (top row): cNETs #1, #2, and #3 entered via the pulmonary arteriole (diameter ∼28 μm) at 0 seconds, cNETs #1, #2 left the FOV and #4, #5, #6 entered the FOV at 0.3 seconds, cNET #3 left the FOV at 0.6 seconds, cNETs #4, #5, #6 left the FOV, and #7, #8 entered the FOV at 0.7 seconds. FOV#2 (bottom row): cNETs #1, #2 entered the FOV via the pulmonary arteriole (diameter ∼24 μm) at 0 seconds, cNETs #3, #4 entered the FOV at 0.3 seconds, cNETs #1, #2, #3, #4 left the FOV and #5, #6, #7 entered the FOV at 0.9 seconds, cNETs #5, #6 left the FOV and #8 entered the FOV at 1.8 seconds. Time points are relative to the first frame shown at t = 0 seconds. Complete time series shown in supplemental Videos 8 and 9. White arrows denote the direction of blood flow within the pulmonary arterioles. Scale bars, 20 µm. (C-F) Number of cNETs entering per FOV over a 1-minute duration (#cNETs/FOV/min) were quantified using strategy described in supplemental Methods. (C) #cNETs/FOV/min were significantly more numerous in mice with SCD than control mice administered IV saline. #cNETs/FOV/min were significantly more numerous in mice with SCD administered IV oxy-Hb than (D) mice with SCD administered IV saline or (E) control mice administered IV oxy-Hb, but not different from (F) SCD-Selp−/− mice administered IV oxy-Hb. Control IV saline (n = 3 mice; 28 FOVs), SCD IV saline (n = 4 mice; 51 FOVs), SCD IV oxy-Hb (n = 4 mice; 44 FOVs), control IV Oxy-Hb (n = 4 mice, 43 FOVs), SCD-Selp−/− IV oxy-Hb (n = 5 mice; 71 FOVs). qFILM FOV size∼65 536 µm2. (G) Experimental scheme used in panels H to I: SCD or SCD-Selp−/− mice were IV administered 10 µmol/kg oxy-Hb; venous blood was processed to generate platelet poor plasma (PPP). PPP was incubated with Sytox green and fluorescent Abs against NE and citrullinated-histones (H3-Cit), and used for detection of cNETs by imaging flow cytometry as described in supplemental Methods. (H) A representative imaging flow cytometry image of a cNET in the blood of mice with SCD administered IV oxy-Hb. cNETs were identified as particles (<3 μm) triple-positive for NETs markers–extracellular DNA (green), NE (pseudo-colored yellow), and H3-Cit (pseudo-colored red). Scale bar, 3 µm. (I) Imaging flow cytometry data were quantified as described in supplemental Methods to estimate concentration of cNETs (#cNETs/μL of plasma). Plasma concentration of cNETs was not different between SCD and SCD-Selp−/− mice (n = 4 mice per group) administered IV oxy-Hb. (J) Experimental scheme used in panels K to M: control or SCD human blood with or without incubation with 20 μM hemin processed to generate PPP and cNETs detected using Imaging Flow Cytometry as in panel G. (K) A representative imaging flow cytometry image of a cNET in a patient’s blood with SCD. Scale bar, 3 µm. (L) The concentration of cNETs was significantly higher in untreated SCD (n = 7) than control (n = 3) human subjects’ blood. (M) Incubation with hemin significantly increased cNETs concentration in patients’ blood with SCD (n = 3). Straight line connects cNETs concentrations in the same patient’s blood with SCD pre- (blue circle) and post- (green circle) hemin treatment. Data in panels C-E, F, I, L represent mean ± SE and compared using Student t test. Data in panel M were compared using a paired Student t test. *P < .05.
Clinical characterization of human subjects
| Control | SCD | |
|---|---|---|
| Female/male | 6/1 | 6/7 |
| Age, y | 44.29 (44; 32; 64) | 40.17 (40; 27; 59) |
| Hemoglobin (g/dL) | 13.14 (14; 11.4; 14.4) | 9.03 (8.7; 6.9; 13.5)* |
| Hematocrit (%) | 39.83 (41.8; 34.3; 43.9) | 26.33 (25.5; 20; 38.4)* |
| White blood cells (K/µL) | 5.78 (4.5; 3.9; 8.2) | 8.84 (8.9; 3.2; 16.1) |
| Neutrophils (K/µL) | 3.01 (2.97; 0.81; 4.64) | 4.98 (4.29; 1.47; 11.67) |
| Lymphocytes (K/µL) | 1.81 (2.38; 0.35; 2.71) | 2.68 (2.45; 0.26; 5.5) |
| Monocytes (K/µL) | 0.39 (0.36; 0.09; 0.66) | 0.77 (0.72; 0.05; 1.61) |
| Platelets (K/µL) | 234.4 (256; 143; 316) | 354.8 (400; 113; 702) |
| % HbS | NM | 67.94 (65.4; 50.3; 87.8) |
| % HbF | NM | 14.85 (12.4; 1.4; 35.4) |
| Genotypes | ||
| AA | 7 | 0 |
| AS | 0 | 0 |
| SS | 0 | 12 |
| S/β0 | 0 | 1 |
| Hydroxyurea (Y/N) | NA | 7/6 |
Data show mean (median; minimum; maximum) except for the sex, genotype, and hydroxyurea status.
AA, healthy control; AS, sickle cell trait; HbF, fetal hemoglobin; HbS, hemoglobin S; N, no; NM, not measured; S/β0, sickle β0 thalassemia; SS, sickle cell anemia; Y, yes.
P < .05.
cNETs embolize from liver to lung in mice with SCD in vivo
The liver microcirculation is one of the primary sites for NETs generation by neutrophils during systemic inflammation,7,39,48,49 liver also serves as the sink for heme and hemoglobin released following intravascular hemolysis,3,17,29,48,50 both heme and hemoglobin are potent agonists of NETs generation,5,7,16,18,48 and recent findings show that liver is chronically inflamed in mice with SCD.27,29,51 Intravital liver microscopy40 (experimental scheme in Figure 3A) revealed that NETs identified as neutrophils (red) releasing extracellular DNA (green) were abundant in the liver microcirculation (purple) of mice with SCD administered IV oxy-Hb (Figure 3B) but not IV saline (supplemental Figure 8). Intravital images (Figure 3B) and corresponding videos (supplemental Videos 11-13) of 3 representative FOVs show numerous neutrophils releasing NETs (marked by dotted ellipse) in the liver microcirculation of mice with SCD administered IV oxy-Hb. Figure 3C shows intravital images of 4 individual neutrophils releasing NETs in the liver microcirculation of mice with SCD administered IV oxy-Hb. These findings were further validated by confocal microscopy of freshly isolated (unfixed) liver slices (Figure 3D; supplemental Figure 9) to identify NETs based on colocalization of extracellular DNA (green) with neutrophil-elastase (red) and neutrophils (white). As shown in the representative confocal images (Figure 3D) and the corresponding image analysis (Figure 3F), NETs were significantly more abundant in the liver of SCD than control mice administered IV oxy-Hb. Remarkably, intravital liver microscopy revealed shedding of NETs by neutrophils in the liver microcirculation of mice with SCD administered IV oxy-Hb (Figure 3E; supplemental Videos 14-15). In Figure 3E (top row), a fragment of ex-DNA (green; marked with dotted ellipse) can be seen detaching from the neutrophil (red) at t = 0.1 seconds and then disappearing into the liver microcirculation (purple) by t = 0.3 seconds. In Figure 3E (bottom row), several fragments of ex-DNA (green; marked with dotted ellipse) can be seen detaching from the neutrophil (red) at t = 0.07 seconds, and then disappearing into the liver microcirculation (purple) by t = 0.3 seconds. Compared with the liver, NETs were rare in the kidney microcirculation of mice with SCD administered IV oxy-Hb (Figure 3G; supplemental Figures 10-11; supplemental Video 16).
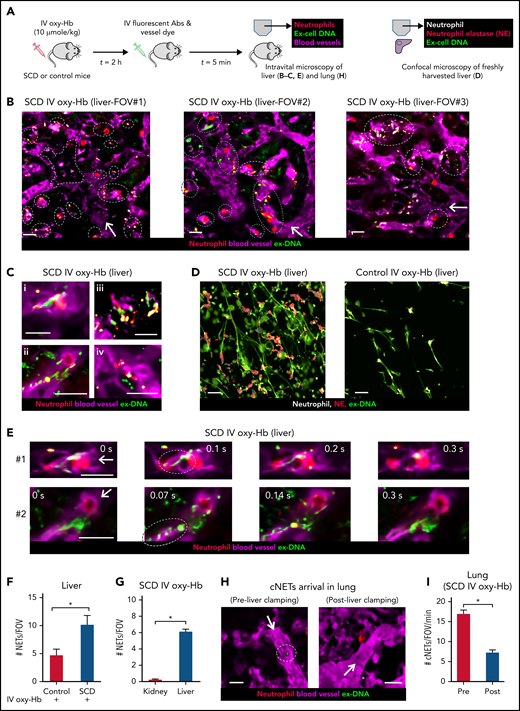
NETs are shed in the liver and then embolize to the lung as cNETs in SCD. (A) Experimental scheme: control mice or mice with SCD were IV administered 10 µmol/kg oxy-Hb or saline. Intravital fluorescence microscopy was used to assess the absence or presence of NETs within the liver (B,C,E) and lung (H) microcirculation. Microcirculation (pseudo-colored purple), neutrophils (pseudo-colored red), and extracellular DNA (pseudo-colored green) were labeled in vivo by IV administration of FITC or Texas-red dextran, Pacific blue–anti-Ly6G Ab and Sytox orange or green, respectively. Alternatively (D), freshly cut-unfixed slices of excised liver were stained in vitro for neutrophils (Pacific blue–anti-Ly6G Ab), extracellular DNA (Sytox green), and NE (AF546–anti-NE Ab), and confocal microscopy was used to identify NETs based on colocalization of DNA (green) with neutrophils (pseudo-colored white) and NE (red). Refer to supplemental methods for details. (B) Three representative liver intravital microscopy images (FOVs #1, #2, and #3) and the corresponding videos (supplemental Videos 11-13) reveal numerous NETs (marked with white dotted ellipses) and areas with impaired blood flow evident by slow transit of erythrocytes (dark cells) in the liver microcirculation of mice with SCD administered IV oxy-Hb. NETs were identified based on colocalization of neutrophil (red) and extracellular DNA (green). A vaso-occlusion evident by lack of vascular dye (purple) is marked with white dotted polygon in FOV#1. (C) Magnified intravital images of 4 different NETs in the liver microcirculation of mice with SCD administered IV Oxy-Hb. (D) Representative confocal micrographs reveal abundance of NETs (neutrophil-associated DNA strands positive for NE) in the liver of an SCD but rare in the liver of a control mouse administered IV Oxy-Hb. Neutrophils (pseudo-colored white), NE (red), and extracellular DNA (green). Colocalization of red and white appears pink. Individual channels shown in supplemental Figure 9. (E) Two separate time series of liver intravital images (#1, top row, and #2, bottom row) showing shedding of NETs in the liver microcirculation of mice with SCD administered IV oxy-Hb. (#1) A fragment of ex-DNA (green; marked with dotted ellipse) starts to detach from the neutrophil (red) at t = 0.1 seconds and disappears into the microcirculation (purple) by t = 0.3 seconds. (#2) Several fragments of ex-DNA (green; marked with dotted ellipse) detach from the neutrophil (red) at t = 0.07 seconds and disappear into the microcirculation (purple) by t = 0.3 seconds. Time points are relative to the first frame shown at t = 0 seconds. Complete times series #1 and #2 shown in supplemental Videos 14 and , respectively. (F) Confocal micrographs (representative example shown in panel D) were quantified to reveal significantly more #NETs/FOV in the liver of SCD than control mice administered IV oxy-Hb. n = 6 FOVs in each group. FOV size ∼144 400 µm2. (G) Liver and kidney intravital microscopy images were quantified to estimate number of NETs per FOV (#NETs/FOV). #NETs/FOV was significantly higher in the liver than kidney of mice with SCD administered IV Oxy-Hb. SCD IV Oxy-Hb kidney (n = 3 mice; 35 FOVs), SCD IV Oxy-Hb liver (n = 4 mice; 44 FOVs). (H-I) Intravital lung microcopy was used to assess the effect of simultaneously ligating the hepatic artery and portal vein (liver clamping), on the arrival of cNETs in the lung microcirculation of mice with SCD administered IV oxy-Hb. In qFILM FOVs from same mouse (panel H and supplemental Video 18), cNETs (green; marked with dotted white circle) are seen entering the pulmonary arteriole pre- but not postclamping of liver blood flow. More FOVs are shown in supplemental Figure 13; supplemental Videos 25 and . (I) Number of cNETs arriving in the lung per FOV over a 1-minute duration (#cNETs/FOV/min) were significantly reduced (threefold) following clamping of liver blood flow in mice with SCD administered IV oxy-Hb (n = 5 mice; 45 FOVs preclamp; 33 FOVs postclamp). Intravital microscopy FOV size ∼65 536 µm2. Scale bars, 20 µm. Data in panels F, G, and I represent mean ± SE and were compared using Student t test. *P < .05. Arrow denotes the direction of blood flow.
Stopping the liver blood flow prevents arrival of cNETs in the lung
We hypothesized that NETs shed by neutrophils in the liver embolize to the lung as cNETs. We assessed the effect of acutely interrupting the blood flow from the liver to the lung on the arrival of cNETs in the lung, by simultaneously ligating the hepatic artery and portal vein (strategy in supplemental Figure 12). As shown in supplemental Video 17, hepatic artery and portal vein ligation (liver clamping) led to blood stasis in the liver. Remarkably, following liver clamping, cNETs arriving in the lung of mice with SCD administered IV oxy-Hb were rare (Figure 3H; supplemental Figures 13A-C; supplemental Videos 18, 25, and 26) and significantly reduced (Figure 3I; supplemental Figure 13D).
Sterile inflammatory milieu in mice with SCD promotes activation of neutrophil-GSDMD
Interferon-α and -β (type I IFNs) signal through the heterodimeric IFNAR1/2 receptor in an autocrine or paracrine manner to promote downstream type I IFN signaling, which leads to upregulation of several IFN-stimulated genes.52,53 Recent evidence suggests that type I IFNs are significantly elevated at steady state (not in crisis) in the plasma of patients with SCD,54,55 leading to activation of type I IFN signaling in SCD patient neutrophils.54,56 We found a significant alteration in the transcript levels of several key components (marked by grey boxes in Figure 4B) of the type I IFN pathway in neutrophils isolated from the blood of SCD compared with control mice administered 10 µmol/kg IV oxy-Hb (experimental scheme in Figure 4A; purity in supplemental Figure 14). Compared with control mice neutrophils, SCD mice neutrophils manifested higher transcripts level of IFN-α (Ifna), IFN-β (Ifnb1), IFNAR1 (Ifnar1), and the major kinase Tyk2 (Tyk2) involved in the type 1 IFN signaling (Figure 4C-F). Transcript levels of caspase-11 (casp11), an IFN-stimulated gene known to be upregulated downstream of type 1 IFN signaling,24,57-59 were also significantly elevated in neutrophils of SCD compared with control mice administered IV oxy-Hb (Figure 4B,G). Recently, neutrophil-caspase-11 was shown to be activated (cleaved) following cytosolic invasion by gram-negative bacteria and then cleave pore-forming protein GSDMD into the GSDMD-NT,25 which triggered chromatin expansion, granule protein release, and extrusion of NETs following GSDMD-NT–mediated pore formation in nuclear, granule, and plasma membranes, respectively.25,26 Interestingly, transcript levels of both GSDMD and its transcriptional regulator IRF260 were also significantly elevated in neutrophils of SCD compared with control mice administered IV oxy-Hb (Figure 4B,H). Surprisingly, caspase-11 protein expression was undetectable in neutrophils of control mice but present in both uncleaved (45 kDa) and active-cleaved (20 and 25 kDa) state in neutrophils of mice with SCD administered IV oxy-Hb (Figure 4I-K). Similar to caspase-11, its substrate GSDMD was also undetectable in neutrophils of control mice but present in both uncleaved (50 kDa) and active (cleaved) GSDMD-NT (30 kDa) state in neutrophils of mice with SCD administered IV oxy-Hb (Figure 4L-N). GSDMD-NT was undetectable in neutrophils of both control and mice with SCD administered IV saline (supplemental Figure 16).

IFN-I signaling, caspase-11, and GSDMD are activated in neutrophils of mice with SCD. (A) Experimental scheme: control or mice with SCD were IV administered 10 µmol/kg oxy-Hb; venous blood was collected 3 hours later, and neutrophils were isolated from blood using a negative selection approach. Purity was confirmed (>98%) using flow cytometry, and neutrophils were used in messenger RNA (B-H) or western blot analysis (I-N). Refer to supplemental methods for details. (B) Heat map showing relative gene expression of the type I IFN-I pathway components, IFN-stimulated genes (ISGs) and NETs-related genes in SCD or control mice neutrophils. ISGs marked by grey squares are significantly altered between SCD and control mice. The data are presented as Log2-Fold change (relative expression) for 3 control and 3 mice with SCD. Each column reflects a single mouse. Significantly altered genes marked by asterisk in B. Log2-fold changes (relative expression) in panels (C) Ifna (IFN-α), (D) Ifnb1 (IFN-β), (E) Ifnar1 (IFN-α receptor 1 subunit), (F) Tyk2 (tyrosine kinase 2), (G) Casp11 (caspase-11), and (H) Gsdmd (GSDMD) genes were higher by several-fold in neutrophils of mice with SCD (n = 3) compared with control mice (n = 3) IV administered oxy-Hb. (I) Representative western blot micrograph showing presence of both uncleaved (45 kDa) and cleaved (20 and 25 kDa) caspase-11 in neutrophils of mice with SCD IV administered oxy-Hb. The expressions of both cleaved and uncleaved caspase-11 were below the detection limit in neutrophils of control mice IV administered oxy-Hb. (J-K) Densitometric analyses of western blot micrographs revealed significantly higher (J) uncleaved and (K) cleaved caspase-11 in neutrophils of SCD (n = 4) mice than control (n = 3) mice administered IV oxy-Hb. (L) Representative western blot micrograph showing presence of both uncleaved GSDMD (50 kDa) and cleaved GSDMD-NT (30 kDa) in neutrophils of mice with SCD IV administered oxy-Hb. The expressions of both GSDMD and GSDMD-NT were below the detection limit in neutrophils of control mice IV administered oxy-Hb. (M-N) Densitometric analyses of western blot micrographs revealed significantly higher (M) uncleaved GSDMD and (N) cleaved GSDMD-NT in neutrophils of SCD (n = 4) mice than control (n = 4) mice administered IV oxy-Hb. Data represent mean ± SE. *P < .05; **P < .01. Means compared using the Student t test. β-Tubulin (50 kDa) was the loading control protein. Uncropped images of western blot micrographs I and L shown in supplemental Figure 15A-B, respectively.
Oxidative stress promotes caspase-4–dependent activation of neutrophil-GSDMD in SCD
Next, SCD or control human subjects’ blood without or with incubation with hemin (± inhibitors) was used for isolation of neutrophils (experimental scheme in Figure 5A; purity in supplemental Figure 17). Identical to mice with SCD (Figure 4L), protein expression of uncleaved GSDMD was significantly higher in neutrophils isolated from SCD than control human blood without (Figure 5B-C) or with hemin-incubation (Figure 5B,D). GSDMD-NT was also significantly higher in neutrophils isolated from SCD than control human blood without (Figure 5B,E) or with hemin-incubation (Figure 5B,F). Similar to the effect on cNETs concentration (Figure 2M), incubation of SCD patient blood with hemin also led to further (significant) increase in GSDMD-NT expression in neutrophils (Figure 5B,G). Recently, heme was shown to promote caspase-4 (human ortholog of murine caspase-1124,57,58) -dependent cleavage of GSDMD in human macrophages.61 We found that the expression of caspase-4 was also significantly higher in neutrophils isolated from SCD than control human blood without (Figure 5H-I) or with hemin-incubation (Figure 5H,J). N-acetyl-l-cysteine (NAC) is an antioxidant,31 which was earlier shown to prevent heme-induced NETs generation by scavenging ROS.18 We found that caspase-4 was significantly reduced in neutrophils isolated from SCD patient blood incubated with both hemin and NAC compared with hemin alone (Figure 5H,K), suggesting a role for ROS in promoting caspase-4 expression in SCD patient neutrophils. Finally, GSDMD-NT expression was significantly reduced in neutrophils isolated from SCD patient blood incubated with hemin and caspase-4 inhibitor LEVD-CHO62 (Figure 5L-M) or hemin and NAC (Figure 5L,N) compared with hemin alone.
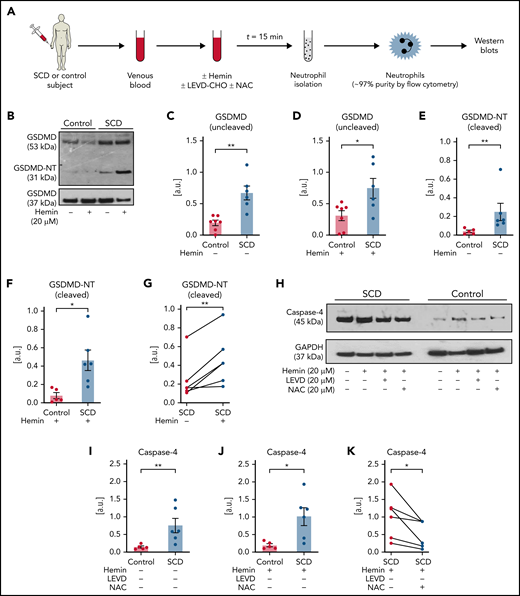
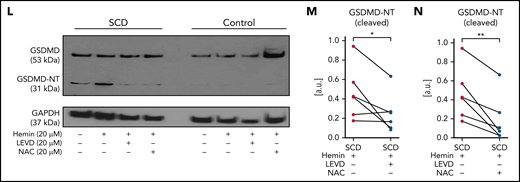
Inflammatory milieu in SCD promotes caspase-4–dependent activation of neutrophil-GSDMD. (A) Experimental scheme: control or SCD human blood with or without preincubation (15 minutes) with 20 μM hemin or 20 μM hemin + 20 μM caspase-4 inhibitor (LEVD-CHO) or 20 μM hemin + 20 μM antioxidant NAC was used for neutrophil isolation. Neutrophil purity was confirmed (∼97%) using flow cytometry, and neutrophils were used in western blot analysis. Refer to supplemental methods for details. (B) Representative western blot micrograph shows both uncleaved GSDMD (53 kDa) and the cleaved GSDMD-NT (31 kDa) present in patient neutrophils with SCD but only uncleaved GSDMD present in control human neutrophils. (C-G) Densitometric analyses of western blot micrographs (representative example shown in panel B) revealed significantly higher (C) GSDMD in neutrophils isolated from untreated SCD than control human blood, (D) GSDMD in neutrophils isolated from hemin treated SCD than control human blood, (E) GSDMD-NT in neutrophils isolated from untreated SCD than control human blood, (F) GSDMD-NT in neutrophils isolated from hemin treated SCD than control human blood, and (G) GSDMD-NT in neutrophils isolated from hemin-treated than untreated blood of same patients with SCD. Data representative of 7 control and 6 SCD human subjects (C, D), 5 control and 6 SCD human subjects (E, F), and 6 SCD human subjects (G). (H) Representative western blot micrograph and (I-K) densitometric analyses show significantly higher levels of caspase-4 (45 kDa) in neutrophils isolated from (I) untreated SCD than control human blood, (J) hemin-treated SCD than control human blood, and (K) hemin-treated than hemin + NAC-treated blood of same patients with SCD. Data representative of 5 control and 6 SCD human subjects (I-J) and 6 SCD human subjects (K). (L) Representative western blot micrograph and (M-N) densitometric analyses show significantly higher GSDMD-NT (31 kDa) in neutrophils isolated from (M) hemin-treated than hemin + LEVD-CHO–treated blood of same patients with SCD and (N) hemin-treated than hemin + NAC–treated blood of same patients with SCD. Data in panels M-N representative of 6 SCD human subjects. Pre- and posttreatment data point of each SCD human subject connected by a straight line in panels G, K, M, and N. Each data point in panels C-F and I-J represents a separate human subject. Mean ± SE shown in panels C-F and I-J compared using Student t test. Data in panels G, K, and M-N compared using paired Student t test. *P < .05; **P < .01. glyceraldehyde-3-phosphate dehydrogenase (GAPDH; 37 kDa) was used as the loading control. Uncropped images of western blot micrographs panels B, H, and L shown in supplemental Figures 18-20, respectively.
Activation of neutrophil-GSDMD promotes shedding of cNETs in SCD
SCD patient blood incubated with 20 μM hemin (± inhibitors) was used in imaging flow cytometry (experimental scheme in Figure 6A) for detection of cNETs. In vitro incubation of SCD patient blood with hemin in the presence of a GSDMD-NT inhibitor LDC755926 (Figure 6B) or caspase-4 inhibitor LEVD-CHO (Figure 6C) or antioxidant NAC (Figure 6D) led to significant reduction in cNETs concentration compared with incubation with hemin alone. Also, imaging flow cytometry (experimental scheme in Figure 6E) revealed significantly reduced cNETs concentration in the blood of mice with SCD IV administered 10 µmol/kg oxy-Hb with 10 mg/kg GSDMD-NT inhibitor (LDC7559) than mice with SCD IV administered 10 µmol/kg oxy-Hb alone (Figure 6F). Remarkably, imaging flow cytometry also revealed significant reduction in the cNETs concentration in the blood of SCD-Selp−/− mice IV administered 10 µmol/kg oxy-Hb with 10 mg/kg GSDMD-NT inhibitor (LDC7559) compared with SCD-Selp−/− mice IV administered 10 µmol/kg oxy-Hb alone (Figure 6G).

Neutrophil-GSDMD promotes liver-to-lung embolization of cNETs in SCD. (A) Experimental scheme used in panels B-D: SCD patient blood preincubated with 20 μM hemin with or without GSDMD inhibitor (LDC7559) or caspase-4 inhibitor (LEVD-CHO) or NAC, processed to generate PPP, PPP incubated with Sytox green and fluorescent Abs against NE and citrullinated histones (H3-Cit), and cNETs detected in PPP by imaging flow cytometry as described in Figure 2. Concentration of cNETs (#cNETs/μL of plasma) was significantly reduced in hemin-treated SCD patient blood following incubation with (B) 20 µM LDC7559 (n = 4 patients), (C) 20 µM LEVD-CHO (n = 5 patients), and (D) 20 µM NAC (n = 5 patients). Straight line connects cNETs concentrations in the same SCD patient blood pre- (red circle) and post- (blue circle) inhibitor treatment. (E) Experimental scheme used in panels F to O: SCD or SCD-Selp−/− mice and WT or Gsdmd−/− mice were IV administered 10 µmol/kg oxy-Hb (10 oxy-Hb) and 20 µmol/kg oxy-Hb (20 oxy-Hb), respectively, without or with 10 mg/kg GSDMD inhibitor (LDC7559) or 0.004 µmol/kg pan-caspase inhibitor (Z-VAD-FMK) or 20 mg/kg GSDMD inhibitor necrosulfonamide (NSA) or 10 mg/kg GSDMD inhibitor (disulfiram). In panels F-G, venous blood was processed to generate PPP and cNETs detected in PPP using imaging flow cytometry as in panel A. In panels H to O, microcirculation, neutrophils, and extracellular DNA were labeled in vivo by IV administration of FITC or Texas-red dextran, Pacific blue–anti-Ly6G Ab, and Sytox orange or green, respectively, and intravital fluorescence microscopy was used to assess the absence or presence of NETs within the liver (H-J) and lung (K-O) microcirculation. (F) Plasma concentration of cNETs was significantly less in mice with SCD IV administered 10 oxy-Hb + LDC7559 (n = 4 mice) than 10 oxy-Hb alone (n = 4 mice). (G) Plasma concentration of cNETs was significantly less in SCD-Selp−/− mice IV administered 10 oxy-Hb + LDC7559 (n = 4 mice) than 10 oxy-Hb alone (n = 4 mice). (H) Left, representative liver intravital microscopy image and supplemental Video 19 reveal numerous large NETs (marked with white ellipses) and areas with impaired blood flow evident by slow transit of erythrocytes (dark cells) in the liver microcirculation of a mouse with SCD administered IV 10 oxy-Hb. Right, representative liver intravital microscopy image and supplemental Video 20 reveal only a single small NET (marked with white ellipse) and significantly improved blood flow evident by rapidly transiting neutrophils (red) and erythrocytes (dark cells) in the liver microcirculation of a mouse with SCD administered IV 10 oxy-Hb + 10 mg/kg LDC7559. NETs were identified based on colocalization of neutrophil (pseudo-colored red) and extracellular DNA (green) in microcirculation (pseudo-colored purple). Scale bars, 20 µm. Arrow denotes the direction of blood flow. Liver intravital microscopy images were analyzed as in Figure 3 to estimate number of NETs per FOV (#NETs/FOV). (I) #NETs/FOV were significantly less (threefold) in the liver microcirculation of mice with SCD administered IV 10 oxy-Hb + LDC7559 (n = 4 mice; 42 FOVs) than 10 oxy-Hb alone (n = 4 mice; 44 FOVs). (J) #NETs/FOV were significantly less (fourfold) in the liver microcirculation of Gsdmd−/− (n = 4 mice; 35 FOVs) than littermate WT mice (n = 4 mice; 38 FOVs) administered IV 20 oxy-Hb. (K-O) Lung intravital microscopy images were analyzed as in Figure 2 to estimate number of cNETs entering per FOV in the lung over a 1-minute duration (#cNETs/FOV/min). #cNETs/FOV/min in the lung were significantly less in mice with SCD IV administered (K) 10 oxy-Hb + 0.004 µmol/kg Z-VAD-FMK (n = 4 mice; 51 FOVs), (L) 10 oxy-Hb + 10 mg/kg LDC7559 (n = 4 mice; 41 FOVs), and (M) 10 oxy-Hb + 20 mg/kg NSA (n = 3 mice; 38 FOVs) than 10 oxy-Hb alone (n = 4 mice; 44 FOVs). (N) #cNETs/FOV/min in the lung were significantly less in Gsdmd−/− (n = 3 mice; 29 FOVs) than littermate WT mice (n = 3 mice; 33 FOVs) IV administered 20 oxy-Hb. (O) #cNETs/FOV/min in the lung were significantly less (fourfold) in SCD-Selp−/− mice IV administered 10 oxy-Hb + LDC7559 (n = 3 mice; 35 FOVs) than 10 oxy-Hb alone (n = 5 mice; 71 FOVs). A similar effect of disulfiram on #cNETs/FOV/min in the lung of SCD-Selp−/− mice shown in supplemental Figure 22. Data in panels B to D compared using a paired Student t test. Data in panels F, G, and I to O represent mean ± SE and compared using Student t test. *P < .05. FOV size ∼65 536 µm2.
GSDMD-inhibition prevents liver to lung embolization of cNETs in mice with SCD in vivo
We hypothesized that reduction in plasma concentration of cNETs following GSDMD inhibition is secondary to reduced shedding of cNETs in the liver microcirculation. Therefore, we assessed the effect of GSDMD-NT inhibition (using 3 inhibitors: LDC7559,26 Necrosulfonamide,36 and Disulfiram37) or GSDMD deficiency (using Gsdmd−/− mice34) on NETs generation in the mice liver using intravital microscopy (experimental scheme in Figure 6E). As shown by the representative liver intravital images (Figure 6H), corresponding videos (supplemental Videos 19-20) and the image analysis (Figure 6I), NETs (marked by dotted ellipses) identified as neutrophils (red) releasing extracellular DNA (green), were significantly abundant in the liver microcirculation (purple) of mice with SCD administered 10 µmol/kg IV oxy-Hb but rare (only a single small NET visible in the Figure 6H, right panel) in the liver microcirculation (purple) of mice with SCD IV administered 10 µmol/kg oxy-Hb with 10 mg/kg GSDMD-NT inhibitor (LDC7559). IV administration of 10 µmol/kg oxy-Hb was innocuous to wild-type (WT) mice; however, twofold higher dose of IV oxy-Hb (20 µmol/kg) led to NETs generation in the liver microcirculation of WT mice as well, which was significantly attenuated in Gsdmd−/− mice (Figure 6J; supplemental Figure 21). Next, we hypothesized that attenuation of NETs generation in the liver after GSDMD inhibition or deletion would translate to fewer cNETs arriving in the lung. Indeed, intravital lung microscopy analyses (experimental scheme in Figure 6E) revealed several-fold (significantly) fewer cNETs entering per FOV per minute in the lung of mice with SCD IV administered 10 µmol/kg oxy-Hb with 0.004 µmol/kg pan-caspase inhibitor Z-VAD-FMK26 (Figure 6K) or 10 mg/kg GSDMD-NT inhibitor LDC7559 (Figure 6L) or 20 mg/kg GSDMD-NT inhibitor Necrosulfonamide36 (Figure 6M) than mice with SCD IV administered 10 µmol/kg oxy-Hb. Concomitant to reduced NETs generation in the Gsdmd−/− mice liver (Figure 6J), cNETs entering per FOV per minute in the lung were also significantly fewer in Gsdmd−/− than WT mice administered 20 µmol/kg IV oxy-Hb (Figure 6N). Remarkably, cNETs entering per FOV per minute in the lung were also fourfold fewer in SCD-Selp−/− mice IV administered 10 µmol/kg oxy-Hb with 10 mg/kg GSDMD-NT inhibitor (LDC7559 or disulfiram) than SCD-Selp−/− mice IV administered 10 µmol/kg oxy-Hb alone (Figure 6O; supplemental Figure 22).
GSDMD-inhibition prevents P-selectin–independent lung vaso-occlusion in mice with SCD in vivo
Next, intravital lung microscopy (experimental scheme in Figure 7A) was conducted in mice to assess whether preventing liver-to-lung embolization of cNETs by inhibiting or deleting GSDMD signaling leads to amelioration of pulmonary vaso-occlusion. Although large neutrophil-platelet aggregates (marked with dotted ellipses) were seen occluding the arteriolar bottlenecks, leading to impaired blood flow in the lung of mice with SCD IV administered 10 µmol/kg oxy-Hb (Figure 7B; supplemental Video 21), such aggregates were rare in the lung of mice with SCD IV administered 10 µmol/kg oxy-Hb with 0.004 µmol/kg pan-caspase inhibitor Z-VAD-FMK (Figure 7C; supplemental Video 22), or 10 mg/kg GSDMD-NT inhibitor LDC7559 (Figure 7D; supplemental Video 23), or 20 mg/kg GSDMD-NT inhibitor Necrosulfonamide (Figure 7E; supplemental Video 24). Erythrocytes (dark cells) were observed flowing unobstructed through the pulmonary arteriole and into the pulmonary capillaries, suggestive of the lack of pulmonary vaso-occlusion in mice with SCD IV administered oxy-Hb with Z-VAD-FMK (supplemental Video 22) or LDC7559 (supplemental Video 23) or Necrosulfonamide (supplemental Video 24). Concomitant to the reduction in number of cNETs arriving in the lung (Figure 6K-M), the number of pulmonary vaso-occlusions per FOV and the number of large pulmonary vaso-occlusions (area >1000 μm2) per FOV were also significantly reduced in mice with SCD IV administered oxy-Hb with Z-VAD-FMK (Figure 7F-G), LDC7559 (Figure 7H-I), or Necrosulfonamide (Figure 7J-K) than oxy-Hb alone. The twofold higher dose of 20 µmol/kg IV oxy-Hb also led to the development of lung vaso-occlusion in WT but not Gsdmd−/− mice (Figure 7L-M; supplemental Figure 23). Both the number of pulmonary vaso-occlusions per FOV (Figure 7L) and the large pulmonary vaso-occlusions (area >1000 μm2) per FOV (Figure 7M) were significantly less in Gsdmd−/− than WT mice administered 20 µmol/kg IV oxy-Hb. Identical to our previous report,33 P-selectin deficiency led to ∼50% reduction in pulmonary vaso-occlusion in SCD-Selp−/− mice administered 10 µmol/kg IV oxy-Hb (supplemental Figure 24); however, IV administration of oxy-Hb with the GSDMD-NT inhibitor (LDC7559 or disulfiram) led to a further threefold (significant) reduction in pulmonary vaso-occlusions per FOV (Figure 7N; supplemental Figure 25A; supplemental Figure 26) and absence of large pulmonary vaso-occlusions (area >1000 μm2) per FOV (Figure 7O; supplemental Figures 25B-26) in SCD-Selp−/− mice.
![Inhibiting the GSDMD pathway ameliorates P-selectin–independent lung vaso-occlusion in SCD. (A) Experimental scheme: SCD or SCD-Selp−/− mice and WT or Gsdmd−/− mice were IV administered 10 µmol/kg oxy-Hb (10 oxy-Hb) and 20 µmol/kg oxy-Hb (20 oxy-Hb), respectively, without or with 10 mg/kg GSDMD inhibitor (LDC7559) or 0.004 µmol/kg pan-caspase inhibitor (Z-VAD-FMK) or 20 mg/kg GSDMD inhibitor NSA or 10 mg/kg GSDMD inhibitor (disulfiram). qFILM was used to assess the absence or presence of platelet-neutrophil aggregate-mediated PVO. Pulmonary microcirculation (pseudo-colored purple), neutrophils (red), and platelets (pseudo-colored green) were labeled in vivo by IV administration of FITC dextran, AF546–anti-Ly6G Ab and V450–anti-CD49b Ab, respectively. Representative qFILM images are shown in panels B to E. (B) Representative qFILM image and supplemental Video 21 reveal 5 neutrophil-platelet aggregates (marked with dotted white ellipses) occluding pulmonary arteriole-bottleneck in the lung of a mouse with SCD IV administered 10 µmol/kg oxy-Hb (10 oxy-Hb). Representative qFILM images and corresponding videos reveal absence of lung vaso-occlusion and significantly improved blood flow (evident by rapidly transiting erythrocytes [dark cells]) in the lung of a mouse with SCD IV administered 10 oxy-Hb + Z-VAD-FMK (C; supplemental Video 22), 10 oxy-Hb + LDC7559 (D; supplemental Video 23), and 10 oxy-Hb + NSA (E; supplemental Video 24). White arrows denote the direction of blood flow within the pulmonary arterioles. Alveoli are marked with asterisks. Scale bars, 20 µm. The diameter of pulmonary arteriole in panels B to E is ∼22 µm, 32 µm, 31.5 µm, and 31 µm, respectively. (F-K) PVOs were compared between treatment groups using following 2 parameters: #PVOs/FOV and number of large PVOs (with area >1000 µm2) per FOV. Both #PVOs/FOV and #PVOs (with area >1000 µm2) per FOV were significantly less in mice with SCD IV administered (F,G) 10 oxy-Hb + Z-VAD-FMK (n = 4 mice; 51 FOVs) or (H,I) 10 oxy-Hb + LDC7559 (n = 4 mice; 41 FOVs) or (J,K) 10 oxy-Hb + NSA (n = 3 mice; 38 FOVs) than mice with SCD IV administered 10 oxy-Hb alone (n = 5 mice; 75 FOVs). Both (L) #PVOs/FOV and (M) #PVOs (with area >1000 µm2) per FOV were significantly less in Gsdmd−/− (n = 3 mice; 28 FOVs) than littermate WT mice (n = 3 mice; 31 FOVs) IV administered 20 oxy-Hb. (N) #PVOs/FOV were significantly reduced and (O) #PVOs (with area >1000 µm2) per FOV were absent in SCD-Selp−/− mice IV administered 10 oxy-Hb + LDC7559 (n = 3 mice; 35 FOVs) compared with SCD-Selp−/− mice IV administered 10 oxy-Hb alone (n = 5 mice; 69 FOVs). A similar effect of disulfiram on PVOs in SCD-Selp−/− mice shown in supplemental Figure 25. The data for mice with SCD IV administered 10 oxy-Hb (n = 5 mice; 75 FOVs) are included in panels N and O for relative comparison. qFILM FOV size ∼65 536 µm2. Data represent mean ± SE and are compared using Student t test. *P < .05. (P) Schematic showing the main findings of the study. The sterile inflammatory milieu (DAMPs, IFN-I signaling, and ROS) in SCD promotes caspase-4 (humans) or caspase-11 (mouse)-dependent cleavage of neutrophil GSDMD into the active form GSDMD-NT, leading to the shedding of NETs in the liver microcirculation. Once shed, these NETs are carried by the blood as cNETs to the lung, where they promote neutrophil-platelet aggregation in the pulmonary arterioles, leading to pulmonary vaso-occlusion and lung injury (acute chest syndrome).](https://ash.silverchair-cdn.com/ash/content_public/journal/blood/140/9/10.1182_blood.2021014552/3/m_bloodbld2021014552f7.png?Expires=1767710580&Signature=INCJzNcGHyFkwi5lybsG2jsBWkyj4cH0jk6J7eFgHW8HzuXvxUiNprqbOXKhR08xeJAFGouHbODjWdfboQSJYIgJccVt6bHfA~s5VY-dTZ43g~Wes0OKhKHC-5uRPHsodM8OE2RRTJnhroJr-G1gOoJKCyD7Ku6e62fiv~m5UX-E0YhjzHb0Ban6ZHwq5YH1b0kOiw6CMaV3vZ0TPbZQ1NNd6~DaRtjBUSX14lfeljol7y2OMQlLDa7B85JUqId-XPDWagtwQmryPjU1D3QAGaBt9DLPXK5MK~ghJwKdbp0aRFueoGbOHbkBrQ22wqzna8y6VJ~bzNlHCda0Xih9uw__&Key-Pair-Id=APKAIE5G5CRDK6RD3PGA)
Inhibiting the GSDMD pathway ameliorates P-selectin–independent lung vaso-occlusion in SCD. (A) Experimental scheme: SCD or SCD-Selp−/− mice and WT or Gsdmd−/− mice were IV administered 10 µmol/kg oxy-Hb (10 oxy-Hb) and 20 µmol/kg oxy-Hb (20 oxy-Hb), respectively, without or with 10 mg/kg GSDMD inhibitor (LDC7559) or 0.004 µmol/kg pan-caspase inhibitor (Z-VAD-FMK) or 20 mg/kg GSDMD inhibitor NSA or 10 mg/kg GSDMD inhibitor (disulfiram). qFILM was used to assess the absence or presence of platelet-neutrophil aggregate-mediated PVO. Pulmonary microcirculation (pseudo-colored purple), neutrophils (red), and platelets (pseudo-colored green) were labeled in vivo by IV administration of FITC dextran, AF546–anti-Ly6G Ab and V450–anti-CD49b Ab, respectively. Representative qFILM images are shown in panels B to E. (B) Representative qFILM image and supplemental Video 21 reveal 5 neutrophil-platelet aggregates (marked with dotted white ellipses) occluding pulmonary arteriole-bottleneck in the lung of a mouse with SCD IV administered 10 µmol/kg oxy-Hb (10 oxy-Hb). Representative qFILM images and corresponding videos reveal absence of lung vaso-occlusion and significantly improved blood flow (evident by rapidly transiting erythrocytes [dark cells]) in the lung of a mouse with SCD IV administered 10 oxy-Hb + Z-VAD-FMK (C; supplemental Video 22), 10 oxy-Hb + LDC7559 (D; supplemental Video 23), and 10 oxy-Hb + NSA (E; supplemental Video 24). White arrows denote the direction of blood flow within the pulmonary arterioles. Alveoli are marked with asterisks. Scale bars, 20 µm. The diameter of pulmonary arteriole in panels B to E is ∼22 µm, 32 µm, 31.5 µm, and 31 µm, respectively. (F-K) PVOs were compared between treatment groups using following 2 parameters: #PVOs/FOV and number of large PVOs (with area >1000 µm2) per FOV. Both #PVOs/FOV and #PVOs (with area >1000 µm2) per FOV were significantly less in mice with SCD IV administered (F,G) 10 oxy-Hb + Z-VAD-FMK (n = 4 mice; 51 FOVs) or (H,I) 10 oxy-Hb + LDC7559 (n = 4 mice; 41 FOVs) or (J,K) 10 oxy-Hb + NSA (n = 3 mice; 38 FOVs) than mice with SCD IV administered 10 oxy-Hb alone (n = 5 mice; 75 FOVs). Both (L) #PVOs/FOV and (M) #PVOs (with area >1000 µm2) per FOV were significantly less in Gsdmd−/− (n = 3 mice; 28 FOVs) than littermate WT mice (n = 3 mice; 31 FOVs) IV administered 20 oxy-Hb. (N) #PVOs/FOV were significantly reduced and (O) #PVOs (with area >1000 µm2) per FOV were absent in SCD-Selp−/− mice IV administered 10 oxy-Hb + LDC7559 (n = 3 mice; 35 FOVs) compared with SCD-Selp−/− mice IV administered 10 oxy-Hb alone (n = 5 mice; 69 FOVs). A similar effect of disulfiram on PVOs in SCD-Selp−/− mice shown in supplemental Figure 25. The data for mice with SCD IV administered 10 oxy-Hb (n = 5 mice; 75 FOVs) are included in panels N and O for relative comparison. qFILM FOV size ∼65 536 µm2. Data represent mean ± SE and are compared using Student t test. *P < .05. (P) Schematic showing the main findings of the study. The sterile inflammatory milieu (DAMPs, IFN-I signaling, and ROS) in SCD promotes caspase-4 (humans) or caspase-11 (mouse)-dependent cleavage of neutrophil GSDMD into the active form GSDMD-NT, leading to the shedding of NETs in the liver microcirculation. Once shed, these NETs are carried by the blood as cNETs to the lung, where they promote neutrophil-platelet aggregation in the pulmonary arterioles, leading to pulmonary vaso-occlusion and lung injury (acute chest syndrome).
Discussion
Cell-free oxy-Hb released during intravascular hemolysis is scavenged by plasma haptoglobin, which chaperones it to the liver, spleen, and bone marrow for clearance.1,3,17 However, SCD is associated with chronic depletion of haptoglobin, leading to impaired scavenging of cell-free oxy-Hb, which contributes to development of sterile inflammation in SCD.4,5,16 Based on this, mice with SCD were systemically (IV) challenged with oxy-Hb to trigger vaso-occlusive crisis.28,31 Intravital microscopy revealed that IV oxy-Hb promoted accumulation of NETs in the pulmonary arterioles and NETs-dependent lung vaso-occlusion by neutrophil-platelet aggregates, leading to development of lung injury in mice with SCD. To our surprise, these NETs were found to enter the lung via the pulmonary arterioles, suggesting that they originate in a nonpulmonary vascular bed. We found that these NETs were primarily shed by neutrophils in the liver microcirculation of mice with SCD and then transported by blood (as cNETs) to the lung, where they promoted lung vaso-occlusion. Indeed, cNETs were abundant in the peripheral blood of mice with SCD, and the levels were further elevated following challenge with IV oxy-Hb.
Interestingly, the type I IFN pathway was upregulated, and its downstream target caspase-11 and the caspase-11 substrate GSDMD were activated in neutrophils of mice with SCD given IV oxy-Hb. The cNETs were also abundant in SCD patient blood and further elevated following incubation with hemin, which was secondary to ROS and caspase-4–dependent activation of neutrophil-GSDMD. Inhibition of caspase-11 or GSDMD or absence of GSDMD prevented IV oxy-Hb–induced shedding of cNETs in the liver, their embolization to lung, and development of lung vaso-occlusion in SCD and Gsdmd−/− mice. Importantly, shedding of cNETs and their embolization to lung were not affected by the absence of P-selectin, but significantly prevented following GSDMD inhibition in SCD-Selp−/− mice given IV oxy-Hb. Finally, GSDMD inhibition completely abolished the remaining lung vaso-occlusion present in SCD-Selp−/− mice given IV oxy-Hb. Taken together, our current findings (Figure 7P) suggest for the first time that the sterile inflammatory milieu (DAMPs) in SCD promotes caspase-4/11–dependent activation of neutrophil-GSDMD, which leads to P-selectin–independent NETs generation in the liver. These NETs detach from parent neutrophils in the liver and then arrive as cNETs in the lung to promote occlusion of pulmonary arterioles by neutrophil-platelet aggregates. Most importantly, GSDMD inhibition also abrogates P-selectin–independent lung vaso-occlusion in SCD.
The interpretation of our findings is associated with a few limitations that may inspire further investigation in future studies. First, although we did not observe a significant increase in NE transcript levels in SCD than control mice neutrophils, new evidence suggests that NE released into the cytosol following GSDMD-NT–mediated permeabilization of azurophilic granules may also contribute to GSDMD cleavage via a feed-forward loop.26,63,64 Second, although our data demonstrate liver as a major source of cNETs arriving in the lung in SCD, contributions from other vascular beds including lung cannot be ruled out. Third, because of the technical limitations associated with intravital fluorescence microscopy, minor contribution of nonneutrophil DNA to cNETs cannot be ruled out. Fourth, GSDMD activation in cells other than neutrophils may also contribute to lung injury. Fifth, the effect of GSDMD inhibition on chronic organ injury in mice with SCD remains to be investigated in future studies. Sixth, the higher baseline GSDMD-NT expression in humans as compared with mice neutrophils is suggestive of the limitations associated with mice models.
Notwithstanding these limitations, our current findings introduce a novel paradigm that liver-to-lung translocation of DAMPs promotes lung injury in SCD and identify a new GSDMD-mediated, P-selectin–independent mechanism of lung vaso-occlusion in SCD. Despite recent advances in new therapies,15,65 acute chest syndrome continues to be a major cause of morbidity among hospitalized patients with SCD,3 but a pharmacological therapy to prevent its clinical onset still remains elusive.6 The current study is the first to highlight the therapeutic potential of a multitarget therapy of blocking both P-selectin and GSDMD-dependent events, to prevent the development of acute chest syndrome in high-risk patients with SCD hospitalized with painful vaso-occlusive episodes. We hypothesize that such a combined anti-inflammatory approach could significantly control vaso-occlusive painful episodes and secondary acute chest syndrome in patients with SCD.
Acknowledgments
This work was supported by National Institutes of Health (NIH), National Heart, Lung, and Blood Institute grants R01HL128297 (P.S.) and R01HL141080 (P.S.), American Heart Association 18TPA34170588 (P.S.), funds from the Hemophilia Center of Western Pennsylvania and Vitalant (P.S.) and NIH, National Institute of Diabetes and Digestive and Kidney Diseases 1K01DK125617-01 (T.P.-S.) and funds from the Hemophilia Center of Western Pennsylvania (T.P.-S.). The Nikon multiphoton excitation microscopes were funded by NIH grants S10RR028478 and S10OD025041. R.V. was supported by American Heart Association predoctoral fellowship 19PRE34430188. T.W.K. was supported by American Heart Association postdoctoral fellowship AHA828786. T.B. was supported by American Society of Hematology Postdoctoral Scholar Award and the Research Restart Award. Anti-mouse fibrin Ab (clone 59D8) was a gift from Rafal Pawlinski at University of North Carolina–Chapel Hill.
The visual abstract was created using BioRender software.
Authorship
Contribution: R.V. conducted intravital microscopy and imaging flow cytometry studies; T.W.K. conducted western blot and messenger RNA analyses; T.B. was involved in lung intravital microscopy studies; J.A.L. was involved in western blot analyses; E.T. and O.K. bred and genotyped all the transgenic mice used in this study; J.T. prepared oxy-Hb used in vivo mice studies; J.J. and E.M.N. provided blood samples from human subjects; T.P.-S. was involved in liver intravital and confocal microscopy studies; M.T.G. was involved in experimental design and manuscript writing; P.S. was responsible for experimental design, manuscript writing, and project supervision; and P.S., R.V., and T.W.K. wrote the manuscript with consultation and contribution from all coauthors.
Conflict-of-interest disclosure: P.S. receives funding (not relevant to the current study) as a part of sponsored research agreements with CSL Behring Inc, IHP Therapeutics, and Novartis Pharmaceuticals Corporation. P.S. is also the recipient of 2021 Bayer Hemophilia Award Program (not relevant to the current study). The remaining authors declare no competing financial interests.
Correspondence: Prithu Sundd, Division of Pulmonary, Allergy and Critical Care Medicine, Pittsburgh Heart, Lung and Blood Vascular Medicine Institute, University of Pittsburgh School of Medicine, BST E1255, 200 Lothrop St, Pittsburgh, PA 15261; e-mail: prs51@pitt.edu.
Requests for data may be made by contacting the corresponding author, Prithu Sundd, at prs51@pitt.edu.
The online version of this article contains a data supplement.
There is a Blood Commentary on this article in this issue.
The publication costs of this article were defrayed in part by page charge payment. Therefore, and solely to indicate this fact, this article is hereby marked “advertisement” in accordance with 18 USC section 1734.

This feature is available to Subscribers Only
Sign In or Create an Account Close Modal