

Key Points
Host T cells play a critical role in immune surveillance against ALL after chemotherapy.
Stimulating adaptive immune response can improve outcomes of ALL chemotherapy.

Abstract
Although acute lymphoblastic leukemia (ALL) is highly responsive to chemotherapy, it is unknown how or which host immune factors influence the long-term remission of this cancer. To this end, we systematically evaluated the effects of T-cell immunity on Ph+ ALL therapy outcomes. Using a murine Arf−/−BCR-ABL1 B-cell ALL model, we showed that loss of T cells in the host drastically increased leukemia relapse after dasatinib or cytotoxic chemotherapy. Although ABL1 mutations emerged early during dasatinib treatment in both immunocompetent and immunocompromised hosts, T-cell immunity was essential for suppressing the outgrowth of drug-resistant leukemia. Bulk and single-cell transcriptome profiling of T cells during therapy pointed to the activation of type 1 immunity-related cytokine signaling being linked to long-term leukemia remission in mice. Consistent with these observations, interferon γ and interleukin 12 directly modulated dasatinib antileukemia efficacy in vivo. Finally, we evaluated peripheral blood immune cell composition in 102 children with ALL during chemotherapy and observed a significant association of T-cell abundance with treatment outcomes. Together, these results suggest that T-cell immunity plays pivotal roles in maintaining long-term remission of ALL, highlighting that the interplay between host immunity and drug resistance can be harnessed to improve ALL chemotherapy outcomes.
Introduction
Acute lymphoblastic leukemia (ALL) is the most common cancer in children. Although a majority of children with ALL can be cured with risk-adapted combination chemotherapy, a substantial proportion of patients experience relapse and eventually die as a result of leukemia.1-3 The risk of relapse is often related to the lack of in vivo drug response, as measured by minimal residual disease. However, approximately half of patients eventually relapse despite having excellent treatment response initially.4 Therefore, long-term remission seems to be influenced by factors beyond ALL drug sensitivity, at least in some patients. In fact, inherited genetic variants in genes related to host immune functions have been linked to ALL prognosis,5-8 pointing to their potential contribution to long-term cure of this cancer.
In recent years, immunotherapies have gained increasing popularity in oncology,9-11 encompassing a variety of treatment approaches (eg, cancer vaccines, chimeric antigen receptor [CAR] T cells/T-cell receptor [TCR]–engineered T cells, and immune checkpoint blockade). Checkpoint inhibition strongly synergized with therapeutic vaccination and enhanced survival of mice bearing Arf−/−BCR-ABL B-cell ALL (B-ALL).12 The introduction of CAR T cells into the clinic has transformed the therapeutic landscape for refractory and relapsed B-cell hematologic malignancies, including B-ALL. CD19-targeted CARs have demonstrated remarkable response rates and produced durable remissions in very high-risk pediatric patient populations.13-16 Immunotherapeutic agents that generally stimulate immune responses (eg, interleukin 2 [IL-2], IL-7, IL-12, IL-21, and interferon α [IFN-α]) have also been studied as treatment for hematologic malignancies.17-20
One of the main objectives of immunotherapy is to induce or restore host immune responses against tumor cells.21 The mechanisms of host immune responses in solid tumors have been extensively studied, particularly in the context of immune cell infiltration and activation in the tumor microenvironment.22,23 In ALL mouse models, inoculation of leukemia cells elicits a robust immunosuppressive response in a majority of leukemia-recognizing T cells (ie, FOXP3+ regulatory T cells [Tregs]).24 In patients with ALL or chronic myeloid leukemia (CML), BCR-ABL1–specific T cells were readily detectable during remission after chemotherapy and could exert cytotoxic effects against leukemia cells in vitro.25-27 However, it remains unknown which host immune factors affect outcomes of ALL chemotherapy, or to what degree; the interplay between host immunity and chemotherapy resistance remains particularly unclear.
In this study, we used a murine Arf−/−BCR-ABL1 B-ALL mouse model to comprehensively dissect the role of T-cell immunity in ALL treatment response, emergence of drug resistance, and immune surveillance against residual leukemia. We globally profiled molecular features of host T cells associated with long-term ALL remission, particularly those related to type 1 immunity, and explored therapeutic strategies to improve immune response and chemotherapy outcomes in vivo. Finally, we determined host immune cell composition in patients with ALL and its prognostic impact. These findings establish the functional and mechanistic bases for host T-cell immunity in mediating long-term ALL remission.
Methods
Mouse model of Arf−/−BCR-ABL1 B-ALL
C57BL/6 (000664), Tcra-knockout (KO; B6.129S2-Tcratm1Mom/J, 002116), and Ifng-KO (B6.129S7-Ifngtm1Ts/J, 002287) mice were purchased from The Jackson Laboratory. All experiments were approved by and conducted in compliance with the protocol of the St. Jude Children’s Research Hospital Institutional Animal Care and Use Committee. Murine stem cell virus vector expression human BCR-ABL1 (encoding the p190 isoform) and green fluorescent protein (GFP) were used for transduction of bone marrow cells from 8-week-old female C57BL/6 Arf−/− mice.28 After 7 days of in vitro culture, the BCR-ABL1–transformed pre-B cells were injected into female recipient mice, giving rise to pre-B-ALL (supplemental Figure 1). Splenic cells were collected from moribund mice and used for subsequent experiments.
Leukemia inoculation and drug treatment
A total of 3000 Arf−/−BCR-ABL1 pre-B leukemic cells were inoculated into C56BL/6, Tcra-KO, or Ifng-KO mice by tail vein injection, without irradiation or other conditioning regimens. Mice were then given 2 weeks of Baytril (Bayer) in drinking water (6 mL in 350 mL). Dasatinib (D-3307; LC Laboratories) and dexamethasone (Mylan) treatment was started 14 days after leukemic cell injection, whereas mercaptopurine (6-MP) treatment was started on the 10th day. Dasatinib was administered by oral gavage at 10 mg/kg per dose in 80 mM of citric acid (pH, 3.1; M-CSS-162; JBScreen Single Stocks) twice daily.29 Dexamethasone was administered at 6 mg/L in drinking water for the first week and at 3 mg/L thereafter. Drinking water was changed twice a week. 6-MP was administered by intraperitoneal injection daily at 5 mg/kg per dose.30 Dasatinib and dexamethasone were given for 5 weeks, and 6-MP was given for 26 days. These regimens were established previously for this mouse model.29
Statistical analysis
Statistical analysis was performed by Student t, Wilcoxon, 1-way analysis of variance, or Kruskal-Wallis test using Prism-GraphPad (clarified in figure and table legends). The difference in survival was detected by log-rank (Mantel-Cox) test. The similarity of cell populations (ie, lymphocyte, granulocyte, and monocyte) detected by deconvolution analysis and monitored by complete blood count was analyzed by Pearson correlation coefficient.
We performed a series of mechanistic studies and molecular profiling experiments to characterize T-cell immunity related to antileukemia outcomes, and the details are provided in the data supplement. For example, BCR-ABL1–specific T cells were identified from peripheral blood after dasatinib treatment, using a CD4 major histocompatibility complex 2 multimer that recognizes BCR-ABL1 fusion in murine I-Ab. Global gene expression profiling was performed using Clariom S mouse arrays (902930; Thermo Fisher) on T cells prospectively collected during remission from mice who were later cured or relapsed. Similarly, single-cell RNA sequencing was also performed to define subpopulations within these T-cell samples, using the 10× Genomics Chromium Controller platform.
Results
Complete loss of T cells results in a drastic increase in ALL relapse in vivo
To examine the overall importance of the host immune system in leukemia treatment outcome, we injected murine Arf−/−BCR-ABL1 B-ALL cells (supplemental Figure 1) into immunocompetent (C57BL/6J [B6]) or immune-deficient mice (B6-Tcratm1Mom [Tcra-KO]). The Tcra-KO mice were devoid of both CD4 and CD8 T cells and thus lacked T-cell immunity. With dasatinib therapy, leukemia-bearing B6 mice showed an 82.4% increase in overall survival compared with Tcra-KO mice (Figure 1A-C), with a median survival of 67.5 and 37 days, respectively (P = .0028). The addition of dexamethasone to dasatinib prolonged the survival of both Tcra-KO and B6 mice, but the survival disadvantage of immunocompromised mice became more pronounced with this combination therapy (P = .0002; Figure 1D-F). Another commonly used ALL drug, 6-MP, also exhibited greater efficacy in B6 mice compared with Tcra-KO mice (P = .0291; Figure 1G-I).

Complete loss of T cells significantly increased leukemia relapse after ALL chemotherapies. (A,B,D,E,G,H) Leukemia burden is plotted as a function of time for B6 mice (blue curves) (A,D,G) and Tcra-KO mice (red curves) (B,E,H) after BCR-ABL1 leukemia cell inoculation. Animals were treated with dasatinib (A,B), dasatinib plus dexamethasone (D,E), or 6-MP (G,H). Shaded areas indicate the duration of chemotherapy. (C,F,I) Kaplan-Meier survival curves are plotted for immunocompetent B6 and Tcra-KO mice treated with dasatinib (C), dasatinib plus dexamethasone (F), or 6-MP (I). Dasatinib was administered at 10 mg/kg 2 times per day; dexamethasone was administered at 6 mg/L in drinking water for the first week and reduced to 3 mg/L thereafter; 6-MP was administered by daily intraperitoneal injection at 5 mg/kg. The differences in overall survival were detected by log-rank (Mantel-Cox) test. Of 9 immunocompetent mice receiving 6-MP, 5 were euthanized because of overall health concerns identified by the St. Jude Children’s Research Hospital Institutional Animal Care and Use Committee, at which time leukemia blast was undetectable in peripheral blood, and spleen size was normal by visual inspection. Therefore, their causes of death were likely unrelated to leukemia.
Complete loss of T cells significantly increased leukemia relapse after ALL chemotherapies. (A,B,D,E,G,H) Leukemia burden is plotted as a function of time for B6 mice (blue curves) (A,D,G) and Tcra-KO mice (red curves) (B,E,H) after BCR-ABL1 leukemia cell inoculation. Animals were treated with dasatinib (A,B), dasatinib plus dexamethasone (D,E), or 6-MP (G,H). Shaded areas indicate the duration of chemotherapy. (C,F,I) Kaplan-Meier survival curves are plotted for immunocompetent B6 and Tcra-KO mice treated with dasatinib (C), dasatinib plus dexamethasone (F), or 6-MP (I). Dasatinib was administered at 10 mg/kg 2 times per day; dexamethasone was administered at 6 mg/L in drinking water for the first week and reduced to 3 mg/L thereafter; 6-MP was administered by daily intraperitoneal injection at 5 mg/kg. The differences in overall survival were detected by log-rank (Mantel-Cox) test. Of 9 immunocompetent mice receiving 6-MP, 5 were euthanized because of overall health concerns identified by the St. Jude Children’s Research Hospital Institutional Animal Care and Use Committee, at which time leukemia blast was undetectable in peripheral blood, and spleen size was normal by visual inspection. Therefore, their causes of death were likely unrelated to leukemia.
There was a moderate difference in leukemia progression between B6 and Tcra-KO hosts before therapy (supplemental Figure 2A), although with no effects on survival without chemotherapy (supplemental Figure 2B). Taken together, these results unequivocally indicate that loss of T cells significantly reduces treatment efficacy across different ALL chemotherapies.
CD4 or CD8 T-cell depletion leads to increased ALL relapse with dasatinib treatment
To assess the contribution of CD4 or CD8 T cells to dasatinib efficacy, we depleted each population using specific antibodies (Figure 2A). Both antibodies efficiently removed respective T-cell subsets (Figure 2B) but did not affect leukemia burden when dasatinib therapy was initiated (Figure 2C). However, compared with the isotype control treatment group, nearly all mice with CD4 or CD8 T-cell depletion (75.0% or 87.5%, respectively) relapsed during dasatinib treatment (Figure 2D-F). The median survival times for CD4- and CD8-depletion groups were 41.5 and 37 days, respectively, compared with 61.5 days for mice treated with the isotype control antibody (Figure 2G). Collectively, these data indicate that both CD4 and CD8 T cells substantially contribute to dasatinib antileukemia efficacy in vivo.

CD4 or CD8 T-cell depletion led to increased ALL relapse with dasatinib treatment. (A) Schematic plot shows the timeline of leukemia inoculation and treatment with dasatinib and anti-CD4 or anti-CD8 antibodies. (B) Flow cytometric analysis of CD4 or CD8 T-cell depletion after 3 days of antibody injection. We also confirmed CD4 and CD8 T-cell depletion once every week by flow cytometry (data not shown). (C) Leukemia burden was measured immediately before CD4 or CD8 antibody injection (ie, day 13 from leukemia inoculation). There was no significant difference in leukemia progression across 3 groups up to this time point. (D-F) Leukemia burden is plotted as a function of time for B6 mice treated with dasatinib, after CD4 T-cell (D) or CD8 T-cell (E) depletion, or without T-cell depletion (isotype antibody control) (F). Shaded areas indicate the duration of chemotherapy. (G) Kaplan-Meier survival curves of B6 mice treated with dasatinib or vehicle after CD4 or CD8 T-cell depletion. The differences in survival were detected by log-rank (Mantel-Cox) test. bid, twice per day; ns, not significant.
CD4 or CD8 T-cell depletion led to increased ALL relapse with dasatinib treatment. (A) Schematic plot shows the timeline of leukemia inoculation and treatment with dasatinib and anti-CD4 or anti-CD8 antibodies. (B) Flow cytometric analysis of CD4 or CD8 T-cell depletion after 3 days of antibody injection. We also confirmed CD4 and CD8 T-cell depletion once every week by flow cytometry (data not shown). (C) Leukemia burden was measured immediately before CD4 or CD8 antibody injection (ie, day 13 from leukemia inoculation). There was no significant difference in leukemia progression across 3 groups up to this time point. (D-F) Leukemia burden is plotted as a function of time for B6 mice treated with dasatinib, after CD4 T-cell (D) or CD8 T-cell (E) depletion, or without T-cell depletion (isotype antibody control) (F). Shaded areas indicate the duration of chemotherapy. (G) Kaplan-Meier survival curves of B6 mice treated with dasatinib or vehicle after CD4 or CD8 T-cell depletion. The differences in survival were detected by log-rank (Mantel-Cox) test. bid, twice per day; ns, not significant.
Host immune deficiency is linked to relapse in drug-resistant ALL
Because the emergence of BCR-ABL1 mutation T315I is the main driver of dasatinib resistance in Arf−/−BCR-ABL1 B-ALL,29,31 we next sought to examine the pattern of BCR-ABL1 mutations in the absence or presence of T-cell immunity. As shown in Figure 3A, of the immunocompetent B6 mice that experienced relapse, 71.4% relapsed with wild-type Arf−/−BCR-ABL1 B-ALL after the withdrawal of dasatinib (Figure 3B), and relapsed leukemia remained sensitive to dasatinib (Figure 3C). By contrast, 60.0%, 75.0%, and 80.0% of relapsed ALL in immunocompromised animals (Tcra-KO, CD4 T cell–depleted, and CD8 T cell–depleted mice) had T315I BCR-ABL1 (Figure 3A). Relapse occurred during dasatinib treatment (Figure 3B), and leukemia resistance to dasatinib was confirmed in vitro (Figure 3C). Only a minority of cases relapsed with leukemia harboring other mutations, including E255K and F317L.
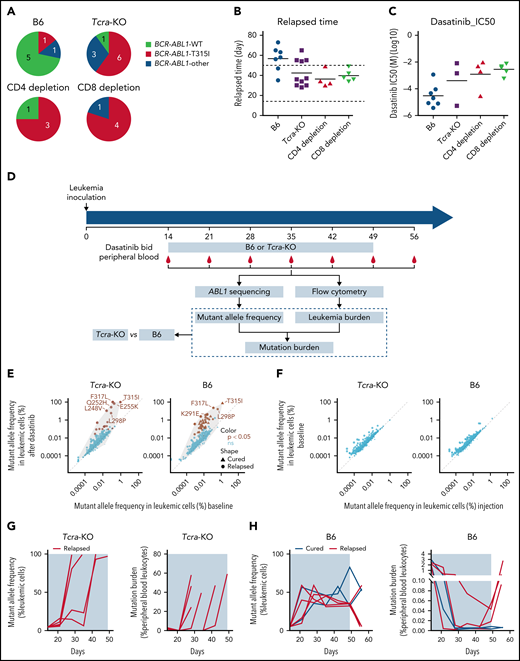
The rise in ABL1 mutations and dasatinib resistance in immunocompromised vs immunocompetent hosts. (A) The pie plot shows the number of mice relapsed with leukemia harboring wild-type (WT) or mutated BCR-ABL1 at the time of death; 71.4% of the relapsed immunocompetent mice had WT BCR-ABL1 B-ALL, whereas 60% to 80% of immunocompromised mice relapsed with leukemia harboring a drug-resistant BCR-ABL1 T315I mutation. (B) Immunocompromised mice relapsed much earlier than immunocompetent mice, mostly during dasatinib treatment (horizontal dash lines). (C) At relapse, ALL cells from immunocompetent hosts were more sensitive to dasatinib than those from immunocompromised mice in vitro. (D) Schematic representation of experimental design and analyses for detecting and tracking ABL1 mutations during dasatinib therapy. Dasatinib was administered at 10 mg/kg twice per day (bid). ABL1 sequence encoding the kinase domain was polymerase chain reaction amplified from genomic DNA extracted from peripheral blood and then subjected to Illumina sequencing. Leukemia burden was quantified by flow cytometry weekly. (E) BCR-ABL1 mutations were enriched shortly after dasatinib treatment was initiated relative to baseline (ie, day 14, immediately before dasatinib treatment) in both immunocompetent and Tcra-KO mice. Brown dots indicate mutations that increased in frequency during dasatinib treatment; x-axis shows the highest mutant allele frequency of each identified mutation in baseline samples, and y-axis shows the highest mutant allele frequency of each identified mutation during dasatinib treatment. (F) The frequency of ABL1 mutations was not related to leukemia growth in the absence of dasatinib treatment; x-axis shows the mutant allele frequency in leukemia samples before inoculation, and y-axis shows the highest mutant allele frequency of each identified mutation in leukemia cells immediately before dasatinib therapy was initiated. (G-H) Mutant allele frequency (left panel) and mutational burden (right panel) are plotted as functions of time in Tcra-KO mice (G) and B6 mice (H). IC50, 50% inhibitory concentration; ns, not significant.
The rise in ABL1 mutations and dasatinib resistance in immunocompromised vs immunocompetent hosts. (A) The pie plot shows the number of mice relapsed with leukemia harboring wild-type (WT) or mutated BCR-ABL1 at the time of death; 71.4% of the relapsed immunocompetent mice had WT BCR-ABL1 B-ALL, whereas 60% to 80% of immunocompromised mice relapsed with leukemia harboring a drug-resistant BCR-ABL1 T315I mutation. (B) Immunocompromised mice relapsed much earlier than immunocompetent mice, mostly during dasatinib treatment (horizontal dash lines). (C) At relapse, ALL cells from immunocompetent hosts were more sensitive to dasatinib than those from immunocompromised mice in vitro. (D) Schematic representation of experimental design and analyses for detecting and tracking ABL1 mutations during dasatinib therapy. Dasatinib was administered at 10 mg/kg twice per day (bid). ABL1 sequence encoding the kinase domain was polymerase chain reaction amplified from genomic DNA extracted from peripheral blood and then subjected to Illumina sequencing. Leukemia burden was quantified by flow cytometry weekly. (E) BCR-ABL1 mutations were enriched shortly after dasatinib treatment was initiated relative to baseline (ie, day 14, immediately before dasatinib treatment) in both immunocompetent and Tcra-KO mice. Brown dots indicate mutations that increased in frequency during dasatinib treatment; x-axis shows the highest mutant allele frequency of each identified mutation in baseline samples, and y-axis shows the highest mutant allele frequency of each identified mutation during dasatinib treatment. (F) The frequency of ABL1 mutations was not related to leukemia growth in the absence of dasatinib treatment; x-axis shows the mutant allele frequency in leukemia samples before inoculation, and y-axis shows the highest mutant allele frequency of each identified mutation in leukemia cells immediately before dasatinib therapy was initiated. (G-H) Mutant allele frequency (left panel) and mutational burden (right panel) are plotted as functions of time in Tcra-KO mice (G) and B6 mice (H). IC50, 50% inhibitory concentration; ns, not significant.
To characterize the rise of BCR-ABL1 mutations during therapy, we serially sampled peripheral blood in leukemia-bearing mice and performed Illumina sequencing at 3 000 000× to quantify mutational burden (Figure 3D). As shown in Figure 3E, the allele frequency of BCR-ABL1 mutations in leukemic cells generally increased upon dasatinib treatment compared with baseline in both Tcra-KO and B6 mice, and we observed similar results when dexamethasone was added to dasatinib treatment (supplemental Figure 3). By contrast, BCR-ABL1 mutation frequency in leukemia cells did not change significantly in the absence of therapy (Figure 3F), indicating a selection pressure by dasatinib.
In Tcra-KO mice, nearly all relapses occurred during dasatinib therapy. BCR-ABL1 mutations arose as early as 1 week after dasatinib treatment, and leukemias harboring drug resistance mutations quickly achieved exponential growth and gave rise to overt relapse (Figure 3G; supplemental Figure 4A). Two Tcra-KO mice showed a clonal shift of different BCR-ABL1 mutations (supplemental Figure 4B-C). In B6 mice, a variety of BCR-ABL1 mutations also emerged early during therapy, with 38 mutations enriched by dasatinib compared with baseline (supplemental Figure 5), with an average of 9 BCR-ABL1 mutations per case. However, the frequency of BCR-ABL1–mutated leukemic cells remained low, even after drug withdrawal (Figure 3H).
The ability of the immunocompetent host to suppress the growth of BCR-ABL1–mutated ALL strongly pointed to immune surveillance against leukemia independent of ALL sensitivity to dasatinib. To verify this, we rechallenged B6 mice that achieved long-term remission (ie, cured mice) with Arf−/−BCR-ABL1 B-ALL of wild-type and T315I-mutated backgrounds. As shown in supplemental Figure 6, none of these mice developed leukemia after leukemia rechallenge, suggesting that the host immune system had already gained the antileukemia memory during dasatinib treatment. We also rechallenged these cured mice with Arf−/−BCR-ABL1 leukemia cells labeled with luciferase. BCR-ABL1 luciferase+ leukemia emerged rapidly in naive mice; however, it did not appear in mice already cured after treatment of BCR-ABL1 GFP+ leukemia (supplemental Figure 7), suggesting that T-cell memory against leukemia was primarily mediated by the BCR-ABL1 neoantigen instead of GFP or luciferase. Moreover, we directly verified the presence of BCR-ABL1–specific CD4 T cells by the BAp:I-Ab tetramer, a CD4 major histocompatibility complex 2 multimer that recognizes BCR-ABL fusion in murine I-Ab24 (supplemental Figure 8). Collectively, these results indicate that neoantigen-specific T cells can effectively inhibit the outgrowth of drug-resistant leukemia, thus contributing to long-term remission.
Molecular features of T cells associated with immune surveillance against ALL
To explore the mechanisms underlying host immune response against ALL, we performed molecular profiling experiments in immunocompetent mice to compare features distinguishing those that did vs did not relapse after dasatinib therapy. To this end, we prospectively collected serum, T cells, and peripheral blood leukocytes 1 week after the initiation of dasatinib treatment from all mice. At that time, they were all in remission and then continued dasatinib treatment for 4 additional weeks. Mice were retrospectively classified as cured or relapsed based on their survival status at 100 days after leukemia inoculation (ie, the cured group and the relapsed group; Figure 4A). By focusing on normal T cells in mice during remission, this strategy enabled us to identify molecular features of the T cell–mediated immune response driving divergent chemotherapy outcomes, with minimal confounding effects of fluctuating leukemia burden on T-cell function.
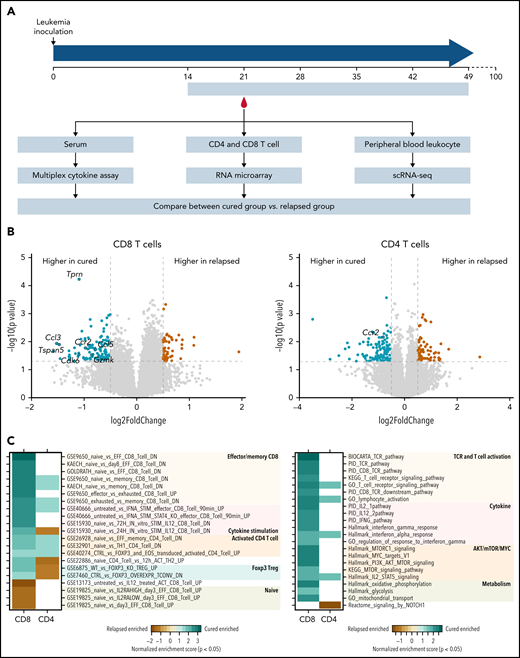
Memory and effector T-cell activation, TCR signaling, and IFN-γ/IL-12 signaling pathways were implicated in T-cell immunity against ALL relapse in mice. (A) The schema shows the design of molecular profiling experiments. Five-week dasatinib therapy was administered to B6 mice 2 weeks after leukemia cell inoculation. Mice that remained in remission after 100 days were considered cured (ie, the cured group). By contrast, mice that experienced relapse were labeled the relapsed group. Specimens from each group were subjected to 3 assays: (1) serum was collected after 1 week of dasatinib treatment and used for multiplex assay to quantify 23 cytokines (cured, n = 3; relapsed, n = 7); (2) peripheral blood was collected after 1 week of dasatinib treatment, CD4 or CD8 T cells were isolated using flow cytometry, and RNA was purified and used for microarray gene expression profiling (cured, n = 4; relapsed, n = 4); and (3) at this same time point, peripheral blood leukocytes were collected and subjected to single-cell RNA sequencing (scRNA-seq; cured, n = 6; relapsed, n = 6). (B) Volcano plot shows differentially expressed genes in CD8 T cells (left panel) or CD4 (right panel) T cells from mice in the cured vs relapsed group. Green indicates genes upregulated in the cured group, and brown highlights genes upregulated in relapsed mice. Gray dash lines indicate P = .05 (y-axis) and log2 (fold change) = ±0.5 (x-axis). (C) Heat map shows the gene sets enriched in T cells collected from the cured or relapsed group of mice. Analysis was performed for CD8 or CD4 T cells separately. Color indicates the degree of enrichment (normalized enrichment score), and blank means nominal P > .05.
Memory and effector T-cell activation, TCR signaling, and IFN-γ/IL-12 signaling pathways were implicated in T-cell immunity against ALL relapse in mice. (A) The schema shows the design of molecular profiling experiments. Five-week dasatinib therapy was administered to B6 mice 2 weeks after leukemia cell inoculation. Mice that remained in remission after 100 days were considered cured (ie, the cured group). By contrast, mice that experienced relapse were labeled the relapsed group. Specimens from each group were subjected to 3 assays: (1) serum was collected after 1 week of dasatinib treatment and used for multiplex assay to quantify 23 cytokines (cured, n = 3; relapsed, n = 7); (2) peripheral blood was collected after 1 week of dasatinib treatment, CD4 or CD8 T cells were isolated using flow cytometry, and RNA was purified and used for microarray gene expression profiling (cured, n = 4; relapsed, n = 4); and (3) at this same time point, peripheral blood leukocytes were collected and subjected to single-cell RNA sequencing (scRNA-seq; cured, n = 6; relapsed, n = 6). (B) Volcano plot shows differentially expressed genes in CD8 T cells (left panel) or CD4 (right panel) T cells from mice in the cured vs relapsed group. Green indicates genes upregulated in the cured group, and brown highlights genes upregulated in relapsed mice. Gray dash lines indicate P = .05 (y-axis) and log2 (fold change) = ±0.5 (x-axis). (C) Heat map shows the gene sets enriched in T cells collected from the cured or relapsed group of mice. Analysis was performed for CD8 or CD4 T cells separately. Color indicates the degree of enrichment (normalized enrichment score), and blank means nominal P > .05.
As shown in supplemental Figure 9, serum levels of IFN-γ, CCL5, and CCL4 were significantly higher in cured mice than in those that relapsed. Comparing the global transcriptional profile of CD8 T cells, we identified 58 genes upregulated in cells from the relapsed group and 136 genes upregulated in the cured group (Figure 4B, left panel; supplemental Tables 1 and 2). Gene set enrichment analysis (GSEA) using the ImmuneSigDB database of immunologic signatures32 showed that CD8 T cells from the relapsed group consistently expressed a naive T cell signature (Figure 4C, left panel; supplemental Table 3). In contrast, memory/effector signatures were enriched in genes upregulated in the cured group, including Gzmk, Gzma, S100a4, S100a6, Rora, Ccl5, Eomes, and Ccr2 (Figure 4C, left panel; supplemental Figure 10). The IL-12–stimulated gene signature was also enriched in cured mice (supplemental Figure 11). GSEA using Hallmark, PID, KEGG, and BIOCARTA gene sets identified TCR signaling, IFN-γ response, and IL12 pathway (Figure 4C, right panel; supplemental Figure 10; supplemental Table 3) as being upregulated in the cured group (Figure 4C, right panel). For CD4 T cells, there were 69 genes upregulated in the relapsed group and 117 in the cured group (Figure 4B, right panel). GSEA of C7 immunology gene sets showed that CD4 cells from the relapsed mice exhibited FOXP3 Treg expression signature (eg, downregulated in Foxp3−/− CD4 Tregs). In contrast, cells from cured mice showed signatures of activated CD4 T cells (eg, upregulated in memory or Th1 CD4 T cells relative to naive CD4 T cells; Figure 4C; supplemental Table 4).
Following the same study design, we next performed single-cell RNA sequencing of peripheral blood cells collected during remission from mice that later achieved long-term remission or eventually developed relapse (ie, the cured and relapsed groups; Figure 4A). We identified 7258 single cells from the relapsed group and 7578 single cells from the cured group (Figure 5A-C). These cells clustered into B cells, T cells, monocytes, natural killer (NK) cells, and macrophages, based on the expression of cell type–specific markers (supplemental Figure 12). The proportion of T cells was higher in peripheral blood from the cured mice than in the relapsed group (Figure 5D), especially for CD4 T cells as verified by flow cytometry (Figure 5E-F).

Single-cell RNA sequencing profiling of T-cell subpopulations in mice cured of or relapsed with BCR-ABL1 B-ALL after dasatinib therapy. (A,B) Uniform manifold approximation and projection (UMAP) visualization of 14 836 individual peripheral blood leukocytes collected from cured (7578 single cells) (A) and relapsed mice (7258 single cells) (B). (C) Each cell was classified into 1 of 5 immune cell types based on the expression of marker genes. (D) The difference in immune cell composition is shown as the percentage of peripheral blood leukocytes in cured mice relative to relapsed mice. (E,F) Flow cytometry of peripheral blood cells showed a higher proportion of CD3 (E) and CD4 (F) T cells in cured mice compared with relapsed animals. (G) Single-cell expression of marker genes of the T-cell population. Memory T-cell markers: Tcf7, Sell, Ccf7, and Il7r. Effector T-cell markers: Ifng, Gzma, Gzmb, and Pdcd1. NK T-cell markers: Klra1 and Xcl1. (H-J) UMAP visualization of T cells collected from cured and relapsed mice. Each cell was classified into 1 of 4 subpopulations based on the expression of marker genes; 4 subpopulations (H); distribution of cells from cured mice (green) and relapsed mice (brown) (I); T-cell distribution of 4 subpopulation in cured (left) or relapsed (right) groups, respectively (J). (K,L) To identify genes related to ALL cure, we compared gene expression profiles of T cells from cured mice vs relapsed mice and specifically focused on CD8 T1 cells (memory like) (K) and CD8 T2 cells (effector like) (L). Differentially expressed genes were analyzed for pathway enrichment using GSEA. The bar plot shows the normalized enrichment scores of gene sets.
Single-cell RNA sequencing profiling of T-cell subpopulations in mice cured of or relapsed with BCR-ABL1 B-ALL after dasatinib therapy. (A,B) Uniform manifold approximation and projection (UMAP) visualization of 14 836 individual peripheral blood leukocytes collected from cured (7578 single cells) (A) and relapsed mice (7258 single cells) (B). (C) Each cell was classified into 1 of 5 immune cell types based on the expression of marker genes. (D) The difference in immune cell composition is shown as the percentage of peripheral blood leukocytes in cured mice relative to relapsed mice. (E,F) Flow cytometry of peripheral blood cells showed a higher proportion of CD3 (E) and CD4 (F) T cells in cured mice compared with relapsed animals. (G) Single-cell expression of marker genes of the T-cell population. Memory T-cell markers: Tcf7, Sell, Ccf7, and Il7r. Effector T-cell markers: Ifng, Gzma, Gzmb, and Pdcd1. NK T-cell markers: Klra1 and Xcl1. (H-J) UMAP visualization of T cells collected from cured and relapsed mice. Each cell was classified into 1 of 4 subpopulations based on the expression of marker genes; 4 subpopulations (H); distribution of cells from cured mice (green) and relapsed mice (brown) (I); T-cell distribution of 4 subpopulation in cured (left) or relapsed (right) groups, respectively (J). (K,L) To identify genes related to ALL cure, we compared gene expression profiles of T cells from cured mice vs relapsed mice and specifically focused on CD8 T1 cells (memory like) (K) and CD8 T2 cells (effector like) (L). Differentially expressed genes were analyzed for pathway enrichment using GSEA. The bar plot shows the normalized enrichment scores of gene sets.
To characterize specific T-cell subpopulations that may influence chemotherapy efficacy, we identified 4 distinct T-cell populations: memory-like CD8 T cells (CD8-T1), effector-like CD8 T cells (CD8-T2), CD4 T cells, and NK T cells (Figure 5G-H). Within the T-cell compartment, there was a marked reduction in the NK T-cell population and an increase in CD4 T cells in cured compared with relapsed mice (NK T cells, 6.41% vs 12.25%; CD4 T cells, 20.64% vs 16.36%; supplemental Figure 13). Although there was no difference in the overall frequencies of the 2 CD8 T-cell subsets (CD8-T1 and CD8-T2; supplemental Figure 13), they exhibited a distinct distribution pattern on the uniform manifold approximation and projection plot between cured and relapsed mice (Figure 5I-J). Therefore, we further examined the gene expression profiles of these CD8 T-cell subsets in each group of mice. GSEA showed that genes highly expressed in CD8-T1 cells from the cured mice were enriched for TCR, IL-12, and IFN-γ signaling pathways, as well as for memory CD8 T-cell signature (ie, upregulated in memory CD8 T cells relative to naive CD8 T cells; Figure 5K; supplemental Table 5). The CD8-T2 population from the cured mice exhibited upregulation of genes in TCR and IFN-γ signaling pathways and was enriched for the effector T-cell signature (ie, downregulated in naive vs effector CD8 T cells; Figure 5L; supplemental Table 6).
Therefore, results from these molecular profiling studies, at both the bulk and single-cell levels, point to more robust T-cell responses (especially CD8 T cells) and expansion of CD4 T cells in cured mice vs relapsed mice that most likely occurred weeks before overt relapse.
IFN-γ and IL-12 strongly influence dasatinib efficacy in ALL
On the basis of both bulk and single-cell molecular profiling of T cells, we hypothesized that IL-12 and IFN-γ signaling are major determinants of successful immune surveillance against ALL. To test this experimentally, we first compared dasatinib therapy efficacy in leukemia-bearing mice of B6 or Ifng-KO background (supplemental Figure 14A). Ifng-KO mice showed a slightly faster leukemia progression than immunocompetent mice (Figure 6A; supplemental Figure 15), although this did not result in any difference in survival in the absence of chemotherapy (Figure 6B). With dasatinib therapy, the overall survival of Ifng-KO mice was significantly shorter than that of B6 mice (P < .0001; Figure 6B). In addition, most of the Ifng-KO mice (75.0%) relapsed with Arf−/−BCR-ABL1 B-ALL harboring a T315I mutation, and relapsed leukemia cells were tested ex vivo to confirm their dasatinib resistance (Figure 6C-D). In parallel, we also evaluated the effects of IL-12 on dasatinib treatment outcome in the murine Arf−/−BCR-ABL1 B-ALL model (supplemental Figure 14B). The combination of IL-12 and dasatinib significantly prolonged overall survival (P = .0011; Figure 6E-F). By comparison, IL-12 alone showed modest antileukemic efficacy (P = .0363), but all mice eventually died as a result of leukemia (Figure 6F). These data highlight the importance of type 1 immunity in host immune response during ALL chemotherapy.
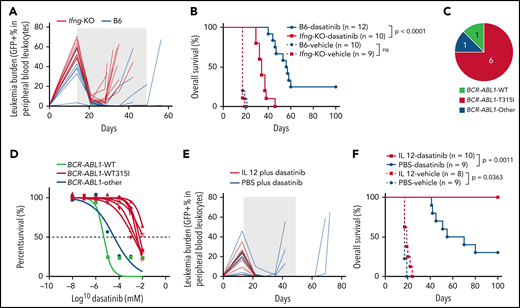
IFN-γ and IL-12 strongly influence dasatinib efficacy in ALL. (A) Leukemia burden is plotted as a function of time with dasatinib treatment for B6 or Ifng-KO mice. The shaded area indicates the duration of dasatinib treatment. (B) Kaplan-Meier survival curve of leukemia-bearing mice with dasatinib treatment or with vehicle control. (C) Most of the Ifng-KO mice relapsed with leukemia harboring a drug-resistant BCR-ABL1 T315I mutation. (D) The relapsed ALL cells from Ifng-KO mice showed acquired resistance to dasatinib in vitro. (E) Leukemia burden is plotted as a function of time for mice treated with dasatinib plus PBS or dasatinib plus IL-12. The shaded area indicates the duration of therapy. (F) Kaplan-Meier survival curve of leukemia-bearing mice treated with dasatinib/vehicle or dasatinib/vehicle plus IL-12. The difference in overall survival was detected by log-rank (Mantel-Cox) test. ns, not significant; PBS, phosphate-buffered saline; WT, wild type.
IFN-γ and IL-12 strongly influence dasatinib efficacy in ALL. (A) Leukemia burden is plotted as a function of time with dasatinib treatment for B6 or Ifng-KO mice. The shaded area indicates the duration of dasatinib treatment. (B) Kaplan-Meier survival curve of leukemia-bearing mice with dasatinib treatment or with vehicle control. (C) Most of the Ifng-KO mice relapsed with leukemia harboring a drug-resistant BCR-ABL1 T315I mutation. (D) The relapsed ALL cells from Ifng-KO mice showed acquired resistance to dasatinib in vitro. (E) Leukemia burden is plotted as a function of time for mice treated with dasatinib plus PBS or dasatinib plus IL-12. The shaded area indicates the duration of therapy. (F) Kaplan-Meier survival curve of leukemia-bearing mice treated with dasatinib/vehicle or dasatinib/vehicle plus IL-12. The difference in overall survival was detected by log-rank (Mantel-Cox) test. ns, not significant; PBS, phosphate-buffered saline; WT, wild type.
T-cell percentage is predictive of relapse-free survival in patients with ALL
To understand the clinical relevance of our findings, we sought to assess whether T-cell abundance was predictive of treatment outcome in children with ALL. To quantify immune cell composition, we applied a deconvolution algorithm to the gene expression profile of peripheral blood leukocytes collected at week 1 of consolidation therapy from 102 children with ALL in the St. Jude Total Therapy XV study (supplemental Table 7).33,34 Using expression signature for each immune cell population, we estimated the levels of B cells, T cells, NK cells, monocytes, macrophages, dendritic cells, mast cells, eosinophils, and neutrophils in each patient at this time point (Figure 7A). T cells and monocytes were the most abundant immune cells, accounting for 32.40% ± 1.33% and 29.23% ± 1.19% of all mononuclear cells, respectively. Dendritic cells and eosinophils were relatively uncommon (Figure 7A). There was no significant association of immune cell composition with patient age, sex, or race (Table 1). Lymphocyte level (T, B, and NK cells) inferred by the gene expression–based deconvolution method was highly correlated with actual lymphocyte count measured at this time point for these patients (R = 0.66; P = 9.1 × 10⁻¹⁴; Figure 7B), and this was also true for granulocytes and monocytes (granulocytes, R = 0.55; P = 5.4 × 10⁻⁹; monocytes, R = 0.40; P = 4.8 × 10⁻⁵; supplemental Figure 16), confirming the accuracy of deconvolution analysis.
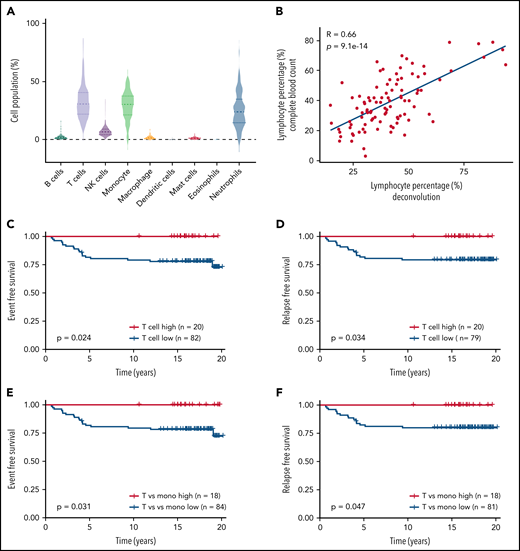
T-cell count during remission was associated with relapse-free survival in children with ALL. (A) The prevalence of different immune cell populations in patients with ALL during remission was inferred by applying the CIBERSORT deconvolution algorithm to the global gene expression profile of peripheral blood leukocytes collected in week 1 of consolidation therapy. The level of each type of immune cell was inferred on the basis of the expression of a panel of marker genes of this population. A total of 102 children with ALL from the St. Jude Total Therapy XV clinical trial32,33 with gene expression profiles available were included in this analysis. T cells, monocytes, and neutrophils accounted for the highest cell populations. (B) The expression-based estimates of lymphocyte level (B cells and T cells; x-axis) were highly correlated with actual lymphocyte count measured during routine complete blood count tests of these patients at this time point (y-axis). (C,D) Event-free survival (C) and relapse-free survival (D) of patients with ALL based on their T-cell levels during remission. Patients were classified as T-cell high vs low, using a cutoff of 0.42, with n indicating the number of patients. (E,F) Event-free survival (E) and relapse-free survival (F) of patients with ALL based on their T cell/monocyte ratio during remission. Patients were classified as T cell/monocyte ratio high vs low using a cutoff of 2, with n indicating the number of patients. The differences in survival were detected by log-rank (Mantel-Cox) test.
T-cell count during remission was associated with relapse-free survival in children with ALL. (A) The prevalence of different immune cell populations in patients with ALL during remission was inferred by applying the CIBERSORT deconvolution algorithm to the global gene expression profile of peripheral blood leukocytes collected in week 1 of consolidation therapy. The level of each type of immune cell was inferred on the basis of the expression of a panel of marker genes of this population. A total of 102 children with ALL from the St. Jude Total Therapy XV clinical trial32,33 with gene expression profiles available were included in this analysis. T cells, monocytes, and neutrophils accounted for the highest cell populations. (B) The expression-based estimates of lymphocyte level (B cells and T cells; x-axis) were highly correlated with actual lymphocyte count measured during routine complete blood count tests of these patients at this time point (y-axis). (C,D) Event-free survival (C) and relapse-free survival (D) of patients with ALL based on their T-cell levels during remission. Patients were classified as T-cell high vs low, using a cutoff of 0.42, with n indicating the number of patients. (E,F) Event-free survival (E) and relapse-free survival (F) of patients with ALL based on their T cell/monocyte ratio during remission. Patients were classified as T cell/monocyte ratio high vs low using a cutoff of 2, with n indicating the number of patients. The differences in survival were detected by log-rank (Mantel-Cox) test.
Proportion of each type of leukocyte in patients with different clinical characteristics
| B cells | T cells | NK cells | Monocytes | Macrophages | Dendritic cells | Mast cells | Eosinophils | Neutrophils | T cells vs monocytes | |
|---|---|---|---|---|---|---|---|---|---|---|
| Race | ||||||||||
| White | 2.56 ± 2.52 | 31.85 ± 14.31 | 6.95 ± 4.09 | 29.03 ± 12.13 | 1.98 ± 1.58 | 0.16 ± 0.26 | 1.26 ± 0.79 | 0.03 ± 0.17 | 25.93 ± 15.22 | 1.88 ± 3.23 |
| Black | 1.91 ± 1.21 | 33.61 ± 9.84 | 7.93 ± 4.72 | 30.04 ± 11.44 | 2.04 ± 1.64 | 0.39 ± 0.59 | 1.39 ± 1.01 | 0.00 ± 0.01 | 22.66 ± 12.05 | 1.42 ± 1.19 |
| Hispanic | 1.3 ± 0.74 | 27.81 ± 14.74 | 9.82 ± 7.99 | 26.6 ± 13.09 | 1.86 ± 1.4 | 0.08 ± 0.07 | 1.14 ± 0.83 | 0.00 ± 0.00 | 31.39 ± 18.72 | 1.86 ± 3.08 |
| Other | 1.99 ± 1.21 | 34.73 ± 15.01 | 6.06 ± 3.46 | 33.04 ± 11.81 | 1.13 ± 1.05 | 0.21 ± 0.38 | 1.34 ± 0.99 | 0.01 ± 0.03 | 21.5 ± 13.53 | 1.28 ± 1.11 |
| Subtype | ||||||||||
| B-ALL | 32.78 ± 13.8 | 2.15 ± 2.15 | 7.51 ± 5.13 | 28.57 ± 12.26 | 1.99 ± 1.58 | 0.21 ± 0.39 | 1.31 ± 0.88 | 0.02 ± 0.14 | 25.46 ± 15.55 | 1.86 ± 2.94 |
| T-ALL | 28.77 ± 11.87 | 2.60 ± 1.66 | 6.81 ± 2.31 | 34.01 ± 9.59 | 1.46 ± 1.20 | 0.18 ± 0.27 | 1.19 ± 0.75 | 0.00 ± 0.00 | 24.99 ± 11.61 | 0.98 ± 0.60 |
| Sex | ||||||||||
| Male | 2.15 ± 2.05 | 31.67 ± 12.27 | 7.52 ± 4.35 | 30 ± 11.45 | 1.7 ± 1.16 | 0.15 ± 0.24 | 1.16 ± 0.70 | 0.00 ± 0.01 | 25.64 ± 14.12 | 1.55 ± 2.43 |
| Female | 2.35 ± 2.14 | 32.76 ± 15.53 | 7.15 ± 5.42 | 28.74 ± 12.93 | 2.22 ± 1.99 | 0.29 ± 0.50 | 1.50 ± 1.04 | 0.04 ± 0.21 | 24.93 ± 16.28 | 2.00 ± 3.15 |
| Age, y | ||||||||||
| ≤10 | 2.39 ± 2.29 | 33.58 ± 13.86 | 7.25 ± 5.26 | 28.57 ± 11.89 | 1.73 ± 1.54 | 0.19 ± 0.38 | 1.30 ± 0.85 | 0.02 ± 0.15 | 24.95 ± 15.15 | 1.93 ± 3.04 |
| >10 | 1.71 ± 1.07 | 27.44 ± 11.41 | 7.79 ± 2.74 | 32.49 ± 11.98 | 2.40 ± 1.43 | 0.24 ± 0.34 | 1.24 ± 0.9 | 0.00 ± 0.00 | 26.69 ± 14.25 | 1.07 ± 1.12 |
Data are given as percentages. Student t test or Wilcoxon test (when the numbers were not normally distributed) was used for the difference in each cell population between different sexes (male vs female) and ages (≤10 vs >10 y); 1-way analysis of variance test or Kruskal-Wallis test (when the numbers were not normally distributed) was used for the difference in each cell population between different races.
Within this cohort, there was wide variability in the level of total T cells (the sum of CD4 and CD8 T cells; Figure 7B). We divided patients into 2 groups using a 42% T-cell population as the cutoff, which was derived from a model-based clustering analysis35 of the distribution of T-cell population across all samples (ie, low and high T-cell groups; supplemental Figure 17). The event-free survival of low and high T-cell count groups was 76.83% vs 100%, respectively (P = .024; Figure 7C; supplemental Figures 18-20). Even after adjusting for age, presenting leukocyte count, minimal residual disease at the end of induction, and treatment risk group as covariables, T-cell frequency remained prognostic (P = .0083; supplemental Table 8). The relapse-free survival of the 2 groups was 79.75% vs 100%, respectively (P = .034; Figure 7D; supplemental Figures 18-20). T-cell level was not associated with clinical features or ALL molecular subtype or other patient characteristics (supplemental Table 9). Moreover, T-cell absolute count had a minor but significant influence on event-free survival (P = .05; supplemental Figure 21). Because higher lymphocyte/monocyte ratio or lower monocyte percentage was associated with better survival in several types of cancers,36-39 including ALL,40 we further analyzed the association of the T cell/monocyte ratio (T-cell population divided by monocyte population) with treatment outcome. According to the ratio distribution, we used 2 as the cutoff (supplemental Figure 22). As shown in Figure 7E-F, a higher T cell/monocyte ratio was associated with better event-free survival (P = .031) and relapse-free survival (P = .047). These results indicate the prognostic impact of T-cell immunity in children with ALL.
Discussion
The interplay between host immunity and tumor has an essential role in cancer pathogenesis and prognosis.41-43 In this study, we investigated the role of T-cell immunity in chemotherapy outcomes in ALL. Loss of either CD4 or CD8 T cells resulted in a drastic increase in leukemia relapse, mostly as a result of the emergence of drug resistance. Additional molecular profiling studies demonstrated that IL-12 and IFN-γ signaling were crucial regulators of T-cell immunity against ALL, and T-cell percentage during remission was predictive of ALL relapse in patients. These findings establish the role of host immunity in the cure of ALL and point to stimulating T-cell function as a means of improving outcomes with ALL chemotherapy.
Drug-resistant ABL1 mutations can develop when ABL inhibitors are used as monotherapy for ALL or CML.44,45 Our data presented here suggest that these mutations arise randomly even in the absence of dasatinib, although those conferring drug resistance became significantly enriched once therapy started. These rare ALL clones occurred in both immunocompetent and immunocompromised hosts. Without T-cell immunity, drug-resistant ALL grew out and resulted in relapse, whereas disease was contained in immunocompetent mice. These results indicate that robust host immune surveillance can control the outgrowth of drug-resistant leukemia, although the emergence of BCR-ABL1 mutation is almost inevitable. It is unclear whether T-cell reaction differs against wild-type vs T315I BCR-ABL1 leukemia. However, stronger immunity against drug-resistant leukemia would be beneficial to long-term survival, and this should be examined in future studies. Dasatinib resistance can also be overcome by more potent inhibitors such as ponatinib46 or through combination with cytotoxic agents that indiscriminately kill leukemia cells (even in those with the ABL1 T315I mutation). However, a significant proportion of patients still relapse after ponatinib or dasatinib treatment, even if combined with chemotherapy.47,48 This plausibly reflects the failure to establish or subsequent loss of host immunosurveillance against leukemia. We posit that host immune response may generally be operative in governing long-term cure of ALL regardless of the type of pharmacotherapy used. In CML, up to 40% of patients can maintain clinical remission without continuous exposure to an ABL inhibitor, although whether this is linked to their BCR-ABL1–directed T-cell immunity remains unclear.49,50 Therefore, inducing and maintaining host immune reaction to leukemia may be much more effective in preventing relapse than further intensifying the chemotherapy used in contemporary treatment regimens. Interestingly, the outcome difference between immunocompetent vs immunodeficient mice became even more pronounced when dexamethasone was added to dasatinib (Figure 1F). This combination therapy may rapidly debulk leukemia and release neoantigens to be recognized by host immune systems, despite the immunosuppressive effects of glucocorticoids (supplemental Figure 23).
A recent study examined neoantigens in pediatric ALL and experimentally demonstrated that CD8 T cells in patients with ALL can readily mount an immune response to fusion proteins such as ETV6-RUNX1.51 In the current study, we also confirmed the presence of BCR-ABL1–specific CD4 T cells using tetramer staining,24 and immunocompetent mice cured of ALL subsequently developed immunity against the same leukemia. It is plausible that host T cells also develop immunity against other leukemia antigens besides BCR-ABL1. For example, WT1, a well-established target for cancer immunotherapy, is directly upregulated by BCR-ABL1 in ALL.52-54 We reason that the overall antileukemic efficacy of dasatinib therapy derives from several processes: (1) direct cytotoxic effects of dasatinib on Arf−/−BCR-ABL1 B-ALL and (2) tumor-specific neoantigens released upon leukemia cell death from dead cells to elicit T-cell response, which can lead to immune surveillance against residual leukemia to prevent relapse. On the other hand, ALL drugs can also directly influence host immunity because of their immunosuppressive activities (eg, glucocorticoids).55,56 The effects of ALL drugs on leukemia and the host are ineluctably intertwined, and the intricate relationship between the 2 ultimately determines the outcome of ALL therapy.
Our results point to an essential role of IL-12 in host immune surveillance. In fact, IL-12 showed robust antitumor activity in preclinical studies of solid tumors with immune-stimulating potential. However, direct administration of IL-12 has proven exceedingly toxic, limiting its clinical use.57,58 Recent reports of CAR T cells modified to constitutively secrete IL-12 showed improved antitumor effects,59,60 suggesting more sophisticated approaches to incorporate IL-12 into immunotherapy.61,62
Our study is not without limitations, including the murine Arf−/−BCR-ABL1 B-ALL model. There are several advantages to this model, including its syngeneic nature and thus suitability for studying host immunity, its efficiency and reproducibility in establishing leukemia in vivo, and its well-characterized response to several antileukemic agents. However, because the retroviral BCR-ABL1 construct also encodes other xenogeneic proteins (eg, GFP) and possibly components of viral proteins, it is plausibly much more immunogenic than the ALL naturally arising in patients. Consequently, our model might have given rise to an outsized effect of host immunity on leukemia treatment outcome than what would be expected in patients with ALL. However, it is also likely that there is wide variability in immunogenicity across ALL subtypes (or even individual cases), and a direct comparison in this regard between mouse and human is challenging. Future studies using a gene-edited mouse model of the humanized nonobese diabetic/severe combined immunodeficiency γ mouse model might be needed to more precisely define the role of T-cell immunity in ALL therapy.
In summary, our findings provide novel insights into the mechanisms by which host factors influence the success of ALL therapy and point to potential therapeutic strategies to further improve the cure rate in this aggressive cancer.
Acknowledgments
The authors thank the Hartwell Center for Bioinformatics and Biotechnology, the Flow Cytometry and Cell Sorting Core, the Animal Research Center, and the Center for In Vivo Imaging and Therapeutics of St. Jude Children’s Research Hospital for their technical support in performing experiments included in this study. The authors thank the National Institutes of Health Tetramer Core Facility for supplying the BAp:I-Ab tetramer PE and CLIP-PE and tetramer. The authors are grateful to Mary Relling for sharing the ALL patient gene expression data set (PLoS One. 2008;3(5):e2144), Wentao Yang for assistance in the BCR-ABL1 mutation analysis, and Yanyan Wang for guidance in the T-cell depletion studies, all from St. Jude Children’s Research Hospital.
This work was supported in part by National Institutes of Health grants P50GM115279 (National Institute of General Medical Sciences) P30CA21765 (National Cancer Institute), and U01CA264610 (National Cancer Institute), and by the American Lebanese Syrian Associated Charities.
Authorship
Contribution: J.J.Y. and H.C. initiated and led the project; J.J.Y., H.C., and Y.L. designed the experiments; Y.L. performed in vivo experiments; X.Y. analyzed the single-cell RNA sequencing (scRNA-seq data) and performed patient sample deconvolution analysis; Y.S. analyzed the scRNA-seq data; Z.L. analyzed the BCR-ABL1 mutation sequencing data; D.P., Y.L., W.Y., and C.C. performed survival analysis; B.J. and J.E. performed scRNA-seq; W.Y. interpreted the data; C.-H.P., H.C., S.L., and J.Y. provided relevant intellectual input and edited the manuscript; and J.Y. and Y.L. wrote the manuscript. All authors reviewed and commented on the manuscript.
Conflict-of-interest disclosure: The authors declare no competing financial interests.
Correspondence: Jun J. Yang, Department of Pharmacy and Pharmaceutical Sciences, Department of Oncology, St. Jude Children's Research Hospital, MS313, 262 Danny Thomas Place, Memphis, TN 38105-3678; e-mail: jun.yang@stjude.org; Yizhen Li, Department of Pharmacy and Pharmaceutical Sciences, St. Jude Children's Research Hospital, MS313, 262 Danny Thomas Place, Memphis, TN 38105-3678; e-mail: yizhen.li@stjude.org.
The online version of this article contains a data supplement.
There is a Blood Commentary on this article in this issue.
The publication costs of this article were defrayed in part by page charge payment. Therefore, and solely to indicate this fact, this article is hereby marked “advertisement” in accordance with 18 USC section 1734.

This feature is available to Subscribers Only
Sign In or Create an Account Close Modal