

Key points
VIP produced by pDCs in donor BM allografts suppresses GVHD in allogeneic BM transplants.
Transplanting VIP KO pDCs led to greater T-cell expansion, Th1 polarization, proinflammatory cytokines than wild-type pDCs.

Abstract
Vasoactive intestinal polypeptide (VIP), an anti-inflammatory neuropeptide with pleiotropic cardiovascular effects, induces differentiation of hematopoietic stem cells into regulatory dendritic cells that limit graft-versus-host disease (GVHD) in allogeneic hematopoietic stem cell transplant (HSCT) recipients. We have previously shown that donor plasmacytoid dendritic cells (pDCs) in bone marrow (BM) donor grafts limit the pathogenesis of GVHD. In this current study we show that murine and human pDCs express VIP, and that VIP-expressing pDCs limit T-cell activation and expansion using both in vivo and in vitro model systems. Using T cells or pDCs from transgenic luciferase+ donors in murine bone marrow transplantation (BMT), we show similar homing patterns of donor pDCs and T cells to the major sites for alloactivation of donor T cells: spleen and gut. Cotransplanting VIP-knockout (KO) pDCs with hematopoietic stem cells and T cells in major histocompatibility complex mismatched allogeneic BMT led to lower survival, higher GVHD scores, and more colon crypt cell apoptosis than transplanting wild-type pDCs. BMT recipients of VIP-KO pDCs had more T helper 1 polarized T cells, and higher plasma levels of granulocyte-macrophage colony-stimulating factor and tumor necrosis factor-α than recipients of wild-type pDCs. T cells from VIP-KO pDC recipients had increasing levels of bhlhe40 transcripts during the first 2 weeks posttransplant, and higher levels of CyclophilinA/Ppia transcripts at day 15 compared with T cells from recipients of wild-type pDCs. Collectively, these data indicate paracrine VIP synthesis by donor pDCs limits pathogenic T-cell inflammation, supporting a novel mechanism by which donor immune cells regulate T-cell activation and GVHD in allogeneic BMT.
Introduction
Donor immune cells play critical roles in posttransplant immunity after allogeneic hematopoietic stem cell transplantation (allo-HSCT). Donor T cells in the graft facilitate donor stem cell engraftment, mediate the graft-versus-leukemia (GVL) and graft-versus-tumor (GVT) effects of allotransplantation, and initiate acute graft-versus-host disease (GVHD), the leading cause of nonrelapse mortality.1-3 We previously reported donor plasmacytoid dendritic cells (pDCs) purified from marrow grafts reduced GVHD in murine bone marrow transplantation (BMT) models,4 reduced GVL activity in related-donor HLA-matched marrow transplants,5 and reduced chronic GVHD in unrelated donor marrow transplants.6 Data from murine models indicate donor pDCs regulate host-versus-graft activity of recipient T cells, facilitate stem cell engraftment,7 and induce regulatory T cells (Tregs) through indoleamine 2,3-deoxygenase.4
Recently, we identified signaling through vasoactive intestinal polypeptide (VIP) receptors as a novel immune checkpoint pathway that regulates the activation and expansion of antigen-specific T cells.8 VIP is a 28-amino-acid peptide synthesized by neurons and immune cells.9 Pharmacological antagonists or genetic inactivation of VIP enhances adaptive T-cell responses to viral infection10-12 and autologous13 and allogeneic14 T-cell–mediated antileukemic responses. Therefore, we hypothesized that VIP expressed by donor pDCs may regulate the GVHD activity of donor T cells after allotransplant. To test this hypothesis, we purified pDCs from mouse bone marrow (BM) and human peripheral blood mononuclear cells and showed upregulation of VIP expression in pDC after activation and colocalization of donor pDCs and T cells in host primary and secondary lymphoid tissues and GVHD target organs after allo-BMT. Wild-type pDCs inhibited T-cell proliferation in vitro, whereas VIP knockout (KO) pDCs enhanced expansion of T helper 1 (Th1) polarized T cells. Transplanting VIP KO donor pDCs increased GVHD in murine models of allo-BMT and enhanced donor T-cell expansion and inflammatory cytokine levels. These findings add to previously described mechanisms by which donor pDCs regulate immune reconstitution following allo-BMT and suggest novel approaches for pharmacological regulation of GVHD.
Methods
HSC, T-cell, and pDCs isolation and transplantation
After the mice were euthanized, cells were flushed from spleen, tibia, and femur using 2% fetal bovine serum in phosphate-buffered saline. Donor T cells were harvested from splenocytes using a pan T-cell isolation kit II, an LS column, and a MidiMACS separator (magnetic-activated cell sorting [MACS]) (Miltenyi Biotec Germany). Hematopoietic stem cell (HSC) and pDC preparations were sorted from BM as previously described.4 Briefly, cells were stained with fluorochrome-conjugated lineage (CD3, CD11b, CD19, IgM, CD49b, and Ter119), CD11c, B220, PDCA-1, CD117, and Ly6-A/E antibodies (supplemental Table 1, available on the Blood Web site), using fluorescence-activated cell sorter (FACS) Aria II cell sorter and Diva Version 5.1 software (BD Biosciences). C57BL/6 HSCs were sorted as B220−lineage−CD117+Sca-1+; donor pDCs were sorted as B220+lineage−CD11c+PDCA-1+ from wild-type C57BL/6 or VIP-KO mice (supplemental Figure 1A-C). HLA-DR+ Lineage−CD123+ human pDCs were sorted from blood mononuclear cells. B10.BR recipient mice were irradiated using a cesium source (5.5 Gy × 2 doses; dose rate 0.70 Gy/min) or with radiographs (Rad Source, Atlanta, GA) (4.5 Gy × 2 doses; dose rate 1.61 Gy/min). Balb/c mice were lethally irradiated with the cesium source (4.5 Gy x 2 doses) or X-rays (3.5 Gy x 2 doses). DBA/2 mice were irradiated with X-rays (4.5 Gy x 2 doses). All radiation fractions were separated by 3 hours. On the next day (day “0”), recipients were injected IV into the tail vein with 5 × 10³ HSCs, 5 × 10⁴ pDCs, and doses of MACS-purified C57BL/6 splenic T cells that varied by experiment and recipient strain. Two GVL models were used. Mice were irradiated on day −2 and inoculated with 5 × 10⁵ cells of LBRM-33 clone 5A4 cells (ATCC) by tail vein injection on day −1 before transplantation (B10.BR model) or subcutaneous injection of either 1 × 10⁵ or 5 × 10⁵ luciferase+ P815-TGL cells on day −1 (DBA/2 model). Transplantation with C57BL/6 HSC occurred on day 0. Recipient mice were weighed twice weekly and monitored for clinical signs of GVHD using an established 10-point scoring system.4
Detailed methods for mouse strains and tumor cell lines, cell culture, histology, bioluminescent imaging, serum cytokine assays, RNA sequencing, and statistical analyses are described in the supplemental methods.
Results
PDCs express VIP
VIP KO mice have a modified neomycin gene cassette inserted in an inverted orientation into exon 4 of the VIP gene via homologous recombination, leading to premature termination of translation of the pre-pro-VIP prior to the mature VIP sequence encoded on exon 5 (supplemental Figure 1A-C). Polymerase chain reaction (PCR) was conducted to verify the genotype of VIP KO mice (Figure 1A), and reverse transcription-PCR confirmed no amplification of wild-type VIP coding sequence (Figure 1B). Based on the described immune-regulatory roles of donor pDCs in allogeneic transplant4,6,15-17 and reports that VIP induces immune-tolerant dendritic cells,18-20 we first asked whether pDCs produce VIP. The gating strategy for flow cytometric analysis and sorting of pDCs is shown in supplemental Figure 1C, with >90% purity of sorted pDCs (supplemental Figure 1D). Cytospin preparations of pDCs sorted from mouse BM4 showed VIP expression in the majority of wild-type pDCs (Figure 1C,E). Mouse pDCs isolated from marrow cultured in vitro with 12-phorbol myristate 13-acetate/ionomycin activation had increased VIP expression (Figure 1D; supplemental Figure 1C). Of note, the directly conjugated monoclonal antibody raised against pre-pro-VIP detected immunoreactive VIP in pDCs from BM of wild-type and VIP KO mice, consistent with the antibody targeting N-terminal sequences of pre-pro-VIP that are retained in the VIP KO gene product (supplemental Figure 1A). Human pDCs isolated from blood expressed similar levels of VIP as mouse pDCs (Figure 1F).

pDCs express VIP. (A) Gel electrophoresis showing the PCR products of DNA extracted from wild-type, VIP KO, and VIP wild-type/KO heterozygous mice using PCR amplification of genomic DNA as described in supplemental methods. The 708-bp band is generated by primers N1 and V2 given by KO allele. The wild-type allele gives a product of 318 bp, generated by V1 and V2. Lanes 1 to 2 are DNA from wild-type mice, lanes 3 to 6 VIP-KO homozygous mice, and lanes 7 to 8 wild-type/KO heterozygous mice. (B) Ethidium-bromide-stained agarose gel electrophoresis showing reverse transcription–PCR products of RNA extracted from both wild-type and VIP KO mice whole brain. The primers were designed to target coding sequence, including PHI encoding exon 4 sequence and VIP encoding exon 5 sequence as described in the supplemental methods. Messenger RNA extracted from VIP-KO mice brain showed no amplification of wild-type VIP coding sequence. (C) Cytospin preparations of FACS-purified mice BM pDCs were stained for CD317(PDCA-1), and pre-pro-VIP, followed by Alexa Fluor 568 and Alexa Fluor 488 conjugated secondary antibodies, respectively (shown in red and green), and counterstained with DAPI (4′,6-diamidino-2-phenylindole; shown in blue). Magnification is ×40, zoom ×1.5. (D) Freshly sorted mouse BM pDCs activated overnight with phorbol 12-myrsitate 13-acetate/ionomycin. Representative of 3 independent experiments. (E) Freshly sorted pDCs stained as per panel C stained with secondary antibody but without using the primary anti–pre-pro-VIP primary antibody as a control. (F) FACS-purified human peripheral blood pDCs stained with anti–pre-pro-VIP (red stain is shown in pseudo green) in combination with the pDC-specific marker CD303 (BDCA-2)-fluorescein isothiocyanate (green stain is shown in pseudo red). Magnification is ×40, zoom ×1.0. Analysis by confocal microscopy shows the coexpression of murine and human pDCs surface markers with intracellular expression of VIP in both human and mice pDCs. Bar indicates 20 μm. GAPDH, glyceraldehyde-3-phosphate dehydrogenase; WT, wild type.
pDCs express VIP. (A) Gel electrophoresis showing the PCR products of DNA extracted from wild-type, VIP KO, and VIP wild-type/KO heterozygous mice using PCR amplification of genomic DNA as described in supplemental methods. The 708-bp band is generated by primers N1 and V2 given by KO allele. The wild-type allele gives a product of 318 bp, generated by V1 and V2. Lanes 1 to 2 are DNA from wild-type mice, lanes 3 to 6 VIP-KO homozygous mice, and lanes 7 to 8 wild-type/KO heterozygous mice. (B) Ethidium-bromide-stained agarose gel electrophoresis showing reverse transcription–PCR products of RNA extracted from both wild-type and VIP KO mice whole brain. The primers were designed to target coding sequence, including PHI encoding exon 4 sequence and VIP encoding exon 5 sequence as described in the supplemental methods. Messenger RNA extracted from VIP-KO mice brain showed no amplification of wild-type VIP coding sequence. (C) Cytospin preparations of FACS-purified mice BM pDCs were stained for CD317(PDCA-1), and pre-pro-VIP, followed by Alexa Fluor 568 and Alexa Fluor 488 conjugated secondary antibodies, respectively (shown in red and green), and counterstained with DAPI (4′,6-diamidino-2-phenylindole; shown in blue). Magnification is ×40, zoom ×1.5. (D) Freshly sorted mouse BM pDCs activated overnight with phorbol 12-myrsitate 13-acetate/ionomycin. Representative of 3 independent experiments. (E) Freshly sorted pDCs stained as per panel C stained with secondary antibody but without using the primary anti–pre-pro-VIP primary antibody as a control. (F) FACS-purified human peripheral blood pDCs stained with anti–pre-pro-VIP (red stain is shown in pseudo green) in combination with the pDC-specific marker CD303 (BDCA-2)-fluorescein isothiocyanate (green stain is shown in pseudo red). Magnification is ×40, zoom ×1.0. Analysis by confocal microscopy shows the coexpression of murine and human pDCs surface markers with intracellular expression of VIP in both human and mice pDCs. Bar indicates 20 μm. GAPDH, glyceraldehyde-3-phosphate dehydrogenase; WT, wild type.
VIP-KO mice have increased numbers of pDCs in BM
Interestingly, marrow from VIP KO mice had equivalent numbers of nucleated cells but an increased frequency of pDCs (0.8% ± 0.25% KO vs 0.5% ± 0.14% wild-type marrow; P < .05) and twice the number of pDCs per femur than wild-type mice (P < .01; Figure 2A-B). No significant differences in the expression of costimulatory factors were seen in pDCs from VIP KO vs wild-type mice (Figure 2C-H).

VIP-KO mice have more pDCs in BM than wild-type mice. (A-H) BM and splenocytes were isolated from wild-type B6 mice and VIP-KO B6 mice. Cells were stained with pDCs markers, dendritic cells costimulatory markers, including CD80, CD86, and inducible costimulator ligand (ICOSL). (A) Nucleated cells in marrow from wild-type and VIP KO mice (N = 9 mice per group) were analyzed for pDCs by flow cytometry per the staining and gating strategy shown in supplemental Figure 1 (N = mice 6 per group), and the absolute numbers of pDCs per femur calculated. (B) The percentage of pDCs in all the nucleated splenic cells, N = 9 mice per group. (C-D) ICOSL expression on pDCs, (E-F) CD80 expression on pDCs. (G-H) CD86 expression on pDCs. Eight biological replicates per group. Statistics: 2-tail unpaired Student t test, *P < .05, **P <0.01. ns, not significant.
VIP-KO mice have more pDCs in BM than wild-type mice. (A-H) BM and splenocytes were isolated from wild-type B6 mice and VIP-KO B6 mice. Cells were stained with pDCs markers, dendritic cells costimulatory markers, including CD80, CD86, and inducible costimulator ligand (ICOSL). (A) Nucleated cells in marrow from wild-type and VIP KO mice (N = 9 mice per group) were analyzed for pDCs by flow cytometry per the staining and gating strategy shown in supplemental Figure 1 (N = mice 6 per group), and the absolute numbers of pDCs per femur calculated. (B) The percentage of pDCs in all the nucleated splenic cells, N = 9 mice per group. (C-D) ICOSL expression on pDCs, (E-F) CD80 expression on pDCs. (G-H) CD86 expression on pDCs. Eight biological replicates per group. Statistics: 2-tail unpaired Student t test, *P < .05, **P <0.01. ns, not significant.
pDCs lacking VIP increase T-cell proliferation and Th1 polarization in vitro
Next, we tested the ability of freshly isolated pDCs activated overnight with CpG and R848 to suppress the proliferation of primary T cells activated in vitro with surface-bound anti-CD3 monoclonal antibodies and interleukin-2 (IL-2) for 72 hours. Both CD4+ and CD8+ T cells had increased proliferation following CD3 stimulation when cocultured with syngeneic activated pDCs, reflected in an increased proliferation index and a higher fraction of proliferated cells. However, the fraction of proliferated T cells was greater following coculture with VIP-KO pDCs than wild-type pDCs (Figure 3A-B), indicating that VIP expression by pDCs suppressed proliferative capacity of activated T cells without altering the fraction of cells that proliferated. In addition to stimulating more T-cell divisions among activated T cells, VIP-KO pDCs induced higher frequencies of interferon-γ (IFN-γ)+, inducible costimulator+, and IFN-γ/tumor necrosis factor-α (TNF-α) double-positive CD8+ T cells than wild-type pDCs (Figure 3D-F). Similar effects were not seen in CD4+ T cells (Figure 3C). Notably, wild-type pDCs induced significantly more Tregs in vitro than in cultures lacking pDCs, and the frequency of Treg in cocultures with wild-type pDCs trended higher (P = NS) than cocultures with VIP-KO pDCs (supplemental Figure 2A). There were no significant differences in the frequencies of perforin- or granzyme B-expressing CD8+ T cells comparing coincubation with wild-type vs KO pDC (supplemental Figure 2C), suggesting a greater role for VIP expression by pDC in cytokine polarization than effector function in cognate T cells.


VIP limits T-cell proliferation and Th1 polarization of T cells in vitro. (A-B) pDCs isolated from B6 and VIP-KO marrow by FACS were activated with R848 and CpG for 24 hours, followed by coculturing with syngeneic T cells for 72 hours at a pDC:T-cell ratio of 1:10. CD4+ and CD8+ T-cell proliferation was analyzed by CFSE (carboxyfluorescein diacetate succinimidyl ester) dilution using flow cytometry. Representative histograms for CFSE dilution and mean values of the fraction of proliferated cells and the proliferation index. Two independent experiments that included 3 biological replicates per group with a total of n = 14 technical replicates in the VIP-KO pDC group, n = 10 in the wild-type pDC group, and n = 14 in the no pDC group. (A) Proliferation for activated CD4+ T cells. (B) Proliferation for activated CD8+ T cells. (C-D) Representative flow plots of IFN-γ expression on CD4+ T cells (C) and CD8+ T cells (D) analyzed by flow cytometry after intracellular staining. (E-F) Representative flow plots of IFN-γ and TNF-α coexpression on CD4+ T cells and CD8+ T cells based on 2 independent experiments that each included 2 biological replicates with a total of 8 technical replicates for each group. Statistics: 2-tail unpaired Student t test, *P < .05, **P < .01, ***P < .001, ****P < .0001.
VIP limits T-cell proliferation and Th1 polarization of T cells in vitro. (A-B) pDCs isolated from B6 and VIP-KO marrow by FACS were activated with R848 and CpG for 24 hours, followed by coculturing with syngeneic T cells for 72 hours at a pDC:T-cell ratio of 1:10. CD4+ and CD8+ T-cell proliferation was analyzed by CFSE (carboxyfluorescein diacetate succinimidyl ester) dilution using flow cytometry. Representative histograms for CFSE dilution and mean values of the fraction of proliferated cells and the proliferation index. Two independent experiments that included 3 biological replicates per group with a total of n = 14 technical replicates in the VIP-KO pDC group, n = 10 in the wild-type pDC group, and n = 14 in the no pDC group. (A) Proliferation for activated CD4+ T cells. (B) Proliferation for activated CD8+ T cells. (C-D) Representative flow plots of IFN-γ expression on CD4+ T cells (C) and CD8+ T cells (D) analyzed by flow cytometry after intracellular staining. (E-F) Representative flow plots of IFN-γ and TNF-α coexpression on CD4+ T cells and CD8+ T cells based on 2 independent experiments that each included 2 biological replicates with a total of 8 technical replicates for each group. Statistics: 2-tail unpaired Student t test, *P < .05, **P < .01, ***P < .001, ****P < .0001.
pDCs and T cells home to hematolymphoid tissues and GVHD target organs in allo-HSCT
After showing that VIP expressed by pDCs suppresses syngeneic T-cell activation, we next asked whether donor pDCs home to GVHD tissue sites in allotransplant recipients. We used luciferase-transgenic (luc+) donor pDCs or luc+ donor T cells in a major histocompatibility complex mismatched B6→Balb/c BMT model to characterize the tissue-specific homing properties of both donor pDCs and donor T cells.21 On day 7, luciferase signals from transplanted luc+ pDCs were barely detectable (Figure 4A) but easily visible in anesthetized mice on day 14 (Figure 4B). Following euthanasia and necropsy, the majority of luc+ donor pDCs had migrated to the spleen, but significant numbers were present in GVHD target organs, including scattered signals in the gastrointestinal (GI) tract, representing 12.5% of whole-body luminescence (Figure 4D), with diffuse signals in lung (Figure 4B). Similar homing patterns were observed for luc+ donor T cells cotransplanted with wild-type HSC, with the spleen and GI tract being the major sites for T-cell homing on day 7 (not shown) and day 14 (Figure 4B-C), as previously reported.21 Comparing mean luciferase signals in organs harvested on day 14 from separate experiments utilizing luc+ donor pDCs or luc+ donor T cells, we observed a concordance of homing patterns for these donor cell populations (R2 = 0.93) (Figure 4E). Transplanting GFP+ donor T cells and wild-type pDC showed scattered GFP+ donor T cells and PDCA-1+ cells (presumptive donor pDCs) in 5% to 10% of sections of day +8 small intestine (Figure 4F). Of note, pDCs are very sensitive to radiation and alloreactive T cells, and host pDCs are gone by day +14 posttransplant.22 Although PDCA-1 is not a unique marker for donor pDCs,23 the correspondence of PDCA-1+ cells with donor pDC was confirmed by costaining for PDCA-1 and major histocompatibility complex class I H-2Kb (Figure 4G) or anti-GFP (Figure 4H) in sections of the small intestine of Balb/c recipients on day +14 following transplantation of 5 × 10³ B6 wild-type HSC, 5 × 10⁴ donor T cells, and 5 × 10⁴ GFP+ pDC from C57BL/6 donor mice.

Homing and in vivo expansion of donor pDCs and T cells in the spleen and GVHD target organs. (A) The bioluminescent image was taken 7 days after Balb/c mice were transplanted with 5 × 10⁴ FACS-purified luciferase pDCs or 1 × 10⁶ luciferase T cells, in combination with 5 × 10³ FACS-sorted HSCs from C57BL/6 mice. Mice were sacrificed, and thymus (an anatomic site for tolerogenic pDC),53 lung, GI tract, spleen, paw, and liver were collected. Left side radiance scale bar (200- 500) is for the whole-body image; right side radiance scale bar (100-350) is for the organ images. (B) Fourteen days after the transplant, bioluminescent images of anesthetized mice and isolated organs were obtained. The highest bioluminescence signals are seen in the spleen, GI tract, and lung. Left side radiance scale bar (103 to 104 p/sc/cm2/sr) is for the whole-body image of both groups; right side radiance scale bar (104 to 105) is for the organ images. (C) Mean ± standard deviation for bioluminescent signals in organs following transplantation of luciferase+ T cells; N = 6 biological replicates per group. (D) Mean ± standard deviation for bioluminescent signals in organs following transplantation of luciferase+ pDCs recipients; N = 4 biological replicates per group. (E) Correlation of mean bioluminescent signals per organ comparing recipients of luciferase+ donor T cells and donor pDCs (R2 = 0.93). N = 4 biological replicates in the luc+ pDCs + HSC group, and n = 6 in luc+ T cells and HSC group. Statistics: power linear progression. (F) The small intestine from B10.BR recipients was collected 8 days after allo-HSCT from a C57BL/6 donor graft containing 5 × 10³ HSCs, 5 × 10⁴ pDCs, and 1× 10⁶ GFP+ T cells. Recipients were sacrificed on day 8 posttransplant. GI tract was stained for rat anti-PDCA-1, followed by staining with an anti-rat AF568-conjugated antibody. Images were analyzed with an Olympus FV10000 Confocal Laser Scanning Biological Microscope. An image showing the presence of pDCs and donor T cells is shown from 4 images with detectable donor cells out of 40 images examined. Magnification: ×20. Bar indicates 50 μm. (G) Immunofluorescence staining with anti-H-2Kb and anti-PDCA-1 antibodies in optimal cutting temperature compound–embedded, 4% paraformaldehyde-fixed small intestine of Balb/c mice 14 days after lethal irradiation and transplantation with 5 × 10⁴ donor GFP+ pDC, 5 × 10³ HSC, and 5 × 10⁴ T cells from C57BL/6 donors. Identity of donor pDCs in the gut section was established by coexpression of H-2Kb and PDCA-1. White arrows show an exemplar of 3 cells that coexpressed H-2Kb and PDCA-1. Magnification: ×40. Bar indicates 50 μm. (H) Immunofluorescence staining of the same sections as in panel G with anti-GFP and anti-PDCA-1 antibodies. Identity of donor pDCs in the gut section was established by coexpression of GFP and PDCA-1. Gray arrows show 2 cells that coexpressed GFP and PDCA-1. Anti-GFP Ab was applied to eliminate the possible confounding effects of autofluorescence in the GI tract with GFP signals. Magnification: ×40. Bar indicates 50 μm.
Homing and in vivo expansion of donor pDCs and T cells in the spleen and GVHD target organs. (A) The bioluminescent image was taken 7 days after Balb/c mice were transplanted with 5 × 10⁴ FACS-purified luciferase pDCs or 1 × 10⁶ luciferase T cells, in combination with 5 × 10³ FACS-sorted HSCs from C57BL/6 mice. Mice were sacrificed, and thymus (an anatomic site for tolerogenic pDC),53 lung, GI tract, spleen, paw, and liver were collected. Left side radiance scale bar (200- 500) is for the whole-body image; right side radiance scale bar (100-350) is for the organ images. (B) Fourteen days after the transplant, bioluminescent images of anesthetized mice and isolated organs were obtained. The highest bioluminescence signals are seen in the spleen, GI tract, and lung. Left side radiance scale bar (103 to 104 p/sc/cm2/sr) is for the whole-body image of both groups; right side radiance scale bar (104 to 105) is for the organ images. (C) Mean ± standard deviation for bioluminescent signals in organs following transplantation of luciferase+ T cells; N = 6 biological replicates per group. (D) Mean ± standard deviation for bioluminescent signals in organs following transplantation of luciferase+ pDCs recipients; N = 4 biological replicates per group. (E) Correlation of mean bioluminescent signals per organ comparing recipients of luciferase+ donor T cells and donor pDCs (R2 = 0.93). N = 4 biological replicates in the luc+ pDCs + HSC group, and n = 6 in luc+ T cells and HSC group. Statistics: power linear progression. (F) The small intestine from B10.BR recipients was collected 8 days after allo-HSCT from a C57BL/6 donor graft containing 5 × 10³ HSCs, 5 × 10⁴ pDCs, and 1× 10⁶ GFP+ T cells. Recipients were sacrificed on day 8 posttransplant. GI tract was stained for rat anti-PDCA-1, followed by staining with an anti-rat AF568-conjugated antibody. Images were analyzed with an Olympus FV10000 Confocal Laser Scanning Biological Microscope. An image showing the presence of pDCs and donor T cells is shown from 4 images with detectable donor cells out of 40 images examined. Magnification: ×20. Bar indicates 50 μm. (G) Immunofluorescence staining with anti-H-2Kb and anti-PDCA-1 antibodies in optimal cutting temperature compound–embedded, 4% paraformaldehyde-fixed small intestine of Balb/c mice 14 days after lethal irradiation and transplantation with 5 × 10⁴ donor GFP+ pDC, 5 × 10³ HSC, and 5 × 10⁴ T cells from C57BL/6 donors. Identity of donor pDCs in the gut section was established by coexpression of H-2Kb and PDCA-1. White arrows show an exemplar of 3 cells that coexpressed H-2Kb and PDCA-1. Magnification: ×40. Bar indicates 50 μm. (H) Immunofluorescence staining of the same sections as in panel G with anti-GFP and anti-PDCA-1 antibodies. Identity of donor pDCs in the gut section was established by coexpression of GFP and PDCA-1. Gray arrows show 2 cells that coexpressed GFP and PDCA-1. Anti-GFP Ab was applied to eliminate the possible confounding effects of autofluorescence in the GI tract with GFP signals. Magnification: ×40. Bar indicates 50 μm.
VIP signaling by donor pDCs reduces GVHD-related mortality
To test whether local production of VIP by donor pDCs regulates GVHD and survival in allo-HSCT, we transplanted lethally irradiated B10.BR mice with FACS-purified populations of 5 × 10³ B6 wild-type HSC, 1 × 10⁶ donor T cells, and 5 × 10⁴ pDCs from either B6 wild-type or VIP-KO donor mice as previously described.4 Recipients of VIP-KO pDCs developed clinical manifestations of GVHD posttransplant with 44% mortality compared with 22% mortality among recipients of wild-type pDCs (Figure 5A; P < .05). Recipients of VIP-KO pDCs developed more severe GVHD as demonstrated by higher clinical GVHD scores (Figure 5B; P < .0001). Early after allo-HSCT, mice experienced diarrhea and weight loss for 7 to 10 days, followed by gradual weight gain. Fur ruffling, skin scaling, and other manifestations associated with chronic GVHD begin to appear at ∼1 month. Mice with more severe clinical manifestations of chronic GVHD were euthanized after meeting protocol-defined Institutional Animal Care and Use Committee endpoints. To confirm that the ability of donor pDCs to regulate GVHD was robust across different T-cell doses, we repeated the transplant experiments using a twofold higher dose of donor T cells (2 × 10⁶ T cells). B10BR mice transplanted with 2 × 10⁶ T cells and VIP-KO pDCs developed severe GVHD with 60% mortality (Figure 5C; P = NS) and higher clinical GVHD scores (Figure 5D; P < .01) compared with 33% mortality among recipients of the same numbers of donor T cells, HSC, and wild-type pDCs. Scheduled euthanasia and necropsy of recipients of wild-type vs VIP-KO donor pDCs at 32 days posttransplant did not reveal significant differences in histological scores of acute GVHD among mice that received the low dose of donor T cells (1 × 10⁶ T cells; data not shown). In contrast, among B6→B10.BR mice transplanted with 2 × 10⁶ T cells, histological analysis of the colon early posttransplant on day 7 showed that recipients of VIP-KO pDCs had higher frequency of intracryptal apoptosis24 (indicated as yellow arrows in Figure 5I-J; P < .05) compared with recipients of wild-type pDCs, consistent with the higher level of acute GVHD seen with the higher donor T-cell dose. Notably, high lymphocytic infiltration was not seen in colons from VIP-KO pDC recipients, suggesting that cytokine-mediated effects were likely responsible for intracryptal apoptosis. Confirming our previous report,4 day +8 necropsy of allo-HSCT recipients transplanted with donor HSC and T cells in the absence of donor pDCs demonstrated higher histological scores for intestine (Figure 5E-F; P < .05), GVHD, and colon (Figure 5G-H; P < .05) compared with mice transplanted with wild-type donor pDCs. The histological GVHD scores combined for small and large intestine were higher among recipients of VIP-KO pDCs compared with recipients of wild-type pDCs (P = .023). Recipients of VIP KO pDCs had fewer mucus-secreting goblet cells in the intestinal villi (P = NS) and more apoptotic cells in crypts (P < .05; Figure 5E-L). The immune-modulatory effect of donor pDCs appeared to be time-limited, as we did not observe attenuation of gut GVHD comparing histopathology of small intestine and colon in allotransplant recipients of wild-type vs no donor pDCs on day 15 (supplemental Figure 3). Taken together, these data indicate that wild-type donor pDCs can inhibit the initiation of acute intestinal GVHD, but that limited persistence of donor pDCs in GVHD target organs mitigates their ability to control GVHD at later times.

VIP synthesis by donor pDCs limits GVHD in allo-HSCT recipients. (A-B) Percentage survival of B10.BR mice transplanted with 5 × 10³ FACS-sorted HSCs and 1 × 10⁶ MACS-enriched splenic T cells from C57BL/6J mice with the addition of 5 × 10⁴ FACS-purified pDCs from either wild-type or VIP-KO mice. Survival and mean GVHD score of each group are shown. Biological replicates involved 18 independent experiments with n = 83 mice in wild-type pDCs, HSC, and 1MT group; n = 41 mice in the VIP-KO pDCs, HSC, and 1 × 10⁶ group; n = 61 in the HSC and 1 × 10⁶ T-cell group. (C-D) Survival and mean GVHD scores of mice that received 5 ×10³ HSCs, 2 × 10⁶ splenic T cells, and 5 × 10⁴ FACS-purified wild-type or VIP-KO pDCs. N = 16 mice per group. (E) 7 days after B10.BR mice received 1 × 10⁶ T cells, mice were euthanized, and jejunum, duodenum, and ileum were harvested, formalin-fixed, paraffin-embedded, 10-μm sections stained with hematoxylin and eosin, and histological GVHD scores were determined by a pathologist masked to treatment group. Bar indicates 50 μm at ×200 magnification. (F) Each dot represents a segment of small intestine. Four biological replicates and 12 technical replicates were analyzed for each group. Bar indicates 50 μm at ×200 magnification. (G-H) Histology score of colons in recipients of 1 × 10⁶ T cells of recipients. Bar indicates 50 μm at ×200 magnification. (I-J) Seven days after the B10.BR mice received 2 × 10⁶ T cells, colons were collected and stained with hematoxylin and eosin. Apoptotic crypts are counted by a pathologist. N = 8 in each group. Bar indicates 100 μm at ×40 magnification. (K-L) Seven days after allo-HSCT, formalin-fixed, paraffin-embedded sections of small intestine from recipients of 2 × 10⁶ T cells were stained with periodic acid–Schiff, and goblet cells were counted by a pathologist (masked to treatment group), n = 6 or 7 biological replicates for each group. Bar indicates 50 μm at ×200 magnification. Statistics: Kaplan-Meier for survival analysis, two-way analysis of variance for clinical GVHD, nonparametric Mann-Whitney U test for histological GVHD scores, and crypts apoptosis. Yellow arrow marks necrotic cell; yellow asterisks marks neutrophils. *P < .05, **P < .01, ***P < .001, ****P < .0001.
VIP synthesis by donor pDCs limits GVHD in allo-HSCT recipients. (A-B) Percentage survival of B10.BR mice transplanted with 5 × 10³ FACS-sorted HSCs and 1 × 10⁶ MACS-enriched splenic T cells from C57BL/6J mice with the addition of 5 × 10⁴ FACS-purified pDCs from either wild-type or VIP-KO mice. Survival and mean GVHD score of each group are shown. Biological replicates involved 18 independent experiments with n = 83 mice in wild-type pDCs, HSC, and 1MT group; n = 41 mice in the VIP-KO pDCs, HSC, and 1 × 10⁶ group; n = 61 in the HSC and 1 × 10⁶ T-cell group. (C-D) Survival and mean GVHD scores of mice that received 5 ×10³ HSCs, 2 × 10⁶ splenic T cells, and 5 × 10⁴ FACS-purified wild-type or VIP-KO pDCs. N = 16 mice per group. (E) 7 days after B10.BR mice received 1 × 10⁶ T cells, mice were euthanized, and jejunum, duodenum, and ileum were harvested, formalin-fixed, paraffin-embedded, 10-μm sections stained with hematoxylin and eosin, and histological GVHD scores were determined by a pathologist masked to treatment group. Bar indicates 50 μm at ×200 magnification. (F) Each dot represents a segment of small intestine. Four biological replicates and 12 technical replicates were analyzed for each group. Bar indicates 50 μm at ×200 magnification. (G-H) Histology score of colons in recipients of 1 × 10⁶ T cells of recipients. Bar indicates 50 μm at ×200 magnification. (I-J) Seven days after the B10.BR mice received 2 × 10⁶ T cells, colons were collected and stained with hematoxylin and eosin. Apoptotic crypts are counted by a pathologist. N = 8 in each group. Bar indicates 100 μm at ×40 magnification. (K-L) Seven days after allo-HSCT, formalin-fixed, paraffin-embedded sections of small intestine from recipients of 2 × 10⁶ T cells were stained with periodic acid–Schiff, and goblet cells were counted by a pathologist (masked to treatment group), n = 6 or 7 biological replicates for each group. Bar indicates 50 μm at ×200 magnification. Statistics: Kaplan-Meier for survival analysis, two-way analysis of variance for clinical GVHD, nonparametric Mann-Whitney U test for histological GVHD scores, and crypts apoptosis. Yellow arrow marks necrotic cell; yellow asterisks marks neutrophils. *P < .05, **P < .01, ***P < .001, ****P < .0001.
VIP production by donor pDCs did not abrogate the GVL or GVT activity of donor T cells
Two graft-versus-cancer models were studied: B6→B10.BR transplants in mice engrafted with LRBM following lethal irradiation and prior to allotransplant4 and the B6→DBA/2 P815-TGL model.25 B10.BR mice bearing LBRM leukemia and transplanted with VIP-KO pDCs had 40% 60-day survival compared with 60% survival among recipients of wild-type pDCs, and 30% survival in the group that received no pDCs (supplemental Figure 4A-B; P = NS). Using luciferase+ P815-TGL mastocytoma tumors established in DBA/2 recipients, we found that transplantation with VIP KO pDCs did not have detrimental effects on the long-term GVT effect of donor T cells (supplemental Figure 4C-G). Of note, mice transplanted with 5 × 10⁴ VIP KO pDC, 1 × 10⁵ P815, and 1 × 10⁵ donor T cells had transient suppression of tumor growth at day 15 posttransplant, with tumor burdens at later time points equal across treatment groups (supplemental Figure 4F). Consistent with published data on graft-facilitation,7 wild-type donor pDCs facilitated HSC engraftment when transplanted in the absence of donor T cells (supplemental Figure 5). In contrast to the B6→B10.BR model, transplanting purified populations of HSC, T cells, and wild-type or VIP KO pDCs into irradiated Balb/c recipients did not result in significant survival differences (supplemental Figure 6).
VIP KO pDCs induce greater donor T-cell expansion in vivo than wild-type pDCs
We next tested the effects of the VIP production by pDCs on the kinetics of donor T-cell expansion within specific organs in allo-HSCT recipients. B10.BR recipients of VIP-KO pDCs had significantly more splenic T cells on day +8 posttransplant (Figure 6A), although not on day +15 (Figure 6B), consistent with greater initial donor T-cell expansion. The percentages of Treg cells among recipients of wild-type pDCs trended higher on day 8 (P = NS) and were significantly higher on day 15 (P < .05) posttransplant vs recipients without pDCs (Figure 6C-D). To measure the effect of VIP KO pDC on donor T-cell expansion, Balb/c recipients were irradiated and transplanted with 1 × 10⁶ luc+ donor C57BL/6 T cells in combination with 5 × 10³ wild-type HSCs and 5 × 10⁴ wild-type or VIP KO pDCs. Donor T cells transplanted with VIP KO pDCs homed to and expanded in the spleen, gut, and lungs of recipient mice to a greater degree than donor T cells cotransplanted with wild-type pDCs (Figure 6E-F; P < .05), with more donor T cells in skin and lung at day 14 posttransplant (Figure 6F). In a separate experiment using the B6→B10.BR transplant model, short term-expansion (supplemental Figure 7) and long-term expansion and engraftment of donor luc+ T cells (Figure 6G) were greater when T cells were cotransplanted with VIP KO pDCs than wild-type pDC. Taken together, these data indicate that VIP expression by donor pDCs limits the expansion of donor T cells.

The absence of VIP production by donor pDCs leads to enhanced in vivo expansion and homing of donor T cells to GVHD target organs. (A-D) B10.BR mice were lethally irradiated and transplanted with 5 × 10³ FACS-purified HSCs and 106 T cells from C57B/6J donors with 5 × 10⁴ FACS-purified pDCs either from wild-type or from VIP-KO donors. (A-B) Comparisons of the absolute numbers of donor T cells in recipient spleens on day +8 and day +15 after transplant. Seven biological replicates from 2 independent experiments were studied. (C-D) Percentage of donor Tregs on CD4 T cells on day +8 and day +15 posttransplant. Seven or 8 biological replicates from 2 independent experiments were analyzed. (E-G) Bioluminescent imaging images of luc+ T engraftment in allogeneic recipients. Balb/c (H2Kd) recipients were lethally irradiated and injected with 1 × 10⁶ luc+ T cells isolated from C57BL/6J donor mice in combination with 5 × 10³ FACS-purified HSCs and either 5 × 10⁴ wild-type pDC or 5 × 10⁴ VIP KO pDC. Left side radiance scale bar (1000 to 10 000 p/sc/cm2/sr) is for the whole-body image; right side radiance scale bar (10 000 to 100 000 p/sc/cm2/sr) is for the organ images (E). Representative bioluminescent imaging images of luc+ donor T cells in Balb/c recipients on day 14. (F) Radiance (p/sc/cm2/sr) of gut, lung, spleen, and paws in Balb/c recipients. N = 6 biological replicates per group, from 2 independent experiments. (G) Total photon flux (p/s) of B10.BR (H2Kk) mice transplanted with 1 × 10⁶ luc+ C57BL/6J T cells in combination with 5 × 10³ FACS-purified HSCs and either 5 × 10⁴ wild-type pDC, 5 × 10⁴ VIP KO pDC, or no donor pDC. Serial whole-body images of the same mice were taken at different time points posttransplant. N = 5 nice per group. Statistics: nonparametric Mann-Whitney U test, *P < .05, **P <.01.
The absence of VIP production by donor pDCs leads to enhanced in vivo expansion and homing of donor T cells to GVHD target organs. (A-D) B10.BR mice were lethally irradiated and transplanted with 5 × 10³ FACS-purified HSCs and 106 T cells from C57B/6J donors with 5 × 10⁴ FACS-purified pDCs either from wild-type or from VIP-KO donors. (A-B) Comparisons of the absolute numbers of donor T cells in recipient spleens on day +8 and day +15 after transplant. Seven biological replicates from 2 independent experiments were studied. (C-D) Percentage of donor Tregs on CD4 T cells on day +8 and day +15 posttransplant. Seven or 8 biological replicates from 2 independent experiments were analyzed. (E-G) Bioluminescent imaging images of luc+ T engraftment in allogeneic recipients. Balb/c (H2Kd) recipients were lethally irradiated and injected with 1 × 10⁶ luc+ T cells isolated from C57BL/6J donor mice in combination with 5 × 10³ FACS-purified HSCs and either 5 × 10⁴ wild-type pDC or 5 × 10⁴ VIP KO pDC. Left side radiance scale bar (1000 to 10 000 p/sc/cm2/sr) is for the whole-body image; right side radiance scale bar (10 000 to 100 000 p/sc/cm2/sr) is for the organ images (E). Representative bioluminescent imaging images of luc+ donor T cells in Balb/c recipients on day 14. (F) Radiance (p/sc/cm2/sr) of gut, lung, spleen, and paws in Balb/c recipients. N = 6 biological replicates per group, from 2 independent experiments. (G) Total photon flux (p/s) of B10.BR (H2Kk) mice transplanted with 1 × 10⁶ luc+ C57BL/6J T cells in combination with 5 × 10³ FACS-purified HSCs and either 5 × 10⁴ wild-type pDC, 5 × 10⁴ VIP KO pDC, or no donor pDC. Serial whole-body images of the same mice were taken at different time points posttransplant. N = 5 nice per group. Statistics: nonparametric Mann-Whitney U test, *P < .05, **P <.01.
VIP KO pDCs induce inflammatory cytokines and TNF-α+ T cells in vivo
Next, we determined the immune polarization of donor T cells recovered on days 8 and 15 following cotransplantation with wild-type or VIP-KO donor pDCs. Recipients of VIP-KO pDCs generally had higher serum levels of inflammatory factors than recipients of wild-type pDC, including Th1-related (IL-12p70), Th2-related (IL-31), Th17-related (IL-17A and IL-22) cytokines (supplemental Table 3). Notably, serum levels of granulocyte-macrophage colony-stimulating factor (GM-CSF) were significantly higher among recipients of VIP KO pDCs than wild-type pDCs on days +3 and +8 posttransplant (Figure 7A-B,D). CD8+ T cells from recipients of VIP-KO pDCs had significantly higher levels of T-bet and PD-1, significantly higher TNF-α, and a trend toward higher intracellular GM-CSF expression than T cells from recipients of wild-type pDCs on day +15 posttransplant (supplemental Figure 8C-D).

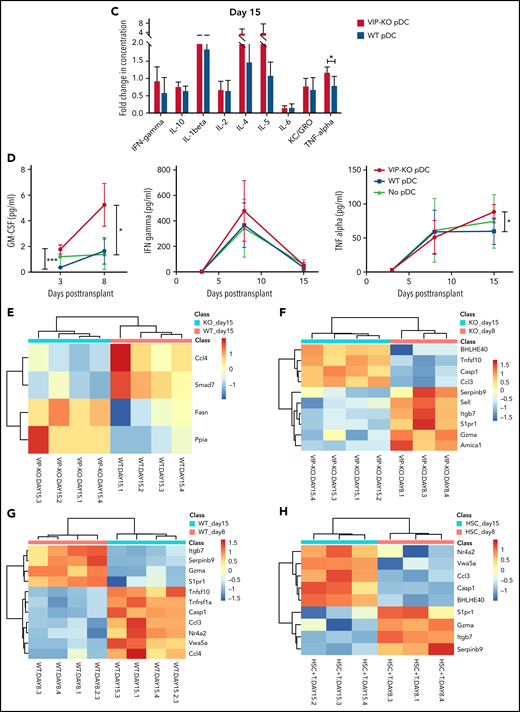
VIP-KO pDCs recipients have higher levels of GM-CSF and inflammatory cytokines in serum and upregulation of inflammatory genes in T cells. (A-H) B10.BR mice were lethally irradiated and transplanted with 5 × 10³ FACS-sorted HSCs and 106 T cells from C57B/6J donors along with 5 × 10⁴ FACS-purified wild-type or VIP-KO pDCs. (A-C) Serum samples collected from recipient blood on days +3, +8, and +15 after transplant were assayed for cytokines (Luminex 38 PLEX). Four biological serum replicates were analyzed from days +3 and day +15 mice. Day +8 samples were analyzed in duplicate (2 technical replicates per mouse), with the same panel as day +15. (D) A time course for serial measurements of GM-CSF, IFN-γ, and TNF-α expression in donor T cells collected days +3 to +15 after transplant. Statistics: two-tail unpaired Student t test, *P < .05, **P < .01, ***P < .001. (E-H) Heatmap showing donor T cells RNA expression level from spleen of recipients, day +8 and day +15 after allo-HSCT. Mean log2 expression for each subset is shown. Four biological replicates per group.
VIP-KO pDCs recipients have higher levels of GM-CSF and inflammatory cytokines in serum and upregulation of inflammatory genes in T cells. (A-H) B10.BR mice were lethally irradiated and transplanted with 5 × 10³ FACS-sorted HSCs and 106 T cells from C57B/6J donors along with 5 × 10⁴ FACS-purified wild-type or VIP-KO pDCs. (A-C) Serum samples collected from recipient blood on days +3, +8, and +15 after transplant were assayed for cytokines (Luminex 38 PLEX). Four biological serum replicates were analyzed from days +3 and day +15 mice. Day +8 samples were analyzed in duplicate (2 technical replicates per mouse), with the same panel as day +15. (D) A time course for serial measurements of GM-CSF, IFN-γ, and TNF-α expression in donor T cells collected days +3 to +15 after transplant. Statistics: two-tail unpaired Student t test, *P < .05, **P < .01, ***P < .001. (E-H) Heatmap showing donor T cells RNA expression level from spleen of recipients, day +8 and day +15 after allo-HSCT. Mean log2 expression for each subset is shown. Four biological replicates per group.
VIP KO pDCs induce and inflammatory gene signatures in donor T cells
Comparing differences in gene expression in T cells across different groups, we found significantly higher expression of CCL4 and Smad7 in T cells from mice receiving wild-type pDCs, whereas higher expression of Fasn and CyclophilinA/Ppia was seen in T cells from mice receiving VIP-KO pDCs (Figure 7E). The GO/pathway analysis indicates alteration of genes, including CCL3/CCL4 and Smad7, could affect several molecular interaction networks (supplemental Figure 9). Bhlhe40 is a key transcription factor that regulates GM-CSF production by CD4+ T cells.26
Expression of Bhlhe40 increased in T cells from day 8 to day 15 posttransplant in recipients of VIP-KO pDCs and no pDCs, but not in the wild-type pDCs group. These data suggest that VIP production by donor pDCs suppresses expression of Bhlhe40 in T cells (Figure 7F-H). Notably, other markers of inflammation, including Gzma, Itgb7, S1pr1, and Serpinb9, decreased from day 8 to day 15 independently of VIP synthesis by donor pDCs (Figure 7F-H).
Discussion
This study identifies a novel mechanism by which donor pDCs, a rare immune cell present in marrow grafts, regulates the alloreactivity and GVHD potential of donor T cells in allo-HSCT. Recipients of wild-type donor pDCs had 8% better survival than mice transplanted with no pDC, less than the 18% survival benefit of donor pDCs previously reported,4 but consistent with a significant survival benefit when data from both studies are combined (not shown). Previous reports have shown that exogenous VIP generates tolerogenic dendritic cells from BM progenitors in vitro, and that dendritic cells generated from BM cells in the presence of VIP limit GVHD without decreasing GVL activity.18,27 Activated pDCs also play a critical role in developing CD4+CD25+ Tregs,28,29 which protect against GVHD.30 VIP-KO pDCs induced greater T-cell activation and expansion compared with wild-type pDCs, significantly increasing GVHD and mortality. We have previously published that exogenous VIP limits the activation and proliferation of T cells in vitro, and that adding VIP receptor antagonists enhances T-cell activation and proliferation.15 To our knowledge, this is the first demonstration that VIP expressed by donor pDCs suppresses T-cell proliferation and immune activation, thereby limiting GVHD and facilitating donor HSC engraftment. These data are consistent with our previous reports on the effect of VIP receptor agonists and antagonists on T-cell proliferation in vitro15 and demonstration that in vivo treatment of mice with a VIP receptor antagonist augments in vivo expansion, antiviral, and antileukemia activities of CD8+ effector T cells.10,14
Several hypotheses may explain the mechanism by which VIP secreted by donor pDCs may modulate T-cell alloreactivity. First, pDCs express VIP receptors, and exogenous VIP inhibits IFN-α secretion by pDCs,31 supporting an autocrine effect of VIP on pDCs. Second, VIP expressed by donor pDCs may have a paracrine effect on T-cell proliferation. Activation of T cells leads to increased expression of VPAC1 and VPAC2 receptors, rendering them more susceptible to the immune-inhibitory effects of VIP.32 VIP-receptor signaling may inhibit T-cell receptor signaling in response to allo-peptides presented by host antigen-presenting cells 33 or cross-presented by donor antigen-presenting cells,34,35 reducing activation of alloreactive donor T cells. Third, VIP expression by donor pDCs may indirectly affect T-cell activation by changing the antigen-presenting ability of nonhematopoietic host epithelial cells.36 All mechanisms are consistent with findings of increased donor T-cell homing to GVHD-target organs, expansion, and alloreactivity among recipients of VIP-KO pDCs.
Histological data from this study support inhibition of GVHD by donor VIP. Recipients of VIP-KO pDCs had more intracryptal apoptosis in the intestine without increased infiltration by donor lymphocytes, consistent with VIP reducing inflammatory cytokine cytokines that cause epithelial cell death in acute GVHD.24 Histological findings of acute GVHD in the gut largely resolved by 2 weeks posttransplant, suggesting that late mortality among VIP-KO donor pDC recipients may be manifestations of chronic GVHD, consistent with clinical findings of more chronic GVHD among recipients of fewer donor pDCs6 and IL-17/IL-22 expression in cutaneous GVHD in mice.37,38
Analysis of cytokine and gene expression in T cells in recipients of VIP KO pDCs is consistent with the etiology of acute GVHD. Bhlhe40 is the key transcription factor that regulates GM-CSF production in pathogenic donor T cells following allogeneic BMT.26 The increase in Bhlhe40 expression in T cells cotransplanted with VIP KO pDCs corresponded to increased GM-CSF plasma levels in these animals (supplemental Table 3). Consistent with this finding, coculture of VIP KO pDCs and T cells led to higher levels of inducible costimulator expression on CD8+ T cells, a marker for alloreactive T cells responsible for GVHD.39 Higher levels of Fasn in T cells from VIP-KO pDCs is consistent with increased IL17-polarization of T cells seen in mouse models of colitis.40,41 In contrast, VIP-producing donor pDCs may mitigate activation of donor T cells recruited to GVHD target organs. Notably, T cells from recipients of VIP-KO pDCs expressed higher levels of Cyclophilin A messenger RNA (CypA/Ppia, the therapeutic target for the immunosuppressive drug cyclosporine42) than T cells transplanted with wild-type pDCs. Cyclophilin A induces T-cell Th1 polarization, leading IFN-γ and TNF-α producing CD4+ T cells,43 and induces chemokines that attract leukocytes to sites of inflammation.44Smad7, a major negative regulator in transforming growth factor-β/bone morphogenetic proteins signaling,45 was higher in T cells from mice transplanted with wild-type pDC. These data support the model in which VIP secreted by donor pDCs attenuates inflammatory polarization and activation of donor T cells.4 Taken together, these findings suggest that VIP production by pDCs regulates pathogenic inflammatory donor T cells.26 VIP production by donor pDCs may be linked to the induction of indoleamine 2,3-deoxygenase, with both processes contributing to T-cell alloreactivity control.4
This study has several limitations. First, we used a reductionist model, combining highly purified populations of donor T cells, pDCs, and HSCs, to isolate the effect of donor pDCs in allo-HSCT. Other cells in the graft, including classical dendritic cells, B cells, natural killer cells, monocytes, and granulocyte progenitors, may regulate T-cell activation and VIP production. Second, the precise anatomic sites at which donor T cells and pDCs interact remain to be fully defined. Notably, both donor T cells and pDCs home to hematolymphoid and GVHD target organs, including the GI tract, the major site for acute GVHD.46 However, current methodologies of bioluminescent imaging and fluorescent microscopy have limited the ability to define intercellular signaling between donor pDCs and donor T cells. We used a dose of donor pDCs comparable to the content in 5 × 10⁶ murine marrow cells, and 2 × 10⁶ pDC per kilogram in a human allograft.6 If 12.5% of 50 000 donor pDCs are present in the intestine (1 g of tissue), then donor pDCs should be detectable in ∼12% of 1 mm2 × 10-μm-thick gut sections, slightly higher than observed detection rates. Direct examination of the gut by immunofluorescence showed the presence of rare donor T cells and PDCA-1+ cells (presumptive pDC; Figure 4F), with confirmation of the PDCA-1+ cells as donor pDC conferred by costaining with anti-H-2Kb and anti-PDCA-1 (Figure 4G), as well as costaining with anti-GFP and anti-PDCA-1 (Figure 4H). However, observed frequencies of donor pDC were too low to permit reliable quantitation. In addition, the overall survival benefit of wild-type pDC was modest compared with no donor pDCs recipients (Figure 5). There may be strain-dependent effects of donor pDC in murine allotransplantation, as enhanced T-cell expansion with VIP KO donor pDCs was seen in Balb/c recipients (Figure 4) without donor pDC-dependent survival differences in B6→Balb/c transplants (supplemental Figure 6). Finally, endogenous VIP may suppress HSC differentiation to pDCs or HSC proliferation.47,48 Notably, wild-type donor pDCs facilitated donor HSC engraftment, likely by attenuating host-versus-graft activities of residual recipient T cells and natural killer cells rather than a direct paracrine effect on myelopoiesis.49 Although previous reports indicate that severe GVHD impairs posttransplant pDCs recovery,49-51 we found similar frequency of pDCs in blood in all treatment groups (data not shown).
In summary, our study confirms that marrow-derived donor pDCs are tolerogenic and support a novel mechanism whereby donor pDCs regulate GVHD activities of donor T cells in allo-HSCT. The current findings support VIP-receptor signaling as a novel immune checkpoint pathway that limits donor T-cell activation. Strategies that increase the content of VIP-producing donor pDCs in allo-HSCT grafts by mobilization with Flt-3L may modulate in vivo donor T-cell activation and proliferation to balance GVHD and GVL activities in patients with hematologic malignancies undergoing allo-HSCT.52
Acknowledgments
Alan Frey critically read and reviewed the manuscript.
Research reported in this publication was supported by National Institutes of Health, National Institute of Allergy and Infectious Diseases grants R01AI145231 (E.K.W.), R56AI145231 (E.K.W.), National Cancer Institute (NCI) grant R01CA188523 (E.K.W.), and National Heart, Lung, and Blood Institute grant HL086773 (J.D.R.), by the shared resources of Winship Cancer Institute of Emory University (Bioinformatics and Systems Biology, and Cancer Animal Models) under the NCI award P30CA138292, and the Emory Multiplexed Immunoassay Core (EMIC), Winship Cancer Tissue and Pathology Core (CTP), and Emory Integrated Cellular Imaging Core (ICI). Additional support was provided by the National Center for Georgia Clinical & Translational Science Alliance of the National Institutes of Health under Award Number UL1TR002378.
The content is solely the responsibility of the authors and does not necessarily represent the official views of the National Institutes of Health.
Authorship
Contribution: J.Z., Y.W., J.L., P.K.D., C.R.G., H.Z., T.P., P.F., Y.L., M.H., A.U.A., J.M.L., and S.W. performed experiments; J.Z., Y.W., J.L., P.K.D., H.Z., C.R.G., S.R., T.N., K.G., A.U.A., J.D.R., and J.M.L. analyzed data and edited the manuscript; and J.Z., Y.W., J.L., and E.K.W. designed the research and wrote the manuscript.
Conflict-of-interest disclosure: The authors declare no competing financial interests.
Correspondence: Edmund K. Waller, Winship Cancer Institute, 1365C Clifton Rd C5004, Atlanta, GA 30322; e-mail: ewaller@emory.edu.
Data sets and protocols will be made available to other investigators without unreasonable restrictions by sending an e-mail to the corresponding author.
The online version of this article contains a data supplement.
There is a Blood Commentary on this article in this issue.
The publication costs of this article were defrayed in part by page charge payment. Therefore, and solely to indicate this fact, this article is hereby marked “advertisement” in accordance with 18 USC section 1734.

This feature is available to Subscribers Only
Sign In or Create an Account Close Modal