

Key Points
MRD analysis by allele-specific oligonucleotides RQ-PCR is a powerful prognosticator in MCL.
A time-varying kinetic model is a promising way to approach MRD, providing a risk stratification tool suitable for MRD-guided treatment.

Abstract
Minimal residual disease (MRD) analysis is a known predictive tool in mantle cell lymphoma (MCL). We describe MRD results from the Fondazione Italiana Linfomi phase 3 MCL0208 prospective clinical trial assessing lenalidomide (LEN) maintenance vs observation after autologous stem cell transplantation (ASCT) in the first prospective comprehensive analysis of different techniques, molecular markers, and tissues (peripheral blood [PB] and bone marrow [BM]), taken at well-defined time points. Among the 300 patients enrolled, a molecular marker was identified in 250 (83%), allowing us to analyze 234 patients and 4351 analytical findings from 10 time points. ASCT induced high rates of molecular remission (91% in PB and 83% in BM, by quantitative real-time polymerase chain reaction [RQ-PCR]). Nevertheless, the number of patients with persistent clinical and molecular remission decreased over time in both arms (up to 30% after 36 months). MRD predicted early progression and long-term outcome, particularly from 6 months after ASCT (6-month time to progression [TTP] hazard ratio [HR], 3.83; P < .001). In single-timepoint analysis, BM outperformed PB, and RQ-PCR was more reliable, while nested PCR appeared applicable to a larger number of patients (234 vs 176). To improve MRD performance, we developed a time-varying kinetic model based on regularly updated MRD results and the MIPI (Mantle Cell Lymphoma International Prognostic Index), showing an area under the ROC (Receiver Operating Characteristic) curve (AUROC) of up to 0.87 using BM. Most notably, PB reached an AUROC of up to 0.81; with kinetic analysis, it was comparable to BM in performance. MRD is a powerful predictor over the entire natural history of MCL and is suitable for models with a continuous adaptation of patient risk. The study can be found in EudraCT N. 2009-012807-25 (https://eudract.ema.europa.eu/).
Introduction
Outcomes in younger mantle cell lymphoma (MCL) patients have improved substantially over the last decade.1 This is the result of highly effective rituximab and cytarabine-based induction regimens followed by autologous stem cell transplantation (ASCT)-based programs and the more recent adoption of maintenance regimens after ASCT. Thanks to these improvements, 4-year progression-free survival and overall survival rates now exceed 60% and 80%, respectively.2-4 Nevertheless, most patients with MCL ultimately relapse. Considerable effort has thus been devoted to the development of effective tools aimed at identifying patients at high risk of relapse. These include prognostic scores, baseline biologic predictors, positron emission tomography scanning, and minimal residual disease (MRD) analysis.5 MRD has gained considerable interest following the publication of several reports indicating its high predictive value in this lymphoma subtype.6-9 Despite its success, many points remain to be addressed to fully establish the value of MRD detection in MCL. One major limitation of the current literature is the remarkable heterogeneity of employed methods, tissue sources, and choice of time points. Most reports have employed allele-specific polymerase chain reaction (PCR)-based MRD detection using either the simple nested-PCR approach7 or the more standardized real-time quantitative (RQ)-PCR method,6,8-10 with a few recent reports employing next-generation sequencing (NGS)-based approaches.11,12 Moreover, currently available reports often pool samples taken at different time points, disallowing a straightforward comparison of the predictive value of MRD during different treatment phases, and do not clearly distinguish between analyses conducted on peripheral blood (PB) or bone marrow (BM) samples. Finally, no systematic attempt to conduct a kinetic analysis over a prolonged time frame has so far been tested to capture a greater bulk of information compared with what can be derived from a single, “punctual” timepoint analysis.
The FIL MCL0208 trial is a multicenter randomized phase 3 trial demonstrating the benefit of lenalidomide (LEN) maintenance vs observation (OBS) after ASCT. The study enrolled 300 patients in Italy and Portugal, and clinical results have been recently published.4 The study included several biological substudies, including systematic monitoring of MRD in both PB and BM, using both nested and RQ-PCR at 10 rigorously fixed time points. We here describe the results of this comprehensive analysis. It included 4351 analytical findings, allowing a straightforward comparison of methods, tissues, and the predictive values of different time points, as well as the development of a kinetic model for outcome prediction capable of overcoming several limitations of single-timepoint analysis.
Methods
Patient series
The FIL-MCL0208 (NCT02354313) is a phase 3, multicenter, open-label, randomized, controlled study designed to determine the efficacy of 24-month (15 mg, days 1 to 21, every 28 days) vs OBS in young (18- to 65-year olds), fit, advanced-stage MCL patients after first-line high-dose chemoimmunotherapy (3 cycles of rituximab, cyclophosphamide, doxorubicin hydrochloride, vincristine and prednisone (R-CHOP), 1 of R-high dose cyclophosphamide [R-CTX], 2 cycles of R-high dose cytarabine [R-HD-ARAC]) followed by ASCT (supplemental Figure 1). The clinical trial, as well as the MRD study, were approved by the ethics committees of all the enrolling centers. All patients provided written informed consent for the use of their biological samples for research purposes, in accordance with institutional review board requirements and the Declaration of Helsinki. Clinical results of the trial have been published elsewhere.4 One of the secondary endpoints of the trial was to assess the prognostic impact of MRD analysis and disease kinetics by RQ-PCR on the median time to progression (TTP), as well as to evaluate the activity of LEN on MRD. Therefore, a systematic, rigorous MRD monitoring plan was predefined from the start of the study: all the samples were centralized for MRD analysis in the hematological laboratory of Torino University, which since 2009 has been an active member of the EuroMRD standardization group (https://www.euromrd.org/usr/pub/pub.php), and where multilaboratory quality control rounds are performed twice a year on follicular and mantle cell lymphoma samples.
Biological samples
BM and PB were collected in sodium citrate and lithium heparin, respectively, at diagnosis and at follow-up (FU) according to the following clinical restaging time points (supplemental Figure 1): (1) the induction phase after R-CTX; (2) the consolidation phase after R-HD-ARAC; (3) post-ASCT; (4) during LEN or OBS, every 6 months (M6-12-18-24); and (5) during FU (M30-36).
At baseline, 4-color flow cytometry (FC: CD19, CD5, λ, and κ chains) was performed to assess tumor infiltration in both BM and PB samples. Mononuclear cells were recovered at every time point using Ficoll Histopaque (Sigma-Aldrich/Merck, Darmstadt, Germany) stratification and red blood cell lysis (in NH4Cl solution, pH 7) was performed as described.13 Whenever available, CD19+ cells were sorted from BM and then used to set a standard curve to quantify MRD by RQ-PCR (49 out of 176 cases).
Genomic DNA was extracted using both DNAzol reagent (Life Technologies, Carlsbad, CA)14 and a Maxwell semiautomated extraction instrument (Promega, San Francisco, CA). DNA quantity (ng) and purity (odds ratio A260/A280 and A260/A230) were evaluated by use of a NanoDrop2000 Spectrophotometer (Thermo Scientific, Waltham, MA), and housekeeping gene (TP53 exon 8) control amplification was performed to check DNA quality.15
MRD analysis
Per protocol, molecular markers for MRD monitoring were investigated at baseline in BM and/or in PB, starting from the most infiltrated tissue. In case of failure, the other tissue was also screened. Briefly, 500 ng − 1 ug of DNA was used to detect immunoglobulin heavy chain (IGH) clonal rearrangements and the BCL1/IGH major translocation cluster (MTC) using seminested and an IGH-VH–screening PCR, as published.16-19 Positive PCR signals were directly sequenced using the Sanger approach; rearranged MTC and IGH sequences were annotated using Blast (https://blast.ncbi.nlm.nih.gov/Blast.cgi)20 and IMGT (http://www.imgt.org/IMGT_vquest/input).21
Per protocol, MRD was first analyzed using nested qualitative PCR on BM and PB samples and then, if adequate leftover DNA was available, by RQ-PCR. Qualitative MRD based on BCL1/IGH translocation was performed using the seminested approach employed in the marker screening22 while, for BCL1/IGH RQ-PCR, a patient-specific forward primer, annealing at the MTC breakpoint and random nucleotide sequence insertion (N insertion) point, and a JH consensus probe and reverse primer were designed.19
On the other hand, IGH clonal rearrangements were monitored using allele-specific oligonucleotide (ASO) primers. Briefly, qualitative MRD monitoring was performed using the nested PCR approach as follows: in the first round, IGH rearrangements were amplified using the same primers used for marker identification, while in the second PCR, patient-specific primers complementary to the VH-CDR2 and VH-CDR3 regions and thus including the clonal patient-specific N insertions were employed.16 RQ-PCR was set up using the primers used in the nested PCR, with an additional consensus IGH probe directly targeting the FR3 (framework region 3).6,18,23 Overall, for each FU sample, 500 ng of BM and PB DNA were analyzed in triplicate, and the results were normalized based on the RNAse P gene value (Thermo Fisher). The assays were established to reach a sensitivity of 1 × 10⁻⁵, tested by analyzing 10-fold serial dilutions from diagnostic samples in polyclonal DNA derived from pooled mononuclear cells of healthy donors. For determining the quantitative MRD levels, target copy numbers were related to the number of target copies at diagnosis. RQ-PCR results were evaluated according to the criteria of the EuroMRD standardization group.10
Statistical analysis and concepts of MRD kinetics
The prognostic role of MRD analysis was evaluated with respect to TTP, calculated from the time of each MRD determination until progression or death as a result of lymphoma, and estimated using the Kaplan-Meier method. Survival analyses were performed using both univariate (UV) and multivariate (MV) Cox modeling: the variables showing a P < .2 after UV were selected for the MV. Statistical analysis was carried out using R v 4.0.0 and STATA 14.0.
Since MRD status was updated several times during the FU, the effect of MRD positivity on TTP was evaluated using different landmark analyses according to the time points of determination (R-CTX, R-HD-ARAC, post-ASCT, M6, and M12). A comprehensive analysis including the whole FU was also performed using an alternative approach to landmark analysis to prevent the immortal time bias, considering MRD positivity as a time-dependent variable and splitting patient FU time across multiple records based on the date of each MRD determination. As a consequence, the MRD status of each patient was updated according to the date of each determination. The MRD positivity effect on TTP was then estimated using the Cox model, adjusting for the MIPI (Mantle Cell Lymphoma International Prognostic Index) score. Always considering it as a time-dependent variable, a potential time-varying effect of MRD positivity during the FU was also explored with flexible parametric survival models24 by including in the model an interaction term between the MRD positivity variable and a restricted cubic spline of the log of time. In order to not overestimate the predictive ability of MRD status with respect to disease progression, determinations performed within 60 days of the last FU for TTP were not used to establish the MRD positivity of patients.
The discrimination ability of Cox models that include MRD determinations as a time-dependent variable (updating the status at each new determination as described above) was evaluated through a comparison with Cox models based on a single MRD assessment performed after ASCT and after M6, adjusting all models for MIPI and measuring TTP from the date of M6 determination. In detail, a series of time-varying areas under the curves (AUCs) were estimated over FU time for each model, describing the ability of the models to correctly classify patients who progress according to the incident/dynamic approach proposed by Heagerty and Zheng.25 AUCs were estimated at the time of each TTP event using the risksetAUC function of R (package risksetROC),26 censoring the follow-up of each patient at 7 months from the last MRD determination.
Results
Overall feasibility of MRD analysis
From 2010 to 2015, 300 MCL patients were enrolled in the MCL0208 trial: >99% of baseline samples were successfully centralized to the MRD laboratory. During treatment and the FU period, 1184 BM and 1170 PB samples were collected from this series, with a compliance range of 90% to 95% within the post-ASCT time point to 65% to 70% during the latest time points (supplemental Table 1).
The detection of a suitable molecular marker for MRD was possible in 250 of 300 (83%) cases. Of these 250 patients, 16 (6%) had no FU samples because of early treatment interruption. Of the other patients, 225 had diagnostic material available to set a standard curve for RQ-PCR, and 184 (82%) had an acceptable standard curve according to the EuroMRD guidelines.10 Of these, 176 patients (96%) had ≥1 FU sample available for MRD analysis by RQ-PCR (supplemental Figure 2). On the other hand, 58 patients (25%) were eventually evaluable only by nested PCR. Overall, a total of 2351 nested PCR- and 2000 RQ-PCR–evaluable results were generated.
Molecular markers and baseline tumor infiltration
Of the 250 patients with an available molecular marker for MRD analysis, 58 (23%) presented both IGH and BCL1/IGH, 153 (61%) IGH only, and 39 (16%) BCL1/IGH only. In this subcohort of 250 patients, we observed 98 TTP events. The “no marker” and “BCL1/IGH only” patients showed significantly lower tumor infiltration of baseline samples than the other groups by both BM histology and FC of BM (median 1% vs 12%; P < .001) and PB (0.7% vs 7%; P < .001), as well as more favorable baseline clinical features: less stage IV and bulky disease, as well as lower ECOG PS (Eastern Cooperative Oncology Group Performance Status) and MIPI scores (supplemental Table 2). Accordingly, TTP was significantly favorable in these groups (3-year TTP 86% vs 65%; P = .002) (supplemental Figure 3). When both markers were available, IGH rearrangement was preferentially used for MRD analysis.
MRD results by method and tissue
MRD assessment by nested PCR showed progressive disease clearance at each chemoimmunotherapy block. The MRD negativization rate in BM rose from 30% (27 of 224) after R-CTX to 53% (98 of 183) after R-HD-ARA-C (P < .001) and then to 56% (101 of 181) after ASCT. Interestingly, a deeper MRD clearance was observed in PB compared with paired BM samples (47% [103 of 220] vs 79% [147 of 185] and 82% [146 of 179] at the same time points, respectively). On the other hand, from 6 months after ASCT onwards (M6), the absolute number of patients still in clinical response and MRD-negative tended to progressively decrease over time, as expected in MCL (Figure 1A-B).
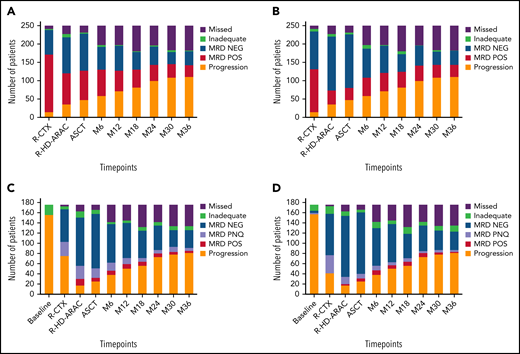
Molecular negativization rates. Results were obtained by nested PCR in (A) BM and (B) PB and by RQ-PCR in (C) BM and (D) PB. NEG, negative; PNQ, positive not quantifiable; POS, positive; R-CTX, rituximab-cyclophosphamide; R-HD-ARA-C, rituximab-high dose cytarabine.
Molecular negativization rates. Results were obtained by nested PCR in (A) BM and (B) PB and by RQ-PCR in (C) BM and (D) PB. NEG, negative; PNQ, positive not quantifiable; POS, positive; R-CTX, rituximab-cyclophosphamide; R-HD-ARA-C, rituximab-high dose cytarabine.
The results of the analysis of MRD clearance by RQ-PCR at different time points followed trends very similar to that of the nested PCR, again with lower clearance in BM than in PB. In detail, MRD negativity rates after R-CTX, R-HD-ARA-C, and ASCT were 36% (52 of 145) and 49% (67 of 137), 74% (88 of 119) and 88% (107 of 121), and 83% (99 of 120) and 91% (111 of 122), respectively (P < .05). Again, from M6 onwards, a trend toward MRD negativity exhaustion was observed, including up to 30% of the entire series after 36 months (Figure 1C-D). It is interesting to note that from the R-HD-ARA-C time point on, most of the positive samples (50% to 75%) scored as “positive not quantifiable.”10
Predictive value of MRD analysis by comparison of techniques, tissues, markers, and time points
Given the large availability of paired MRD data from different techniques (nested vs RQ-PCR), tissues (BM vs PB), markers (IGH vs BCL1/IGH), and time points, a systematic analysis comparing outcome predictions was performed using a time-varying covariate approach, adjusted for the MIPI score of the patient (Table 1). The average risk of progression in the FU period after a positive MRD result by RQ-PCR was higher than that after a positive nested PCR result (HR in BM 3.75 vs 2.19, respectively) (see also supplemental Figure 4), as well as higher in BM than PB (HR by RQ-PCR, 3.75 vs 2.33, respectively) (Table 1).
Survival analysis according to time-varying MRD positivity (BM and PB)
| TTP risk based on punctual MRD determination by nested and RQ-PCR in BM and PB samples | ||||||
|---|---|---|---|---|---|---|
| BM | PB | |||||
| TTP | HR | 95% CI | P value | HR | 95% CI | P value |
| Nested PCR | 2.19 | (1.10-4.35) | .025 | 1.83 | (1.14-2.94) | .013 |
| RQ-PCR | 3.75 | (2.37-5.93) | <.001 | 2.33 | (1.46-3.70) | <.001 |
Analyses were performed with Cox proportional-hazard models on subjects with available information for both nested and RQ-PCR (166 subjects with 782 determinations for BM and 166 subjects with 761 determinations for PB).
Regarding the predictive value of different time points, in the landmark analysis, we found that the risk of relapse gradually increased, along with the persistence of MRD positivity in BM by RQ-PCR during therapy. The TTP HR for patients still MRD-positive was 1.50 (95% confidence interval [CI], 0.94-2.37; P = .086) after R-CTX; 1.81 (95% CI, 1.02-3.20; P = .043) after ASCT; 3.83 (95% CI, 1.92-7.62; P < .001) at M6; and 5.60 (95% CI, 2.68-11.7; P < .001) at M12, respectively (Table 2 and Figure 2). These results were independent of the clinical complete or partial response status registered at each time point. Currently, events are still too few for meaningful survival evaluations at later time points.
Survival analysis according to time-varying MRD positivity (time points)
| TTP risk for MRD positivity by RQ-PCR in BM at different time points | |||
|---|---|---|---|
| TTP | |||
| RQ-PCR POS in BM (subjects) | HR | 95% CI | P value |
| R-CTX (#167) | 1.50 | (0.94-2.37) | .086 |
| R-HD-ARAC (#141) | 1.50 | (0.86-2.62) | .2 |
| Post-ASCT (#138) | 1.81 | (1.02-3.20) | .043 |
| M6 (#99) | 3.82 | (1.92-7.62) | <.001 |
| M12 (#90) | 5.60 | (2.68-11.7) | <.001 |
M6, 6 months from transplant; M12, 12 months from transplant.
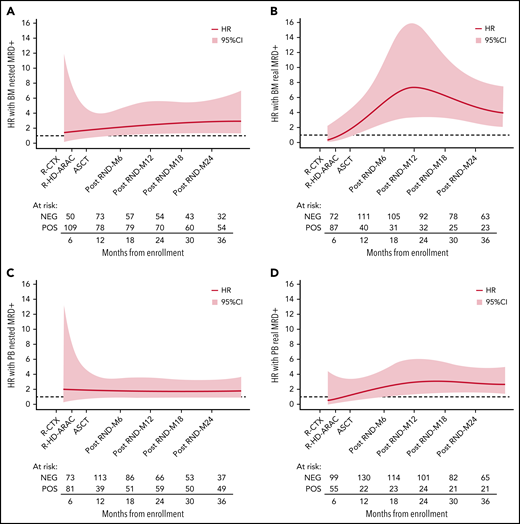
Effect of MRD positivity on TTP HR over time. Flexible parametric survival models with time-varying effect modeled using the restricted cubic spline transformation of time at different time points: BM by (A) nested PCR and by (B) RQ-PCR; PB by (C) nested PCR and by (D) RQ-PCR. M, months after ASCT; R-CTX, rituximab-cyclophosphamide; R-HD-ARAC, rituximab-high dose cytarabine.
Effect of MRD positivity on TTP HR over time. Flexible parametric survival models with time-varying effect modeled using the restricted cubic spline transformation of time at different time points: BM by (A) nested PCR and by (B) RQ-PCR; PB by (C) nested PCR and by (D) RQ-PCR. M, months after ASCT; R-CTX, rituximab-cyclophosphamide; R-HD-ARAC, rituximab-high dose cytarabine.
As an example of the predictive value of MRD analysis by RQ-PCR and nested PCR in different tissues at different time points, some illustrative Kaplan-Meier plots are shown in Figure 3 and supplemental Figure 4.
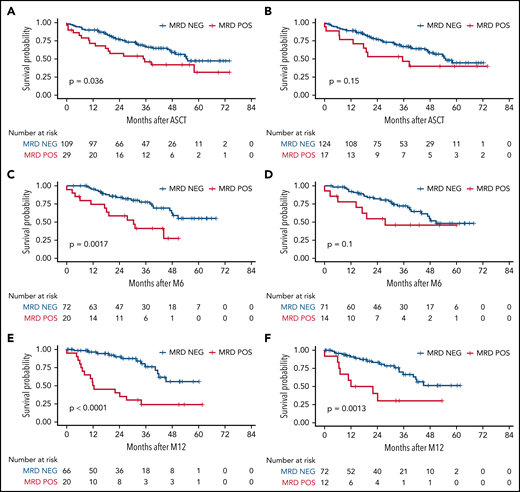
MRD impact on TTP, measured by RQ-PCR. Timepoints after ASCT, M6, and M12 were measured in BM (A,C,E, respectively) and in PB (B,D,F, respectively). M6, 6 months from transplant; M12, 12 months from transplant; NEG, negative; POS, positive.
MRD impact on TTP, measured by RQ-PCR. Timepoints after ASCT, M6, and M12 were measured in BM (A,C,E, respectively) and in PB (B,D,F, respectively). M6, 6 months from transplant; M12, 12 months from transplant; NEG, negative; POS, positive.
Finally, among the 58 patients harboring both IGH and BCL1/IGH markers, no statistically significant difference in the predictive values of the markers detected by nested PCR was observed (data not shown).
Overall, the TTP predictive value of an MRD-positive result at M6 (by RQ-PCR in BM) was independent of the common outcome predictors (including Ki67), according to MV Cox models (HR, 7.80; 95% CI, 3.05-20.0; P < .001) (Table 3).
Multivariate analysis: MRD values measured by RQ-PCR in BM as a single “punctual” time point
| TTP | |||
|---|---|---|---|
| Variables | HR | 95% CI | P value |
| MIPI intermediate vs low | 0.67 | (0.27-1.70) | .4 |
| MIPI high vs low | 0.81 | (0.27-2.41) | .7 |
| Ki67 ≥30% | 4.37 | (1.74-11.0) | .002 |
| PR after ASCT | 4.18 | (1.31-13.3) | .015 |
| MRD POS at M6 | 7.80 | (3.05-20.0) | <.001 |
M6, 6 months from transplant; MRD POS, positive minimal residual disease; PR, partial response.
84 randomized patients, landmark analysis starting from 6 months from transplant.
MRD kinetics
Because no single time point could provide a comprehensive portrait of the entire MRD history of each patient, we considered the results of ≥2 consecutive time points (ASCT, M6, and M12) at the same time rather than focusing on the analysis of each time point. MV analysis confirmed that a kinetic MRD approach, considering either MRD persistent positivity (HR, 6.93; 95% CI, 1.74-27.6; P = .006) or an alternating MRD pattern after ASCT (HR, 5.51; 95% CI, 2.02-15; P < .001), outperformed CR as a predictor of TTP (Table 4). Accordingly, patients falling in the “alternating” group between ASCT and M12 (ie, either “pos/neg” or “neg/pos”) showed a similar outcome to persistently positive ones (3-year TTP 40% vs 41%, respectively; P = ns) (supplemental Figure 5). Actually, the accumulation of negative time points was concordant between PB and BM (when both available) in 70% of cases by RQ-PCR. Among the discordant cases, however, we observed a significant reduction in the TTP risk compared with double positivity, with an HR of 0.43 (P = .003).
Multivariate analysis: MRD values measured by RQ-PCR in BM as MRD kinetics
| TTP | |||
|---|---|---|---|
| Variables | HR | 95% CI | P value |
| MIPI intermediate vs low | 0.68 | (0.241-1.99) | .5 |
| MIPI high vs low | 0.78 | (0.26-2.36) | .7 |
| Ki67 ≥30% | 2.27 | (0.92-5.61) | .075 |
| PR after ASCT | 4.74 | (1.02-21.9) | .046 |
| Alternating MRD after ASCT (vs persistently MRD NEG after ASCT, M6 and M12) | 5.51 | (2.02-15.0) | <.001 |
| Persistently MRD POS after ASCT (vs persistently MRD NEG after ASCT, M6 and M12) | 6.93 | (1.74-27.6) | .006 |
M6, 6 months from transplant; M12, 12 months from transplant; MRD NEG, negative minimal residual disease; MRD POS, positive minimal residual disease; PR, partial response.
78 randomized patients, landmark analysis starting from 12 months from transplant.
Starting from these considerations, in an effort to comprehensively capture the entire MRD history of a patient, a predictive model was implemented based on the calculation of time-varying AUCs. Both tissues and both techniques were considered (Figure 4): the BM RQ-PCR kinetics model (in yellow) outperformed in terms of TTP (AUC, 0.85-0.87), not only the classical MIPI (AUC, 0.60-0.63, in red) but also a composite model combining both MIPI and MRD single-timepoint analysis, either at the post-ASCT (AUC, 0.62-0.65, in black) or at the M6 time point (AUC, 0.74-0.77, in light blue), as shown in Figure 4B. Interestingly, this kinetic model greatly improved the predictive impact of MRD determinations in PB, up to an AUC of 0.81 (Figure 4D). Finally, similar but less pronounced trends were also registered for nested PCR determinations (Figure 4A,C).
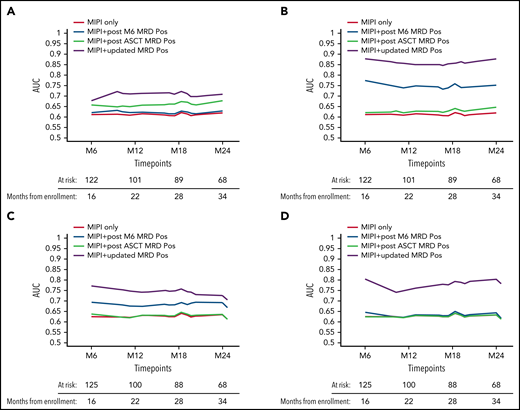
Time-varying AUCs of TTP. MIPI only (red) and different MIPI-adjusted kinetic MRD models are shown: BM by (A) nested PCR and by (B) RQ-PCR, PB by (C) nested PCR and by (D) RQ-PCR. M6, 6 months from transplant; MRD POS, positive minimal residual disease.
Time-varying AUCs of TTP. MIPI only (red) and different MIPI-adjusted kinetic MRD models are shown: BM by (A) nested PCR and by (B) RQ-PCR, PB by (C) nested PCR and by (D) RQ-PCR. M6, 6 months from transplant; MRD POS, positive minimal residual disease.
The TTP risk seemed to trend downward over time, according to the accumulation of MRD-negative results, independently from the single time point considered. The presence of 2 or 3 consecutive MRD-negative results conferred a significantly reduced risk of relapse, refining the risk stratification of MRD negativity at a single time point (supplemental Table 3). In detail, the TTP HR was 0.42 (P = .015) for a single negative time point in BM, 0.39 (P = .009) for 2 consecutive negative results, and 0.16 (P < .001) for ≥3. Interestingly, a peculiar trend was observed in PB, where a more stable MRD-negative pattern was needed to predict a significantly better TTP (supplemental Table 3).
Impact of LEN maintenance on MRD kinetics
Among the 92 randomized patients with available and complete MRD monitoring, almost half (42) showed alternating MRD results by RQ-PCR in BM after ASCT, and in most (38), this happened within M12 (supplemental Figure 6). This phenomenon was evident in both randomization arms even though, overall, slightly fewer LEN than OBS patients experienced MRD reappearance (n = 9 vs 15). No clear impact of LEN dose intensity on MRD kinetics was demonstrated (supplemental Figure 7).
Interestingly, patients who were still MRD-positive after ASCT and receiving LEN showed TTP comparable to those who were MRD-negative (Figure 5A). Nevertheless, the persistence of MRD positivity after 1 year of LEN (M12) was again associated with worse TTP (Figure 5B).
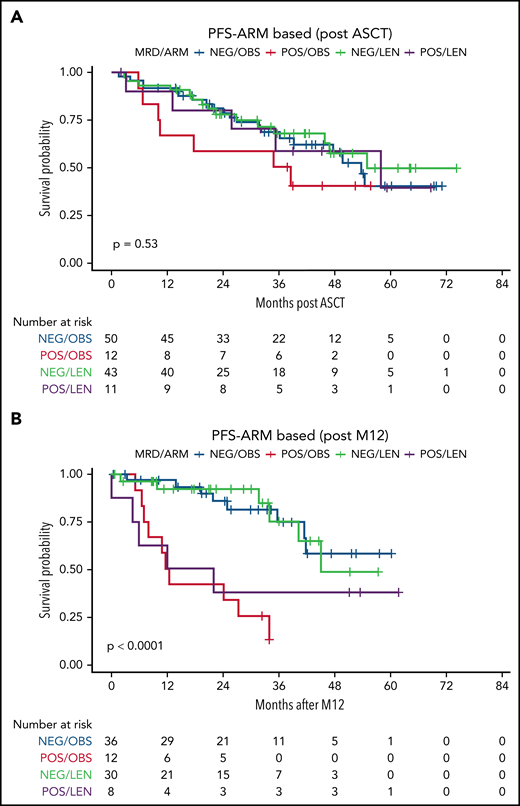
MRD impact on TTP, stratified by randomization arm. MRD was measured by RQ-PCR in BM at different time points: here, the time points after (A) ASCT and (B) M12 are shown. M12, 12 months from ASCT; NEG, negative; POS, positive.
MRD impact on TTP, stratified by randomization arm. MRD was measured by RQ-PCR in BM at different time points: here, the time points after (A) ASCT and (B) M12 are shown. M12, 12 months from ASCT; NEG, negative; POS, positive.
Discussion
Here we report the results of a comprehensive single, “punctual” time point and kinetic MRD analysis from an MCL phase 3 prospective trial. This study is more systematic than previous reports in the field, covering different PCR-based techniques, molecular markers, and target tissues. Moreover, MRD data were derived from multiple well-defined time points and analyzed using both punctual and kinetic approaches. The main findings are the following:
- 1)
MRD analysis is a powerful prognosticator in MCL;
- 2)
ASO RQ-PCR is the most reliable MRD technique in terms of outcome prediction, even if characterized by lower applicability than nested PCR;
- 3)
MRD analysis is most predictive starting 6 months after ASCT, even if MRD has a clinical impact right after ASCT;
- 4)
BM appears to be superior for MRD single-timepoint analysis, especially at early time points, but PB is a highly reliable tissue source at later time points, and its value is greatly increased when considered in the context of kinetic analysis. Given its superior practicability, it should be deemed the most appropriate source for long-term and repeated MRD monitoring;
- 5)
A time-varying kinetic model, based on the combination of regularly updated MRD results and MIPI, is the best way to exploit the bulk of information generated by MRD analysis and provides a powerful risk stratification tool suitable for MRD-guided treatment.
MRD analysis by ASO RQ-PCR has been validated as a predictive tool in many lymphoproliferative diseases,18,19,27 but published data on large lymphoma cohorts (particularly in MCL) have so far been limited to single MRD techniques, single tissues, and a few time points.6,7,28,29 Overall, our data are in line with the published literature, both in the high degrees of MRD clearance after R-HD-ARA-C and ASCT, especially in PB, and in outcome prediction.6-9,28,29 To date, probably the most complete published MRD data sets are those from the Youngers and Elderly trials of the European MCL Network.6 Even if prospective and standardized, these RQ-PCR results are usually derived from merged tissues (mainly PB), and systematic comparison between BM and PB samples at different time points (as well as between IGH and BCL-1/IGH markers) is lacking. Moreover, MRD data from the LyMA phase 3 trial, which have so far been presented only in abstract form,9 are focused on only 2 early time points (before and after ASCT) and are not conclusive regarding the prognostic value of MRD after ASCT, as very few MRD-positive results were recorded. On the other hand, the phase 2 Nordic trials described highly predictive MRD data from a selection of patients derived from 2 phase 2 studies. The analysis comprised a considerable clinical FU, but the MRD results were obtained only by nested PCR, and the analysis was not conducted on multiple, fixed, preplanned time points without discrimination between PB and BM-derived results.7 Finally, other small prospective published series have yielded discordant results between analyzed tissues.8
Our comprehensive work provides a definitive answer to many still unsolved issues: in our hands, BM is more predictive than PB, but this advantage is prominent only at early time points, possibly because of rituximab-induced clearance of MCL cells. Moreover, as a general rule, later time points were more informative than early ones, and RQ-PCR was more reliable than nested PCR.
From a technical point of view, our data stand out as a validation of the standardized EuroMRD method in MCL,6 showing in direct comparison that the results of RQ-PCR are more predictive than those of nested PCR and more easily comparable to published data, even if they are, overall, applicable to fewer patients. From these data emerged that the predictive value of RQ-PCR was always higher than nested PCR MRD results, and this is mainly due to the better reproducibility of the first approach, derived from the higher standardization degree reached in the context of the EuroMRD group. Novel MRD techniques such as droplet-digital PCR30,31 and NGS (under development both in the context of EuroMRD and in our research group)11,31 promise increased applicability of MRD monitoring in MCL, but sound translational results with clinical impact are still to come.
Most importantly, our data reveal that MRD in MCL should be approached in a kinetic manner. Many efforts have been spent in different trials to identify the best-performing MRD time point in terms of outcome prediction: MRD before or after consolidation or acquired during the first year after consolidation has been proposed by different authors.6-9,32 Unfortunately, given the different induction regimens employed in these MCL trials, a direct comparison of MRD time points might be difficult across studies. We might hypothesize that the suboptimal predictive value of pre-ASCT MRD determinations in our trial (Table 4) is due to a different efficacy profile of single-agent ARAC that might have an immediate but less durable cytoreductive action if compared with a combination including an alkylating agent (ie, dexamethasone high-dose cytarabine cisplatin, DHAP).
Even though, in our hands, MRD results at M6 showed the best predictive value as a single time point in terms of TTP prediction, it is hardly conceivable that a single MRD time point could capture the entire natural history of a chronic and complex disease such as MCL. Thus, starting from simple MRD “accumulation patterns”33 (supplemental Figure 5), we have developed a dynamic model encompassing both MIPI and a time-varying, regularly updated MRD analysis, taking particularly into account the dismal prognostic value of MRD reappearance after treatment termination (most familiar in chronic myelogenous leukemia34 and acute lymphoblastic leukemia35). This kinetic model outperformed static predictive models in terms of AUROC (Figure 4). Therefore, our data highlight the importance of taking a systematic, repeated MRD monitoring approach in the management of MCL patients rather than focusing on a single extemporaneous MRD time point. This approach is further strengthened by the observation that, in the context of a carefully conducted kinetic analysis, PB might represent a fully adequate tissue source, sparing patients from undergoing repeated BM examinations. In this regard, we might hypothesize that eventual residual tumoral cells, hidden in a reservoir right after treatment, start to recirculate in the bloodstream some months after the end of therapy and thus could be more easily detected by the MRD assay.
We are aware that the application of a kinetic model might appear complex in clinical practice. To overcome this limitation, we are developing a freely available web-based tool that will allow a quick calculation of individual patient risk of relapse based on his/her MRD history (https://filinf.it/MRD).
Finally, to our knowledge, this is the first study investigating the role of MRD in the context of maintenance treatment in MCL, even if our randomized series is limited. The FIL MCL0208 clinical trial showed a PFS advantage of LEN compared with OBS.23 Here, we add the observation that fewer relapses among MRD-positive patients were registered in the LEN arm (Figure 5A and supplemental Figure 6). Moreover, MRD analysis preserved its predictive value during LEN, but its impact was modulated by maintenance therapy. Interestingly, the biological effect of LEN seemed to be mostly exerted during the first year of maintenance. Accordingly, patients who were MRD-positive after ASCT showed a better outcome (not significantly different from MRD-negative ones) if they received LEN. Nonetheless, patients remaining MRD-positive or converting to MRD positivity after 1 year of LEN showed poor outcomes similar to those of MRD-positive patients in OBS (Figure 5). This phenomenon, recently observed in another trial (exploring lenalidomide and rituximab as maintenance treatment),36 might be partly explained by the high rate of LEN discontinuation (for reasons other than disease progression) among our patients after M12 (50%),4 as well as by the exhaustion of LEN efficacy in some cases. Interestingly, such a phenomenon was not reported by the MRD substudy of the LyMa trial, exploring rituximab as a post-ASCT maintenance treatment, probably suggesting a wider efficacy of this drug across all patient subgroups.9 Finally, we were not able to identify clear correlations between LEN dose intensity and MRD kinetics, even though the limited number of patients provided with complete MRD and LEN dosage data (n = 45) hampered an accurate subgroup analysis of this phenomenon.
These modulating effects of maintenance therapy on MRD values need to be more extensively investigated in different maintenance contexts (eg, LEN,12 rituximab,9 and ibrutinib), but they might explain the suboptimal predictive role of punctual MRD analysis at very early time points in a small retrospective series of patients receiving rituximab maintenance.29 Finally, many additional biological factors could influence patient sensitivity to LEN, as suggested, for example, by the pharmacogenomics substudies from the present FIL MCL0208 trial.37
Conclusions
In conclusion, the data presented here stand out as a prospective and systematic validation of the predictive role of standardized ASO RQ-PCR MRD analysis in MCL and suggest that kinetic analysis is the most effective approach to predicting outcomes in MCL patients, as it is in most chronic neoplasms. Moreover, the kinetics issues raised by this manuscript deserve primary consideration, both in the analysis of MRD data of current trials and in planning future clinical studies of MCL patients, not only when conventional PCR-based approaches are employed but also when more sophisticated tools (such as NGS) will be successfully implemented.
Acknowledgments
The authors thank all the patients who participated in the study. The authors are grateful to Daniela Barbero, Luigia Monitillo, Pier Paola Fenoglio, Annalisa Cifaratti, Giulia Verardo, and Mariella Lo Schirico for their scientific advice and to Sonia Perticone, Antonella Ferranti, Daniela Gioia, Antonella Fiorillo, and Giulia Bondielli for their assistance.
This work was supported by: Progetto di Rilevante Interesse Nazionale (PRIN2009) from Ministero Italiano dell'Università e della Ricerca (MIUR), Roma, Italy (7.07.02.60 AE01); Progetto di Ricerca Sanitaria Finalizzata 2009 (RF-2009-1469205) and 2010 (RF-2010-2307262 to S.C.); A.O.S. Maurizio, Bolzano/Bozen, Italy, Fondi di Ricerca Locale, Università degli Studi di Torino, Italy; Fondazione Neoplasie Del Sangue (Fo.Ne.Sa), Torino, Italy; Fondazione CRT (project codes 2016.0677 and 2018.1284), Torino, Italy; Associazione DaRosa, Torino, Italy; the Gilead Fellowship Program 2019, Milano, Italy; and Cancer Research UK (C355/A26819) and FC AECC and AIRC under the Accelerator Award Program.
Authorship
Contribution: S.F., S.C., and M.L. conceived the study and designed the research; S.F., P.M.S., F.B., I.C., M.Z., C.C., V.P., M.P., F.R., S.H., G.M., N.C., C.G., A.M.L., S.C., and M.L. enrolled patients and provided biological samples; E.G., D.D., B.A., M.F., and B.M. performed experiments; S.F., D.G., E.G., G.M.Z., and M.G. collected and analyzed data; A.E. and G.D.L. performed statistical analysis; and S.F., D.G., E.G., B.A., and M.L. wrote the paper.
Conflict-of-interest disclosure: S.F.: Janssen (consultancy, advisory board, speaker’s honoraria, research funding); EUSA Pharma (consultancy, advisory board, speaker’s honoraria); Gilead, Morphosys (research funding); Incyte, Clinigen (advisory board); Servier, Gentili (speaker’s honoraria). The remaining authors declare no competing financial interests.
Correspondence: Simone Ferrero, Department of Molecular Biotechnologies and Health Sciences, University of Torino, Torino, Italy, SC Ematologia 1 U, AOU “Città della Salute e della Scienza di Torino”, via Genova 3, 10126 Torino, Italy; e-mail: simone.ferrero@unito.it.
The online version of this article contains a data supplement.
There is a Blood Commentary on this article in this issue.
The publication costs of this article were defrayed in part by page charge payment. Therefore, and solely to indicate this fact, this article is hereby marked “advertisement” in accordance with 18 USC section 1734.

This feature is available to Subscribers Only
Sign In or Create an Account Close Modal