

Key Points
Noncoding mutations occur preferentially in active enhancers in APL.
Recurrent noncoding somatic mutations and germline variants converge to decrease WT1 expression by disrupting MYB binding.

Abstract
Genetic alternations can occur at noncoding regions, but how they contribute to cancer pathogenesis is poorly understood. Here, we established a mutational landscape of cis-regulatory regions (CREs) in acute promyelocytic leukemia (APL) based on whole-genome sequencing analysis of paired tumor and germline samples from 24 patients and epigenetic profiling of 16 patients. Mutations occurring in CREs occur preferentially in active enhancers bound by the complex of master transcription factors in APL. Among significantly enriched mutated CREs, we found a recurrently mutated region located within the third intron of WT1, an essential regulator of normal and malignant hematopoiesis. Focusing on noncoding mutations within this WT1 intron, an analysis on 169 APL patients revealed that somatic mutations were clustered into a focal hotspot region, including one site identified as a germline polymorphism contributing to APL risk. Significantly decreased WT1 expression was observed in APL patients bearing somatic and/or germline noncoding WT1 variants. Furthermore, biallelic WT1 inactivation was recurrently found in APL patients with noncoding WT1 variants, which resulted in the complete loss of WT1. The high incidence of biallelic inactivation suggested the tumor suppressor activity of WT1 in APL. Mechanistically, noncoding WT1 variants disrupted MYB binding on chromatin and suppressed the enhancer activity and WT1 expression through destroying the chromatin looping formation. Our study highlights the important role of noncoding variants in the leukemogenesis of APL.
Introduction
Although noncoding regions account for >98% of the human genome, genetic alternations occurring at noncoding regions remain poorly understood in cancer pathogenesis. This is largely owing to the challenging interpretation of noncoding variants and the limited understanding of their functional consequences. Emerging evidence has revealed that most noncoding somatic mutations are passenger events without functional consequence.1,2 Therefore, it is essential to distinguish functional noncoding mutations from these passenger mutations.
Noncoding regions that contain gene regulatory elements are recognized as critical determinants of gene expression, namely cis-regulatory elements (CREs).3-5 These regulatory noncoding regions are bound by transcriptional regulators, such as transcription factors and coregulators. The dynamic interaction/dissociation between transcriptional regulators and CREs determines the transcriptional activity and chromatin conformations of nearby genes.6 Furthermore, recent studies have shown that pathogenic noncoding variants are often located in CRE regions and dysregulate gene expression through redepositing or reshaping cis-regulatory elements to promote malignant transformation.7-9 Thus, the identification of cancer-associated noncoding variants based on CREs can expand our understanding of the epigenetic control of malignancies.
Acute promyelocytic leukemia (APL) is pathologically characterized by the accumulation of promyelocytic blast cells in bone marrow and peripheral blood and cytogenetically depicted by a typical t(15;17) translocation in most patients. Mounting evidence has demonstrated that the PML/RARα fusion protein, generated by t(15;17), mainly impairs neutrophil differentiation.10 However, accumulating data suggest PML/RARα alone is not sufficient to cause APL, and multiple genetic events are required for the development of APL.11-13 However, current knowledge on genetic events contributing to APL development is singularly restricted to mutations in coding regions, with the most recurrently found in FLT3, WT1, and RAS (N-RAS and K-RAS).14-16 There is unmet need for systematic discovery of noncoding mutations/variants in the APL genome, advancing our understanding of APL pathogenesis.
The Wilms tumor 1 (WT1) gene encodes a zinc-finger transcription factor (TF), an important regulator of normal and malignant hematopoiesis. The role of WT1 is dynamic and context dependent. During normal hematopoiesis, WT1 in early undifferentiated cells is essential for the survival or the quiescence of uncommitted cells, but in committed cells, WT1 is critical for differentiation.17 In leukemogenesis, the investigation of WT1 is of a particular challenge because both overexpression and loss-of-function coding mutations are found in patients. On the one hand, WT1 expression has been reported to be of prognostic importance, with higher levels associated with relapse and poor overall survival.18 On the other hand, coding WT1 mutations are predominantly nonsense and frameshift, resulting in loss-of-function truncated proteins. WT1 mutations are mutually exclusive with TET2 and IDH1/2 mutations, establishing an epigenetic function of WT1.19,20 Furthermore, mice studies have shown that Wt1 haploinsufficiency can enhance the self-renewal capacity of hematopoietic stem and progenitor cells and cooperate with FLT3-internal tandem duplication to induce leukemogenesis.21 In APL, WT1 is one of the most frequently mutated genes, and the prevalence of coding mutations is even higher than that in other hematological malignancies.14 These coding alterations show a high incidence in relapsed APL patients.16
Here, we systematically analyzed noncoding mutations that mapped to regulatory regions using whole-genome sequencing (WGS) and regulome profiling in primary APL samples. Among mutated CREs, we found a frequently mutated focal region within the third intronic enhancer of WT1. Further analysis demonstrated that these noncoding somatic and/or germline WT1 variants diminished the MYB binding of the WT1 intronic enhancer and the enhancer-promoter interactions to decrease WT1 expression in APL cells.
Methods
Patient samples
This study was approved by the institutional review board from Ruijin Hospital affiliated to Shanghai Jiao Tong University School of Medicine. The written informed consent was obtained from all participants. This study was also reviewed by the Chinese Ministry of Science and Technology for the Review and Approval of Human Genetic Resources (approval no. 2021BAT4751). We included 169 APL patients between 18 and 77 years of age. Tumor samples were obtained from bone marrow collected at diagnosis. For paired normal samples, 149 of 169 were extracted from peripheral blood or bone marrow of the remission stage from the same patient. For those suffering from early death (20/169), paired normal samples were extracted from their hair follicles.
Calling somatic mutations
Somatic single nucleotide variants (SNVs) and small insertions and deletions (INDELs) were called using GATK Mutect2,22 Strelka,23 VarScan2 2.4.1,24 and VarDict 1.5.1.25 For SNVs, SomaticSniper 1.0.5.026 and MuSE 1.027 were also used. Each variant caller was run using default parameters or according to those recommended by the authors where available. Furthermore, somatic SNVs and INDELs identified by ≥2 somatic mutation calling tools were retained for subsequent analysis. All variants were annotated by Annovar.28
ChIP-seq peak calling
Peaks from chromatin immunoprecipitation sequencing (ChIP-seq) data were called using MACS2.29 A q value threshold of 0.01 was used to call peaks for transcription factor ChIP-seq data, and a P value cutoff of 1e-9 was used for histone modification ChIP-seq data.
Results
Comprehensive analysis identifies mutated noncoding regulatory regions in APL
CREs represent a group of functional sequences in the noncoding genome.30 To systematically identify APL-associated somatic noncoding mutations, we generated a mutational landscape of CREs by performing WGS and H3K27ac ChIP-seq on APL patients (Figure 1A, supplemental Table 1). First, we performed WGS analysis on paired tumor and normal samples from 24 APL patients (supplemental Table 2), identifying 49 705 somatic alterations with an average of 2071 alterations per patient (supplemental Table 3). Somatic SNVs were predominantly transitions (83%) (Figure 1B). As expected, the number of noncoding mutations outnumbered coding mutations (Figure 1C), with as high as 99% found in noncoding regions (Figure 1D).31 Next, we defined APL-associated CREs by performing H3K27ac ChIP-seq on 16 APL patients (10 also had WGS; supplemental Table 4). Our modeling analysis suggested that the number of identified CREs had reached ∼98% saturation with a sample size of 16 (Figure 1E; details in supplemental Methods). A total of 55 459 CREs were identified (supplemental Table 5). Finally, we obtained 2009 APL-associated mutated CREs by restricting those CREs with somatic mutations (supplemental Table 6). These mutated CREs were mainly located in intronic regions (56.6%), intergenic regions (24.5%), and promoter and 5′UTR regions (10.4%) (Figure 1F). To assess the functional relevance of CRE mutations, we performed functional enrichment analysis on mutated CREs in APL vs other types of hematopoietic malignancies and solid tumors (details in supplemental Methods; supplemental Tables 7 and 8). We found that GO terms related to myeloid leukemia, such as myeloid differentiation and neutrophil degranulation, were exclusively enriched in mutated CREs in APL, suggesting that these mutated CREs contributed to myeloid dysfunction (Figure 1G). Moreover, the hematopoietic-specific GO terms, such as those related to the regulation of hematopoiesis and immunity, were consistently enriched in hematopoietic malignancies (Figure 1G). The data suggested that somatic noncoding mutations on CREs were biologically meaningful in APL development.

Identification of mutated noncoding regulatory regions in APL by WGS and H3K27ac ChIP-seq data. (A) Schematic diagram for analyzing mutated CREs in APL. (B) The number of somatic single-nucleotide variants and short insertions/deletions in each patient. Different colors indicate different types of mutations. (C) Repartition of the 49 705 somatic mutations identified across the coding regions and noncoding regions. Each box plot represents the median, interquartile range, and minimum and maximum quartile of the mutation number. (D) Genomic localization of somatic mutations annotated using RefSeq hg38. (E) Saturation analysis for H3K27ac-positive regions identified from ChIP-seq across 16 APL samples. Individual points represent median peaks per sample added, and error bars represent standard deviations from the mean. (F) Genomic distribution of the mutated CREs over exons, promoter (-1 kb to +100 bp of the transcription start site), 3′UTR, 5′UTR, noncoding RNA (ncRNA), transcription termination site (TTS) (-100 bp to +1 kb of the TTS position), intron, and intergenic regions. (G) Enriched gene ontology (GO) terms within genes regulated by mutated CREs in APL compared with other types of hematopoietic malignancies and solid cancers. Other hematopoietic malignancies include chronic lymphocytic leukemia (CLLE) and malignant lymphoma (MALY). Solid cancers include bone cancer (BOCA), breast cancer (BRCA), liver cancer (LIRI), pancreatic cancer (PACA), pediatric brain cancer (PBCA), and prostate adenocarcinoma (PRAD). The variant call format files of WGS data for other cancer types were downloaded from the Pan-Cancer Analysis of Whole Genomes project, and the H3K27ac ChIP-seq data of these cancer types were downloaded from the Gene Expression Omnibus database. The bubble color indicates the P value. CDS, coding sequence.
Identification of mutated noncoding regulatory regions in APL by WGS and H3K27ac ChIP-seq data. (A) Schematic diagram for analyzing mutated CREs in APL. (B) The number of somatic single-nucleotide variants and short insertions/deletions in each patient. Different colors indicate different types of mutations. (C) Repartition of the 49 705 somatic mutations identified across the coding regions and noncoding regions. Each box plot represents the median, interquartile range, and minimum and maximum quartile of the mutation number. (D) Genomic localization of somatic mutations annotated using RefSeq hg38. (E) Saturation analysis for H3K27ac-positive regions identified from ChIP-seq across 16 APL samples. Individual points represent median peaks per sample added, and error bars represent standard deviations from the mean. (F) Genomic distribution of the mutated CREs over exons, promoter (-1 kb to +100 bp of the transcription start site), 3′UTR, 5′UTR, noncoding RNA (ncRNA), transcription termination site (TTS) (-100 bp to +1 kb of the TTS position), intron, and intergenic regions. (G) Enriched gene ontology (GO) terms within genes regulated by mutated CREs in APL compared with other types of hematopoietic malignancies and solid cancers. Other hematopoietic malignancies include chronic lymphocytic leukemia (CLLE) and malignant lymphoma (MALY). Solid cancers include bone cancer (BOCA), breast cancer (BRCA), liver cancer (LIRI), pancreatic cancer (PACA), pediatric brain cancer (PBCA), and prostate adenocarcinoma (PRAD). The variant call format files of WGS data for other cancer types were downloaded from the Pan-Cancer Analysis of Whole Genomes project, and the H3K27ac ChIP-seq data of these cancer types were downloaded from the Gene Expression Omnibus database. The bubble color indicates the P value. CDS, coding sequence.
Somatic noncoding mutations prefer to accumulate on chromatin bound by master transcription factors essential for APL
It is recognized that CREs may act as the regulatory platform enabling combinatorial regulations involving master transcription factors and coregulators.32,33 We then explored whether somatic noncoding mutations on CREs may affect the forming of the transcriptional regulatory complex in APL, and more specifically, which transcription factors are affected and how. Master transcription factors usually form the core transcriptional regulatory circuitry (CRC) (ie, constructing the tightly integrated networks to establish and maintain lineage-specific transcriptional programs and forming the interconnected feed-forward regulatory loops).34-36 To predict master transcription factors in APL, we constructed the CRC models using a CRC mapper algorithm35 based on the super-enhancer profiles of these 16 APL patients (details in supplemental Methods). As shown in Figure 2A, the master transcription factors captured in the CRC modeling were PML/RARα, SPI1 (PU.1), MYB, RUNX1, ETV6, IRF1, GFI1, KLF13, MEF2D, and NFE2. As expected, PML/RARα, the initiating oncogenic fusion protein in APL, contributed to form the master transcription factor–mediated complex in APL.10,37-39 PU.1, MYB, GFI1, RUNX1, and ETV6 are well-known transcriptional regulators for myeloid development. Their disruption has been reported to contribute to the malignant transformation of myeloid leukemia40-44, and NFE2, KLF13, and MEF2D are involved in the hematopoiesis, such as erythropoiesis and lymphopoiesis.45-47 To prove that mutated CREs are targeted by the above master transcription factors, we performed genome-wide occupancy analysis of MYB, GFI1, and PU.1 (ChIP-seq experiments, detailed in supplemental Methods) and the remaining TFs (based on the published ChIP-seq data).31,48-50 As shown in Figure 2B and supplemental Table 9, the binding regions for these master transcription factors were significantly enriched within the mutated CREs. Comparing mutated CREs vs nonmutated CREs, the motif enrichment analysis revealed the enrichment for DNA recognition motifs recognized by these transcription factors (Figure 2C), validating the findings obtained from ChIP-seq data (Figure 2B). These data indicated that somatic noncoding mutations preferred to accumulate on chromatin regions bound by master transcription factors essential for APL.

Somatic mutations in CREs prefer to accumulate on chromatin regions bound by master transcription factors essential for APL. (A) Master transcription factors identified by the CRC modeling using H3K27ac ChIP-seq data of 16 APL samples. (B) Enrichment of binding regions for master transcription factors within mutated CREs. The enrichment level of binding regions for the indicated transcription factor in mutated CREs was analyzed by the Fisher’s exact test. (C) Enrichment analysis of DNA recognition motifs for the identified master transcription factors within mutated CREs compared with nonmutated CREs. The position weight matrices of master transcription factors and their paralogs for motif enrichment analysis were downloaded from JASPAR (http://jaspar.genereg.net). The top 3 enriched motifs (JASPAR ID) for the indicated transcription factor family were listed (eg, MA0100.3, MA0776.1, and MA0777.1 for MYB, MYBL1, and MYBL2, respectively). Box plot represents the median, interquartile range, and minimum and maximum quartile from motif enrichment analysis of 200 random subsampling from background regions. (D) Mutation enrichment analysis for master transcription factors over binding regions centered on DNA recognition motifs and the surrounding area. Z scores are computed based on a permutation test, and the dashed line indicates a P value < .05 significance threshold. mutCRE, mutated CRE.
Somatic mutations in CREs prefer to accumulate on chromatin regions bound by master transcription factors essential for APL. (A) Master transcription factors identified by the CRC modeling using H3K27ac ChIP-seq data of 16 APL samples. (B) Enrichment of binding regions for master transcription factors within mutated CREs. The enrichment level of binding regions for the indicated transcription factor in mutated CREs was analyzed by the Fisher’s exact test. (C) Enrichment analysis of DNA recognition motifs for the identified master transcription factors within mutated CREs compared with nonmutated CREs. The position weight matrices of master transcription factors and their paralogs for motif enrichment analysis were downloaded from JASPAR (http://jaspar.genereg.net). The top 3 enriched motifs (JASPAR ID) for the indicated transcription factor family were listed (eg, MA0100.3, MA0776.1, and MA0777.1 for MYB, MYBL1, and MYBL2, respectively). Box plot represents the median, interquartile range, and minimum and maximum quartile from motif enrichment analysis of 200 random subsampling from background regions. (D) Mutation enrichment analysis for master transcription factors over binding regions centered on DNA recognition motifs and the surrounding area. Z scores are computed based on a permutation test, and the dashed line indicates a P value < .05 significance threshold. mutCRE, mutated CRE.
Next, to determine how somatic noncoding mutations affected these APL-associated master transcription factor complex, we evaluated the mutation burden on binding sites for each transcription factor. We calculated the mutation frequency over binding regions centered on DNA recognition motifs and the surrounding area. As shown in Figure 2D, master transcription factors bound on mutated CREs displayed 3 major patterns. First, APL-associated somatic noncoding mutations were significantly enriched at the binding sites of MYB, PU.1, and IRF1 (Z score = 8.12, 6.07, and 3.89, respectively: the left panel), all of which are known pioneer factors. These pioneer factors have been reported to be capable of accessing, opening silent or compacted chromatin, and recruiting downstream transcription factors to establish lineage-specific transcriptional programs.51-53 Second, a moderate enrichment was found on the 50- to 100-bp flanking regions of the binding sites of ETV6 and GFI1 (Z score = 3.10 and 2.56, respectively: the middle panel), suggesting their close interactions with the above pioneer factors. Third, no enrichment was observed for the remaining master transcription factors (ie, PML/RARα, RUNX1, MEF2D, KLF13, and NFE2 [the right panel]). It suggested that this group of transcription factors might act as transcriptional coregulators without directly binding to DNA, consistent with the previous findings from our group and others.39,54,55 Together, these results indicated that somatic noncoding mutations tended to target the motifs of IRF1, PU.1, and MYB and subsequently influenced the master transcription factor complex in APL.
Recurrent noncoding WT1 variants are found at both somatic and germline levels
It is well-recognized that functional somatic noncoding mutations should be observed recurrently and may exert impacts on expression and phenotype.56-58 Therefore, we further performed RNA-seq on APL patients with WGS data (supplemental Table 10) and searched for functional mutated CREs, considering (1) the recurrence occurring within a small region (ie, 50 bp), (2) the transcriptional outcome of the CRE mutation by comparing the expression levels of the respective target gene in mutated and nonmutated patients, and (3) the phenotypic relevance (details in supplemental Methods). Among mutated CREs, we identified 38 functional regions harboring somatic noncoding mutations, which affected the expression levels of leukemia-related genes, such as WT1, ETS1, PLCG2, PRKCB, PDGFA, and CD247 (Figure 3A; supplemental Figure 1; supplemental Table 11).

Recurrent noncoding somatic and germline variants are located in the third intron of WT1. (A) Top 6 functional regions harboring somatic noncoding mutations identified by the integrative analysis. The abscissa represents each patient, the ordinate represents candidate loci containing noncoding mutations for the indicated gene, the blue represents the sample with the specified mutation, and the gray represents the sample that does not contain the specified mutation. Also included is the log2 fold-change of associated genes by comparing the expression levels of respective target genes in mutated and nonmutated samples. (B) Detailed annotation of the recurrent somatic noncoding mutation-containing locus in the third intron of WT1. The H3K27ac peaks of each sample are shown as a transparent area plot. The thick line represents the median profile from all samples. The height of peaks from each sample was determined by the H3K27ac read density of the corresponding sample within the region. (C) Lollipop plot showing the distribution and classes of noncoding variants in the third intron of WT1. The red point represents the somatic mutation, and the blue point represents the germline mutation. The size of the point represents the number of a given mutation type. (D) Association of rs191528827 with APL risk. Upper panel: the bar plot shows the alternative allele frequency of rs191528827 in 169 APL patients of this study and a nontumor cohort in the ChinaMAP. Lower panel: the diamond-shaped point represents the odds ratio, and the error bar represents the 95% confidence interval of the odds ratio. CI, confidence interval; FC, fold change.
Recurrent noncoding somatic and germline variants are located in the third intron of WT1. (A) Top 6 functional regions harboring somatic noncoding mutations identified by the integrative analysis. The abscissa represents each patient, the ordinate represents candidate loci containing noncoding mutations for the indicated gene, the blue represents the sample with the specified mutation, and the gray represents the sample that does not contain the specified mutation. Also included is the log2 fold-change of associated genes by comparing the expression levels of respective target genes in mutated and nonmutated samples. (B) Detailed annotation of the recurrent somatic noncoding mutation-containing locus in the third intron of WT1. The H3K27ac peaks of each sample are shown as a transparent area plot. The thick line represents the median profile from all samples. The height of peaks from each sample was determined by the H3K27ac read density of the corresponding sample within the region. (C) Lollipop plot showing the distribution and classes of noncoding variants in the third intron of WT1. The red point represents the somatic mutation, and the blue point represents the germline mutation. The size of the point represents the number of a given mutation type. (D) Association of rs191528827 with APL risk. Upper panel: the bar plot shows the alternative allele frequency of rs191528827 in 169 APL patients of this study and a nontumor cohort in the ChinaMAP. Lower panel: the diamond-shaped point represents the odds ratio, and the error bar represents the 95% confidence interval of the odds ratio. CI, confidence interval; FC, fold change.
Given the critical and complicated role of WT1 in leukemia development, we sought to investigate in more detail the recurrent region harboring somatic noncoding mutations located in the WT1 third intron (Figure 3B; supplemental Figure 2; supplemental Table 12). Sanger sequencing validation in 169 APL patients (including 24 WGS cases) revealed 6 cases with somatic noncoding mutations (Figure 3C; supplemental Figure 3; supplemental Table 13). These mutations on the WT1 CRE were located within a very focal region (chr11:32421395-97) (ie, chr11:32421395 C>A [n = 1], chr1132421396 C>A [n = 1], chr11:32421397 G>T [n = 3], and chr11:32421397 G>A [n = 1]) (Figure 3C).
Of note, chr11:32421397 G>A, a germline polymorphism (rs191528827), was also present in 8 of 169 APL patients (4.73%) (Figure 3C; supplemental Figures 2 and 3; supplemental Tables 12 and 13). The allele frequency of this single nucleotide polymorphism (SNP) is 0.82% in the Chinese population (the China Metabolic Analytics Project, ChinaMAP) (supplemental Table 14).59 We then asked whether this germline variant is a risk-associated SNP in APL. Statistical analysis revealed a significant excess of this site in APL patients (odds ratio, 2.8902; 95% confidence interval, 1.4107-5.9209; Fisher’s exact test P value, .0091) (Figure 3D), suggesting that chr11:32421397 G>A was a newly identified risk variant for APL.
Noncoding WT1 somatic/germline variants lead to allele-specific loss of H3K27ac binding and allele-specific repression of WT1 expression
To investigate the epigenetic and regulatory impacts of noncoding WT1 somatic/germline variants on WT1 expression, we first analyzed the chromatin state of the surrounding region for H3K4me1, H3K4me3, H3K27ac, and H3K27me3 in hematopoietic cell lines. This region, marked by a high abundance of H3K4me1 and H3K27ac signals, was indeed an active enhancer in hematopoietic cell lines without these alterations, including NB4, K562, and Kasumi-1 cells (Figure 4A; supplemental Figure 4). Furthermore, luciferase reporter assays confirmed the enhancer activity of this region, and mutations mimicking noncoding WT1 somatic/germline variants observed in APL patients significantly impaired the enhancer activity (Figure 4B).
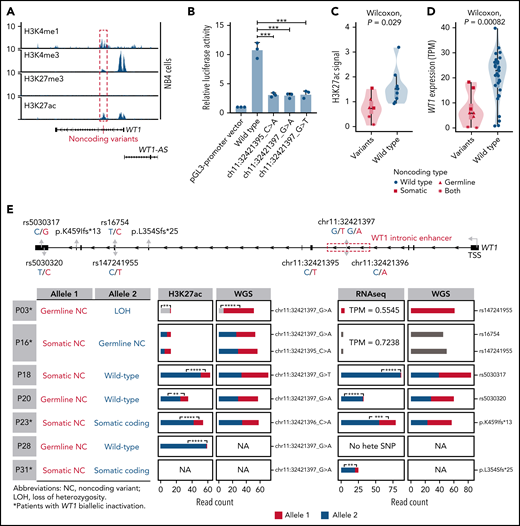
Noncoding WT1 variants lead to allele-specific downregulation of WT1, and biallelic WT1 inactivation is recurrently found in APL patients. (A) ChIP-seq tracks of H3K4me1, H3K4me3, H3K27me3, and H3K27ac occupancy in the WT1 locus in NB4 cells without noncoding WT1 variants. The site for noncoding WT1 variants is marked with a red line. (B) Impairment of the enhancer activity by noncoding WT1 variants. Wild-type or mutated intronic sequences were cloned into the pGL3-promoter plasmid, and the luciferase reporter assay was performed in NB4 cells (without noncoding WT1 variants). Data are plotted as means plus or minus standard deviation (n = 3). ***P < .001. (C) Decreased H3K27ac signals on the intronic region of WT1 in noncoding WT1 variants containing APL patients compared with patients without such variants. The P value was calculated by the Wilcoxon test. (D) Significant downregulation of WT1 expression in APL patients with noncoding WT1 mutations/variants compared with patients without these alterations. Triangle represents the case with the somatic mutation. Quadrilateral represents the case with the germline variant. Star represents the case harboring both somatic mutation and germline variant. Circular represents the case without the noncoding mutation/variant. (E) Allelic imbalance of H3K27ac ChIP-seq signals and WT1 expression in noncoding WT1 variants for APL patients. Upper panel: diagram of the WT1 locus. Left panel: the mutation status in each allele of WT1 in APL samples with noncoding WT1 variants. Middle panel: allelic distribution of H3K27ac ChIP-seq reads with and without the indicated noncoding variant. Right panel: allele distribution of WT1 expression based on RNA-seq reads mapped to the indicated heterozygous exonic SNPs or exonic mutations. The red and blue colors represent different alleles, and gray represents the indistinguishable alleles. One-tailed binomial test (expected probability 0.5) was performed: *P < .05; **P < .01; ***P < .001; ****P < .0001. LOH, loss of heterozygosity; NA, not available; NC, noncoding variant; No hete SNP, no heterozygous exonic SNP.
Noncoding WT1 variants lead to allele-specific downregulation of WT1, and biallelic WT1 inactivation is recurrently found in APL patients. (A) ChIP-seq tracks of H3K4me1, H3K4me3, H3K27me3, and H3K27ac occupancy in the WT1 locus in NB4 cells without noncoding WT1 variants. The site for noncoding WT1 variants is marked with a red line. (B) Impairment of the enhancer activity by noncoding WT1 variants. Wild-type or mutated intronic sequences were cloned into the pGL3-promoter plasmid, and the luciferase reporter assay was performed in NB4 cells (without noncoding WT1 variants). Data are plotted as means plus or minus standard deviation (n = 3). ***P < .001. (C) Decreased H3K27ac signals on the intronic region of WT1 in noncoding WT1 variants containing APL patients compared with patients without such variants. The P value was calculated by the Wilcoxon test. (D) Significant downregulation of WT1 expression in APL patients with noncoding WT1 mutations/variants compared with patients without these alterations. Triangle represents the case with the somatic mutation. Quadrilateral represents the case with the germline variant. Star represents the case harboring both somatic mutation and germline variant. Circular represents the case without the noncoding mutation/variant. (E) Allelic imbalance of H3K27ac ChIP-seq signals and WT1 expression in noncoding WT1 variants for APL patients. Upper panel: diagram of the WT1 locus. Left panel: the mutation status in each allele of WT1 in APL samples with noncoding WT1 variants. Middle panel: allelic distribution of H3K27ac ChIP-seq reads with and without the indicated noncoding variant. Right panel: allele distribution of WT1 expression based on RNA-seq reads mapped to the indicated heterozygous exonic SNPs or exonic mutations. The red and blue colors represent different alleles, and gray represents the indistinguishable alleles. One-tailed binomial test (expected probability 0.5) was performed: *P < .05; **P < .01; ***P < .001; ****P < .0001. LOH, loss of heterozygosity; NA, not available; NC, noncoding variant; No hete SNP, no heterozygous exonic SNP.
Furthermore, H3K27ac signals around this enhancer region exhibited remarkably lower signals in patients with noncoding somatic/germline WT1 variants (n = 6) than in those without such variants (n = 10) (Figure 4C). Accordingly, patients with these variants showed a significantly lower expression of WT1 (Figure 4D). Notably, 2 mutant cases harboring 2 noncoding mutations/variants (P03 and P16) showed the extremely low H3K27ac signals and WT1 expression (Figure 4C-E; supplemental Figure 5). P16 harbored a somatic mutation and a germline variant on 2 alleles, respectively. P03 contained the same germline variant in a homozygous state due to copy-neutral loss of heterozygosity. We further analyzed H3K27ac ChIP-seq data in 4 cases that were heterozygous for noncoding WT1 variants (Figure 4E; P18, P20, P23, and P28). The allele with noncoding WT1 variants exhibited significantly lower H3K27ac ChIP-seq reads compared with the wild-type allele, showing the evidence of allelic imbalance in noncoding WT1 variants (Figure 4E; supplemental Table 15). Moreover, RNA-seq reads from patients (P18, P20, P23, and P31) with heterozygous exonic SNPs or exonic mutations revealed an allelic imbalance in WT1 expression (Figure 4E; supplemental Table 16). The data suggested that the noncoding WT1 variants resulted in the mutant allele-specific loss of H3K27ac binding around this enhancer region and subsequent allelic-specific WT1 repression.
We also provided evidence supporting biallelic inactivation of WT1 expression. Among 11 patients suitable for detecting allele-specific expression, 4 (36%) showed biallelic inactivation, including the above 2 cases with 2 noncoding variants (P03 and P16) and additional 2 patients positive for both noncoding variants and coding WT1 mutations (P23 and P31) (Figure 4E; supplemental Table 13). P03 and P16 (with 2 noncoding mutations/variants on each allele, respectively) exhibited extremely low WT1 expression on both alleles. P23 and P31 (with noncoding and coding mutations on each allele, respectively) showed allele-specific expression of the coding mutations (p.K459Ifs in P23 and p.L354Sfs in P31). In these 2 cases, the inactivation of 1 allele of the WT1 gene was due to somatic noncoding WT1 mutations, supported by the absence of reads without the exonic mutations (Figure 4E). The inactivation of the other allele was caused by coding WT1 mutations, which are frameshift insertions encoding a truncated protein. Together, the biallelic inactivation of WT1 expression was recurrently found in APL patients, strongly suggesting that WT1 functions as a tumor suppressor gene.
Impaired MYB binding caused by noncoding WT1 variants leads to WT1 downregulation
Next, we explored the potential mechanism of how noncoding WT1 variants repressed WT1 expression. Motif scanning of this region showed that the wild-type sequence perfectly matched the MYB motif, whereas the mutated nucleotides altered the core positions of the MYB motif (Figure 5A). MYB binding on this enhancer region was confirmed in cell lines without noncoding WT1 mutations (Figure 5B; supplemental Figure 6). Furthermore, we performed a series of experiments to evaluate the effects of impaired MYB binding. First, we conducted DNA pulldown assays and found that MYB binding was significantly reduced in the presence of probes with noncoding WT1 variants (Figure 5C). Second, the luciferase activity of the WT1 enhancer was significantly increased upon MYB overexpression in HEK293T cells, a cell line without endogenous MYB expression (Figure 5D), suggesting the WT1 enhancer was activated by MYB. Third, the MYB-dependent enhancer activity was significantly impaired when the MYB overexpression plasmid was cotransfected with the luciferase constructs with noncoding WT1 variants (Figure 5D). Knockdown of endogenous MYB expression in NB4 cells confirmed the above findings (Figure 5E). Forth, MYB knockout significantly decreased the H3K27ac signals on the WT1 enhancer and downregulated WT1 expression in NB4 cells (Figure 5F-G). Finally, we employed the CRISPR/Cas9 technology to introduce small INDELs into the MYB motif of the WT1 enhancer in NB4 cells (Figure 5H). We found that the MYB motif-mutated clones showed a remarkably lower expression of WT1 as compared with controls (including unedited and control sgRNA-transduced cells) (Figure 5I; supplemental Figure 7). This suggested that these clones could imitate patient samples with the noncoding WT1 mutations/variants. We then performed the MYB-specific ChIP-qPCR assays at the WT1 enhancer region and found that these engineered NB4 clones showed the depletion of MYB binding compared with controls (Figure 5J). Together, these results indicated the noncoding mutations/variants on the WT1 enhancer decreased WT1 expression by destroying MYB-mediated transcriptional activation in APL cells.
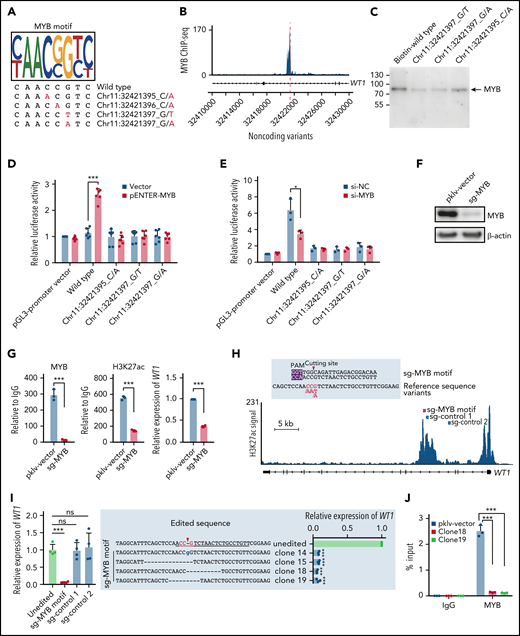
Noncoding variants in the intronic enhancer of WT1 disrupt MYB binding and MYB-mediated transcriptional activation of WT1. (A) Noncoding WT1 variants disrupted the binding site of MYB. The binding motif of MYB was determined by the MYB-specific ChIP-seq data for NB4 cells (detailed in supplemental Methods). The lower panel shows patient-derived mutation sequences with mutated nucleotides labeled in red. (B) ChIP-seq tracks showing MYB binding to the WT1 intronic enhancer in NB4 cells (without noncoding WT1 variants). (C) DNA pulldown assays with anti-MYB antibodies and cell lysates from HEK293T cells stably expressing MYB. (D-E) The dual-luciferase assays on the enhancer activity of nonmutated and mutated constructs with or without MYB expression in 293T cells (D) and NB4 cells (E). The firefly luciferase activity was normalized to the renilla luciferase and presented as the ratio relative to the pGL3-SV40 promoter vector. (F) The knockout efficiency of sg-MYB was tested by western blot. (G) MYB knockout significantly reduced the H3K27ac signals of the WT1 enhancer and expression of WT1. MYB binding signals (left), H3K27ac signals (middle), and relative expression of WT1 (right) were determined. (H) The schematic diagram of the single guide RNA (sgRNA) target sites in the H3K27ac ChIP-seq track for NB4 cells. The red box indicates the sgRNA targeting the MYB motif, and the blue boxes indicate control sgRNAs targeting regions surrounding the MYB motif within intron 3. The protospacer adjacent motif (PAM) sequence is shown in the purple frame. The red arrowhead indicates the expected cleavage site. (I) Clustered regularly interspaced short palindromic repeats (CRISPR)/CRISPR-associated protein 9 (Cas9)-mediated targeted mutagenesis of the MYB motif within the third intronic region of WT1 inhibited WT1 expression. The left panel shows the relative WT1 expression in mutated clones targeted by the indicated sgRNAs and the unedited clones. CRISPR/Cas9-edited sequences were validated by Sanger sequencing. Data are normalized against the mean expression level of the unedited clones and are plotted as means plus or minus SD (n = 4). The middle panel shows the edited genomic sequences from CRISPR/Cas9-edited single-cell clones. The right panel shows the mRNA levels of WT1 expression in parental and CRISPR/Cas9-edited clones. Data are represented as the fold change relative to the expression of the parental cells and are plotted as means plus or minus SD (n = 3). (J) Disruption of the MYB motif resulted in the loss of MYB binding at the WT1 enhancer region. ChIP–quantitative polymerase chain reaction (qPCR) assays were performed to detect MYB binding using an antibody specific for MYB in the representative MYB motif-mutated clones and the parental cells. Data are calculated as the percentage of input and are plotted as means plus or minus SD (n = 3). The statistical significance was determined using a 2-tailed Student t test. *P < .05; **P < .01; ***P < .001. IgG, immunoglobulin G; ns, not significant; si-NC, negative control small interfering RNA (siRNA); si-MYB, siRNA targeting MYB; pklv-vector, sgRNA empty vector control; sg-MYB, sgRNA targeting MYB; SD, standard deviation.
Noncoding variants in the intronic enhancer of WT1 disrupt MYB binding and MYB-mediated transcriptional activation of WT1. (A) Noncoding WT1 variants disrupted the binding site of MYB. The binding motif of MYB was determined by the MYB-specific ChIP-seq data for NB4 cells (detailed in supplemental Methods). The lower panel shows patient-derived mutation sequences with mutated nucleotides labeled in red. (B) ChIP-seq tracks showing MYB binding to the WT1 intronic enhancer in NB4 cells (without noncoding WT1 variants). (C) DNA pulldown assays with anti-MYB antibodies and cell lysates from HEK293T cells stably expressing MYB. (D-E) The dual-luciferase assays on the enhancer activity of nonmutated and mutated constructs with or without MYB expression in 293T cells (D) and NB4 cells (E). The firefly luciferase activity was normalized to the renilla luciferase and presented as the ratio relative to the pGL3-SV40 promoter vector. (F) The knockout efficiency of sg-MYB was tested by western blot. (G) MYB knockout significantly reduced the H3K27ac signals of the WT1 enhancer and expression of WT1. MYB binding signals (left), H3K27ac signals (middle), and relative expression of WT1 (right) were determined. (H) The schematic diagram of the single guide RNA (sgRNA) target sites in the H3K27ac ChIP-seq track for NB4 cells. The red box indicates the sgRNA targeting the MYB motif, and the blue boxes indicate control sgRNAs targeting regions surrounding the MYB motif within intron 3. The protospacer adjacent motif (PAM) sequence is shown in the purple frame. The red arrowhead indicates the expected cleavage site. (I) Clustered regularly interspaced short palindromic repeats (CRISPR)/CRISPR-associated protein 9 (Cas9)-mediated targeted mutagenesis of the MYB motif within the third intronic region of WT1 inhibited WT1 expression. The left panel shows the relative WT1 expression in mutated clones targeted by the indicated sgRNAs and the unedited clones. CRISPR/Cas9-edited sequences were validated by Sanger sequencing. Data are normalized against the mean expression level of the unedited clones and are plotted as means plus or minus SD (n = 4). The middle panel shows the edited genomic sequences from CRISPR/Cas9-edited single-cell clones. The right panel shows the mRNA levels of WT1 expression in parental and CRISPR/Cas9-edited clones. Data are represented as the fold change relative to the expression of the parental cells and are plotted as means plus or minus SD (n = 3). (J) Disruption of the MYB motif resulted in the loss of MYB binding at the WT1 enhancer region. ChIP–quantitative polymerase chain reaction (qPCR) assays were performed to detect MYB binding using an antibody specific for MYB in the representative MYB motif-mutated clones and the parental cells. Data are calculated as the percentage of input and are plotted as means plus or minus SD (n = 3). The statistical significance was determined using a 2-tailed Student t test. *P < .05; **P < .01; ***P < .001. IgG, immunoglobulin G; ns, not significant; si-NC, negative control small interfering RNA (siRNA); si-MYB, siRNA targeting MYB; pklv-vector, sgRNA empty vector control; sg-MYB, sgRNA targeting MYB; SD, standard deviation.
Noncoding WT1 variants disrupt the MYB-mediated enhancer-promoter interactions
Interestingly, we found that the H3K27ac signals were also dramatically decreased at the promoter of WT1, along with the decrease in H3K27ac signals at the intronic enhancer in MYB motif-mutated clones (Figure 6A). A similar finding was observed in APL patients with noncoding WT1 variants but not in patients without such variants (Figure 6B). These results implicated that noncoding WT1 variants might affect WT1 expression by disrupting long-range chromatin conformations (the interaction between promoters and enhancers) in APL cells. To validate this assumption, we performed chromatin conformation capture (3C) experiments to assess the long-range interaction between the promoter and enhancer at the WT1 locus in the MYB motif-mutated clones and the parental cells. As shown in Figure 6C, the intronic enhancer of WT1 showed strong interactions with the WT1 promoter in NB4 cells, but when the intronic site was mutated, the enhancer-promoter interactions were lost. As the noncoding WT1 variants altered the MYB motif (Figure 5A), we further knocked out MYB expression by CRISPR/Cas9 and found the enhancer-promoter interactions on the WT1 locus were dramatically decreased after MYB knockout (Figure 6D). Together, these results demonstrated that noncoding WT1 variants interfered with MYB binding to the enhancer and that this interference disrupted the enhancer-promoter interactions on the WT1 genomic locus and subsequently decreased WT1 expression.

Alterations in the recurrently mutated site of the WT1 enhancer disrupt the MYB-mediated enhancer-promoter interactions. (A-B) ChIP-seq tracks of H3K27ac signals at the WT1 locus in the MYB motif-mutated clones and the parental cells (A) and APL patients with or without noncoding WT1 variants (B). (C) The relative interaction frequencies between the anchor region (the WT1 promoter) and distal sites (purple bars) in the MYB motif-mutated clones and the parental cells. The relative interaction frequencies were determined by chromatin conformation capture (3C)-qPCR and normalized to the control region (region A). The upper panel is the schematic diagram showing the H3K27ac signals at the WT1 locus and the design of the 3C assay. XbaI restriction sites are indicated by purple blocks, 3C primers are indicated by purple arrows, and the anchor is shown by a green arrow. *P < .05 for comparison between the MYB motif-mutated clones and the parental cells. (D) The relative interaction frequencies analyzed by 3C-qPCR in NB4 cells with or without MYB knockout. *P < .05 for comparison between MYB knockout cells and control cells. pklv-vector, the sgRNA empty vector control; sg-MYB, sgRNA targeting MYB.
Alterations in the recurrently mutated site of the WT1 enhancer disrupt the MYB-mediated enhancer-promoter interactions. (A-B) ChIP-seq tracks of H3K27ac signals at the WT1 locus in the MYB motif-mutated clones and the parental cells (A) and APL patients with or without noncoding WT1 variants (B). (C) The relative interaction frequencies between the anchor region (the WT1 promoter) and distal sites (purple bars) in the MYB motif-mutated clones and the parental cells. The relative interaction frequencies were determined by chromatin conformation capture (3C)-qPCR and normalized to the control region (region A). The upper panel is the schematic diagram showing the H3K27ac signals at the WT1 locus and the design of the 3C assay. XbaI restriction sites are indicated by purple blocks, 3C primers are indicated by purple arrows, and the anchor is shown by a green arrow. *P < .05 for comparison between the MYB motif-mutated clones and the parental cells. (D) The relative interaction frequencies analyzed by 3C-qPCR in NB4 cells with or without MYB knockout. *P < .05 for comparison between MYB knockout cells and control cells. pklv-vector, the sgRNA empty vector control; sg-MYB, sgRNA targeting MYB.
Discussion
Emerging studies have revealed the importance of noncoding mutations in cancer development, and now, a major challenge is the functional interpretation of disease-associated noncoding mutations. In this study, we made an important contribution, reporting systematic identification and functional characterization of noncoding regulatory mutations based on the combination of WGS data and the CRE catalog from primary APL patients. We identified >2000 H3K27ac-positive CREs containing somatic mutations. Our data analysis revealed that somatic noncoding mutations preferred to accumulate on chromatin bound by master transcription factors essential for hematopoiesis and APL leukemogenesis. Furthermore, we elucidated the mechanisms by which noncoding mutations within the WT1 intronic enhancer disrupted the binding of MYB on chromatin and thereby suppressed the enhancer activity and gene expression of WT1 by destroying the chromatin looping formation in APL. Our work provides novel insights into the role of noncoding mutations in the pathogenesis of APL.
Our comprehensive investigations of noncoding WT1 mutations have addressed several long-standing questions in the pathogenesis of APL. First, we found that the third intron of WT1 was recurrently mutated in APL patients. Previous studies have shown a high incidence of coding WT1 mutations in APL compared with non-APL AML.14 However, these studies may underestimate the true incidence of WT1 deregulation in APL; our data showed that ∼7.69% of APL contained mutations/variations in the intronic enhancer. Second, biallelic inactivation of WT1 caused by noncoding and/or coding mutations supports WT1 acting as a tumor suppressor in APL because 2 inactivating hits are considered the hallmark of tumor suppressor genes.60,61 Third, we found that one of the noncoding WT1 mutations also existed as a germline polymorphism (rs191528827) in the Chinese population, and the G to A variant contributed to the disease susceptibility in APL patients. This SNP represents the first description of a clinically relevant noncoding germline variant in APL. This may explain a relatively higher frequency of APL in China, but the actual incidence rate of APL in China is unknown because population-based registries do not distinguish APL from other AML subtypes. This is the first report demonstrating that noncoding WT1 variants have a role in the susceptibility of APL. Admittedly, the sample size is small, and further confirmation in a larger cohort is needed.
Our study suggested a functional relevance of noncoding WT1 variants in APL leukemogenesis, and the functional consequences of these variants can be inferred from previous studies. For example, Wt1 haploinsufficiency can enhance the self-renewal capacity of hematopoietic stem and progenitor cells and cooperate with FLT3-internal tandem duplication to induce AML with full penetrance.21 The growth advantage conferred by the inactivation of WT1 has been reported in CD34+ cells expressing PML/RARα, providing convincing evidence for the tumor suppressor activity of WT1 in APL.62 As noncoding WT1 variants in this intronic enhancer led to decreased WT1 expression, it is tempting to speculate that the resulting consequences could contribute to the growth advantage of hematopoietic progenitors.
MYB can act as an oncogene in leukemogenesis.63-65 It has been reported that somatic noncoding mutations can create MYB binding sites to cause MYB-mediated activation of LMO2 or TAL1 in T-ALL.66,67 Moreover, increased MYB binding to specific MYB binding sites can cause a hijacked GATA2 enhancer driving EVI1 overexpression in AML.68 Independent from its role in activating oncogenes through creating or increasing MYB binding, our study expanded our understanding of the mechanisms of MYB in leukemogenesis. We found that noncoding somatic or germline variants in the WT1 intron 3 destroyed MYB binding and thereby inhibited the expression of the tumor suppressor gene WT1 in APL. An early work reported MYB-mediated WT1 transactivation through a MYB binding site,69 but our identified enhancer was located in a different position and showed highly abundant H3K27ac signals in hematopoietic cells (supplemental Figure 8). Furthermore, we revealed that noncoding WT1 variants perturbed the MYB-mediated enhancer-promoter chromatin looping on the WT1 locus. This is consistent with the recent findings on the role of noncoding variants facilitating chromatin looping.70-72
PML/RARα is the initiating factor in APL. We indeed found that PML/RARα was one of the master TFs for APL cells (Figure 2A). Of note, the less mutation burden was found on the PML/RARα bound sites (Figure 2D). This was likely explained by the following factors: (1) At a more relaxed degree of DNA-binding specificity, PML/RARα tends to bind the RARE half site.38 (2) Instead of direct DNA binding, PML/RARα can function as cofactors to be interacted with other hematopoietic TFs in mediating the formation of super-enhancers.39
This work opens additional important areas for future research. Considering the existence of WT1 coding mutations in both APL and non-APL AML, it is deducible that noncoding WT1 variants are also present in non-APL AML. Future studies will aim to pursue this issue using a large patient cohort. Furthermore, we identified an APL risk-associated SNP rs191528827. Our future work will explore the influence of rs191528827 on WT1 expression and cancer predisposition in healthy individuals in a population-based and long-term study.
Acknowledgments
The computations were run on the π 2.0 cluster supported by the Center for High Performance Computing at Shanghai Jiao Tong University.
This work was supported by the National Natural Science Foundation of China (81890994), the National Key R&D Program of China (2019YFA0905902), and the Innovative Research Team of High-Level Local Universities in Shanghai.
Authorship
Contribution: K.W. designed the experiments; H.S., Y.T., and Y.Z. performed the experiments; Y.L. analyzed the data; L.C., J.Y., W.J., and S.W. collected clinical samples; K.W. supervised the study and analysis; L.C. and J.Y. followed up with the patients; K.W., Y.T., H.S., and Y.L. wrote the manuscript; Z.C. and S.C. gave conceptual advice; and all authors discussed the results and implications and reviewed the manuscript.
Conflict-of-interest disclosure: The authors declare no competing financial interests.
Correspondence: Kankan Wang, Shanghai Institute of Hematology, Ruijin Hospital Affiliated to Shanghai Jiao Tong University School of Medicine, 197 Ruijin Er Rd, Shanghai 200025, China; e-mail: kankanwang@shsmu.edu.cn; and Yun Tan, Shanghai Institute of Hematology, Ruijin Hospital Affiliated to Shanghai Jiao Tong University School of Medicine, 197 Ruijin Er Rd, Shanghai 200025, China; e-mail: ty12260@rjh.com.cn.
Raw and processed WGS, ChIP-seq, and RNA-seq data have been deposited in the National Omics Data Encyclopedia (NODE) under the accession number OEP002856.
Send data sharing requests via e-mail to the corresponding author.
The online version of this article contains a data supplement.
There is a Blood Commentary on this article in this issue.
The publication costs of this article were defrayed in part by page charge payment. Therefore, and solely to indicate this fact, this article is hereby marked “advertisement” in accordance with 18 USC section 1734.

This feature is available to Subscribers Only
Sign In or Create an Account Close Modal