

Key Point
MondoA maintains aggressiveness and leukemic burden in common ALL, modulating metabolic stress response.

Abstract
Cancer cells are in most instances characterized by rapid proliferation and uncontrolled cell division. Hence, they must adapt to proliferation-induced metabolic stress through intrinsic or acquired antimetabolic stress responses to maintain homeostasis and survival. One mechanism to achieve this is reprogramming gene expression in a metabolism-dependent manner. MondoA (also known as Myc-associated factor X–like protein X-interacting protein [MLXIP]), a member of the MYC interactome, has been described as an example of such a metabolic sensor. However, the role of MondoA in malignancy is not fully understood and the underlying mechanism in metabolic responses remains elusive. By assessing patient data sets, we found that MondoA overexpression is associated with worse survival in pediatric common acute lymphoblastic leukemia (ALL; B-precursor ALL [B-ALL]). Using clustered regularly interspaced short palindromic repeats (CRISPR)/CRISPR-associated protein 9 (Cas9) and RNA-interference approaches, we observed that MondoA depletion reduces the transformational capacity of B-ALL cells in vitro and dramatically inhibits malignant potential in an in vivo mouse model. Interestingly, reduced expression of MondoA in patient data sets correlated with enrichment in metabolic pathways. The loss of MondoA correlated with increased tricarboxylic acid cycle activity. Mechanistically, MondoA senses metabolic stress in B-ALL cells by restricting oxidative phosphorylation through reduced pyruvate dehydrogenase activity. Glutamine starvation conditions greatly enhance this effect and highlight the inability to mitigate metabolic stress upon loss of MondoA in B-ALL. Our findings give novel insight into the function of MondoA in pediatric B-ALL and support the notion that MondoA inhibition in this entity offers a therapeutic opportunity and should be further explored.
Introduction
Acute lymphoblastic leukemia (ALL) is the most frequent childhood malignancy, with B-precursor ALL (B-ALL) being its most common subgroup. Despite major treatment advances, ALL remains a leading cause of cancer death in children.1,2 Additionally, current treatments result in long-term toxicity.3,4 Survivors face reduced life expectancy with a 13% cumulative incidence of death from any cause including second cancers or cardiac-related events.5,6 Thus, better understanding of ALL is needed.
Malignant cells must adapt to proliferation-induced metabolic stress and require antimetabolic stress responses to maintain homeostasis and survival.7 One such mechanism consists of energy-sensing molecules that drive cellular energy homeostasis in response to starvation conditions: adenosine monophosphate–activated protein kinase (AMPK) and hypoxia-inducible factor 1-α (HIF1a) are well-known examples.8-10 Another protein that has been proposed to influence energy homeostasis by sensing intracellular energy states is Myc-associated factor X (MAX)–like protein X (MLX)-interacting protein (MLXIP), also known as MondoA.11-15
MondoA is part of the MYC transcription factor interactome comprising MYC, MAX, MAD, MLX, and MondoA. MYC, MAD, and MondoA differentially mediate proliferation, differentiation, and metabolism by competing for heterodimerization with MAX and MLX, yielding differential signaling outcomes. Hence, the MYC interactome regulates both proliferation and adaptation to metabolic stress.16-18 For example, in glucose-dependent tumor entities, such as triple-negative breast cancer or malignant melanoma, MYC and MondoA behave antagonistically.19,20 In contrast, in the glutamine-dependent malignancy neuroblastoma, these 2 proteins cooperate to confer malignancy.17 We previously showed that MondoA is required for proliferation and stemness features of B-ALL.21 MondoA is a negative regulator of glucose uptake and highly sensitive to increasing intracellular glucose-6-phosphate levels.16,17 Here, we report that MondoA is overexpressed in B-ALL and correlates with relapse and decreased survival. We show that depletion of MondoA results in loss of proliferative capacity and malignancy. Interestingly, the loss of MondoA leads to increased oxidative phosphorylation (Oxphos). Mechanistically, MondoA mediates malignancy via facilitating adaptation to metabolic stress by restricting tricarboxylic acid (TCA) cycle activity. MondoA reduces pyruvate dehydrogenase (PDH) activity in glutamine-scarce environments through PDH kinase (PDK). We therefore hypothesize that MondoA mediates malignancy in B-ALL by functioning as a metabolic stress sensor.
Materials and methods
Primary patient-derived material
Primary human samples were obtained with approval of the institutional review board (approval identifier 2562/09). Pretherapy B-ALL samples were obtained from bone marrow (BM; n = 61) or peripheral blood (PB; n = 11) of children in ALL Berlin-Frankfurt-Münster (BFM) studies. All patients provided written informed consent. Mononucleated cells from BM or PB were cryopreserved.
Generation of MondoA-knockdown clones
For generation of an inducible MondoA knockdown (MKD), lines were infected with lentivirus (multiplicity of infection, 1:10) containing a pTRIPZ vector with either a short hairpin RNA (shRNA) against MondoA or nontargeting control shRNA. Single-cell cloned infectants were selected in puromycin. MKD efficacy upon doxycycline treatment was confirmed by reverse transcription–polymerase chain reaction (RT-PCR) and western blot (WB). For lentivirus production, 5.5 × 10⁶ HEK293T cells were seeded 1 day before transfection and cultured in Dulbecco modified Eagle medium supplemented with fetal bovine serum and antibiotics. Lentiviral particles were isolated by filtration of supernatant.
Generation of MondoA-knockout clones
We designed our single guide RNA (sgRNA; Methabion) to target the clustered regularly interspaced short palindromic repeats (CRISPR)-associated protein 9 (Cas9) nuclease to exon 10 of MondoA specifically using the Brunello Database.22 Oligonucleotides were cloned into lentiviral vector LentiGuide-Puro. Lentiviral constructs LentiCas9-Blast and LentiGuide-Puro plasmid with ligated selected sgRNA were transfected into HEK293T. Viral supernatants were isolated 48 hours after transfection and filtered. Nalm6 cells were transduced with viral supernatant. Blasticidin-resistant cells were transduced with viral supernatant containing LentiGuide-Puro with ligated selected sgRNA. Stable infectants were selected in puromycin. Mutants and control clones were identified by WB. MondoA protein levels were measured using an anti-MondoA rabbit monoclonal antibody.
Generation of MondoA-overexpressing clones
Viral supernatant with Lenti ORF particles with the MondoA (Myc-DDK tagged) construct for overexpression were purchased from Origen. Cas9-transduced Nalm6 cells were transduced. Stable infectants were isolated after selection.
Metabolism assays
The oxygen consumption rate (OCR) was analyzed on a XF96 Extracellular Flux Analyzer (Seahorse). Cells were plated in media with 10 mM glucose. Measurements were obtained under basal conditions and after the addition of 1 mM oligomycin, 1 mM carbonyl cyanide 4-(trifluoromethoxy)phenylhydrazone (FCCP), and 1 mM Rotenone/antimycin A. Glucose consumption and lactate secretion were measured by gas chromatography–mass spectrometry.
Measurement of intracellular reactive oxygen species
Cells exposed to 30-minute incubation with 5 mM dichlorofluorescein diacetate (DCF-DA; Sigma) and analyzed by flow cytometry.
Mice and in vivo experiments
Rag2−/−γc−/− mice on a BALB/c background were maintained under pathogen-free conditions and approval of authorities. Experiments were performed in 6- to 16-week-old female mice (n = 5) for each experimental group. For in vivo tumor growth, 5 × 10⁶ leukemic cells were injected into the tail veins of mice receiving doxycycline-containing food. Five weeks after, mice were euthanized and leukemic burden was monitored by analysis of human CD10 expression in blood, spleen, and BM. Liver and spleen were formalin-fixed for histology. In experiments with MondoA-knockout (MKO) Nalm6 cell lines, 8 mice were injected with 5 × 10⁶ MKO Nalm6 cells and 9 mice with Cas9 control (CTRL) Nalm6 cells. These mice received standard food (no doxycycline).
Results
MondoA is overexpressed in primary B-ALL and correlates with higher relapse and decreased survival in B-ALL subsets
Previously, we reported that MondoA is overexpressed in B-ALL in comparison with normal adult and fetal tissues.21 To further investigate the gene expression of MondoA in different human cancers, we compared microarray data sets from publicly available sources (Figure 1A).23 We analyzed 1042 independent cancer samples, including 533 pediatric malignancies, including 33 samples of B-ALL. MondoA expression was observed to be twofold higher (median expression intensity [MEI] = 395.7; standard deviation [SD] = 280.6) relative to all other pediatric malignancies (MEI = 148.5; SD = 42; P < .001) (Figure 1A). Focusing on hematopoietic neoplasms, MondoA had the highest expression (MEI = 395.7; SD = 280.6) in B-ALL compared with any other hematopoietic malignancy (MEI average = 152.42; SD = 32.48; P < .001) (Figure 1B). Another public data set using RNA-sequencing (RNA-Seq) analysis (University of California Santa Cruz [UCSC] Xena) also revealed B-ALL as having the highest MondoA expression (median normalized count = 15.36; SD = 1.06) compared with all other pediatric malignancies (median normalized count = 12.35; SD = 0.56; P < .001) (Figure 1C). We next validated the MondoA expression in B-ALL in our own patient population using an independent method and found that B-ALL–bearing patients had a significantly increased expression level of MondoA compared with the healthy controls (P = .0499) (Figure 1D). To assess the prognostic impact of MondoA expression, we analyzed MondoA messenger RNA (mRNA) in 61 primary B-ALL BM samples from the BFM study. All 61 samples were negative for other known prognostically relevant molecular markers, such as TEL/AML1, BCR/ABL, and mixed lineage leukemia (MLL)/AF4. Samples were either grouped into a very high-risk (HR) group (very HR; n = 31), defined as minimal residual disease (MRD) ≥10−3 after induction treatment, or a non-HR group, defined by prednisone good response, remission at day 33, MRD measurable at <10−3 on treatment day 33 and at week 12 (n = 30). MondoA expression was 1.63-fold higher in the very HR patient set (P = .0294) (Figure 1E). Analyzing publicly available survival data (UCSC Xena) of pediatric patients with not otherwise specified (NOS) B-ALL also demonstrated that high MondoA expression in primary BM samples corresponded with significantly decreased survival (P = .03), in the cohort of patients who were positive for MRD on day +29 of the treatment protocol (n = 67; median age, 14 years, TARGET) (Figure 1F). Concurrent with these findings in native cells, B-ALL cell line Nalm6 was characterized by the highest MondoA protein level in comparison with other tumor cell lines tested (Figure 1G). We conclude that MondoA is greater expressed in patients with pediatric B-ALL compared with other pediatric malignancies, and that MondoA overexpression is associated with an inferior outcome in a B-ALL subgroup.
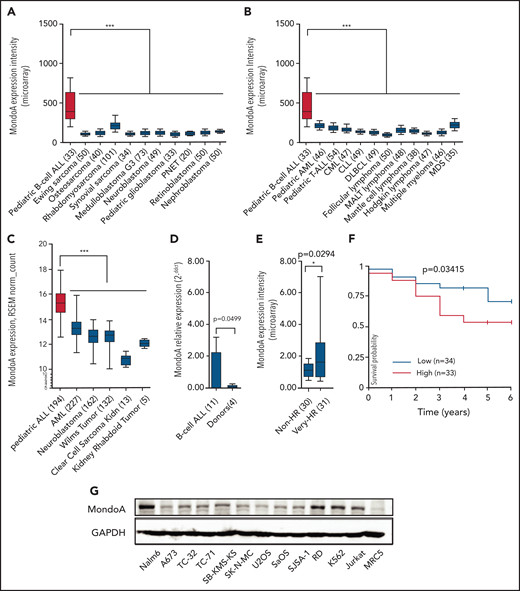
MondoA (MLXIP) is highly expressed in primary B-ALL and correlates with relapse risk. (A) MondoA (ID 22877_at) expression in pediatric B-ALL relative to pediatric solid tumors (n = 533; *P < .05; **P < .01; ***P < .001; ****P < .0001; 1-way analysis of variance (ANOVA) with the Bonferroni multiple comparison test). Numbers of analyzed samples are shown in brackets. All data sets were normalized simultaneously using robust multiarray average (RMA) and custom microarray (v15 ENTREZG) CDF files. Data are depicted as box plots. Whiskers indicate the 10th and 90th percentiles. Data presented in linear scale. MondoA Microarray ENTREZG probe set identifier (ID) is 22877_at. (B) MondoA (ID 22877_at) expression in lymphoid and myeloid neoplasms (n = 542; P < .001; 1-way ANOVA with Bonferroni multiple comparison test). (C) MondoA expression in pediatric ALL relative to AML and other pediatric tumors (RNA-Seq data; UCSC Xena; n = 733; P < .001; 1-way ANOVA with Bonferroni multiple comparison test). (D) MondoA relative expression by qRT-PCR in peripheral blood mononuclear cell (PBMC) samples from patients (n = 11) with primary pediatric B-ALL compared with 3 PBMCs from healthy donors (n = 4), normalized to donor PBMC sample. Results of 2 independent experiments in duplicate are presented as means plus or minus standard error of the mean (SEM; P = .0499; Welch Student t test). (E) MondoA overexpression correlates with relapse risk in B-ALL. MondoA expression was 63% higher (P = .0294; Welch Student t test) in the very HR group (n = 31) as compared with the non-HR group (n = 30), defined by prednisone good response (PGR), remission on day 33 of induction therapy, (MRD-MR) minimal residual disease- minimal risk, or (MRD-SR) minimal residual disease- standart risk. All cases are negative for prognostically relevant molecular markers TEL/AML1, BCR/ABL, MLL/AF4 (data from the BFM study group). Bars indicate median; boxes represent middle 50% of data. Whiskers indicate 10th and 90th percentiles. (F) Kaplan-Meier curve indicating significant difference in survival of B-ALL patients with positive MRD on day +28 depending on MondoA expression. All cases are negative for BCR/ABL (n = 67; P = .03415). (G) Western blot showing MondoA and glyceraldehyde-3-phosphate dehydrogenase (GAPDH) as loading control in leukemias and different tumor cell lines. AML, acute myeloid leukemia; CLL, chronic lymphocytic leukemia; CML, chronic myeloid leukemia; DLBCL, diffuse large B-cell lymphoma; MALT lymphoma, mucosa-associated lymphoid tissue lymphoma; MDS, myelodysplastic syndrome; PNET, primitive neuroectodermal tumor; RSEM, RNA-Seq by expectation-maximization; T-ALL, T-cell acute lymphoblastic leukemia. *P < .05; ***P < .001.
MondoA (MLXIP) is highly expressed in primary B-ALL and correlates with relapse risk. (A) MondoA (ID 22877_at) expression in pediatric B-ALL relative to pediatric solid tumors (n = 533; *P < .05; **P < .01; ***P < .001; ****P < .0001; 1-way analysis of variance (ANOVA) with the Bonferroni multiple comparison test). Numbers of analyzed samples are shown in brackets. All data sets were normalized simultaneously using robust multiarray average (RMA) and custom microarray (v15 ENTREZG) CDF files. Data are depicted as box plots. Whiskers indicate the 10th and 90th percentiles. Data presented in linear scale. MondoA Microarray ENTREZG probe set identifier (ID) is 22877_at. (B) MondoA (ID 22877_at) expression in lymphoid and myeloid neoplasms (n = 542; P < .001; 1-way ANOVA with Bonferroni multiple comparison test). (C) MondoA expression in pediatric ALL relative to AML and other pediatric tumors (RNA-Seq data; UCSC Xena; n = 733; P < .001; 1-way ANOVA with Bonferroni multiple comparison test). (D) MondoA relative expression by qRT-PCR in peripheral blood mononuclear cell (PBMC) samples from patients (n = 11) with primary pediatric B-ALL compared with 3 PBMCs from healthy donors (n = 4), normalized to donor PBMC sample. Results of 2 independent experiments in duplicate are presented as means plus or minus standard error of the mean (SEM; P = .0499; Welch Student t test). (E) MondoA overexpression correlates with relapse risk in B-ALL. MondoA expression was 63% higher (P = .0294; Welch Student t test) in the very HR group (n = 31) as compared with the non-HR group (n = 30), defined by prednisone good response (PGR), remission on day 33 of induction therapy, (MRD-MR) minimal residual disease- minimal risk, or (MRD-SR) minimal residual disease- standart risk. All cases are negative for prognostically relevant molecular markers TEL/AML1, BCR/ABL, MLL/AF4 (data from the BFM study group). Bars indicate median; boxes represent middle 50% of data. Whiskers indicate 10th and 90th percentiles. (F) Kaplan-Meier curve indicating significant difference in survival of B-ALL patients with positive MRD on day +28 depending on MondoA expression. All cases are negative for BCR/ABL (n = 67; P = .03415). (G) Western blot showing MondoA and glyceraldehyde-3-phosphate dehydrogenase (GAPDH) as loading control in leukemias and different tumor cell lines. AML, acute myeloid leukemia; CLL, chronic lymphocytic leukemia; CML, chronic myeloid leukemia; DLBCL, diffuse large B-cell lymphoma; MALT lymphoma, mucosa-associated lymphoid tissue lymphoma; MDS, myelodysplastic syndrome; PNET, primitive neuroectodermal tumor; RSEM, RNA-Seq by expectation-maximization; T-ALL, T-cell acute lymphoblastic leukemia. *P < .05; ***P < .001.
MondoA silencing reduces proliferation and clonogenicity in vitro, and aggressiveness in vivo
To investigate the functional role of MondoA in B-ALL, we used RNA interference and CRISPR/Cas9-mediated gene editing. MKD efficiency of shRNAs was confirmed by PCR, quantitative RT-PCR (qRT-PCR), and WB (Figure 2A-B). We observed a significant twofold decrease in colony formation after 14 days in Naml6 and 697 cell lines (P < .01) (Figure 2C; supplemental Figure 1A-B, available on the Blood Web site). We also observed significantly reduced 5-bromo-2′-deoxyuridine (BrdU) incorporation in Nalm6, REH, and 697 cell lines upon MKD (P < .001 at 48 hours and 72 hours) (Figure 2D-F). Reexpression of MondoA in MKD cell lines led to the reconstitution of the proliferative phenotype of wild-type (WT) cells (supplemental Figure 1D).
![MKD reduces proliferation and clonogenicity of B-ALL cells in vitro and tumorigenicity in vivo. (A) Knockdown efficiency of MondoA by doxycycline-inducible shRNA against MondoA compared with control shRNA (shCTRL, Tet-On) by qRT-PCR after treatment with doxycycline for 48 hours. Data are mean and SEM of n = 6 experiments, P < .05 (Reh) and P < .001(Nalm6). (B) Western blot of knockdown efficiency after 48 hours of doxycycline. (C) Contact-independent growth in Nalm6 and 697 cells stably transfected with doxycycline-inducible shRNA either against MondoA or control. Data are mean of n = 2 experiments; P < .01; Mann Whitney test. (D-F) Long-term proliferation measured by BrdU assay. Control and MKD cells pretreated with doxycycline for 48 hours (n = 6 for each time point; P < .001; 2-way ANOVA). (G-H) Xenograft transplantation of Nalm6 and 697 cells stably transfected with doxycycline-inducible shRNA infectants in Rag2−/−yc−/− mice. MKD clones and control Nalm6 and 697 cells were injected into the tail veins of immunocompromised mice. Serial sectioning of liver and spleen tissue, including measurements of liver and spleen weights as well as the relative amount of human CD10+ leukemic blasts in blood, BM, and spleen were then assessed. The reduced number of leukemic cells was also confirmed by hematoxylin-and-eosin (H&E) staining of formalin-fixed paraffin-embedded spleen and liver tissue. H&E staining of formalin-fixed paraffin-embedded liver and spleen (scale bar, 1.0 mm). Images captured from H&E staining of the 4-µm sections of paraffin blocks by Axioplan2 microscopy (Carl Zeiss) and AxioVs40 V.4.8.2.0 software. (I) Weight of spleen in grams. Cell lines either expressing shRNA against MondoA or control, as indicated (n = 5 in each group; P < .05). (J) Weight of liver in grams. Cell lines either expressing shRNA against MondoA or control, as indicated (n = 5 in each group, P < .01, results are presented as mean plus or minus SEM; Mann-Whitney test). MKD was associated with a significant reduction in average size and weights of spleen and liver (P < .05 and P < .01). CD10+ leukemic blasts in BM (K), spleens (L), and blood (M) in cell lines either expressing shRNA against MondoA or control, as indicated (P < .001 [Nalm6] and P < .01 [697]; results are presented as mean plus or minus SEM; Mann Whitney test). ddCt, ΔΔ cycle threshold; ns, not significant. *P < .05; **P < .01; ***P < .001.](https://ash.silverchair-cdn.com/ash/content_public/journal/blood/139/8/10.1182_blood.2020007932/6/m_bloodbld2020007932f2.png?Expires=1769129520&Signature=TsWgHVwol4~atkeO9Cq30ASJ4JZnQrlRaR4gTRyq28TRGtHvPRdux88dPtYxvou42q0Ve4V~bKXbUc37ofXoPwhO9Q0GeTepEToHhV9fiCSaCPI0gs50pH2M21juvRB~PEawixO2BruzoW~T4YOx6l8FvnVQo45CJFsWVXuKB2Q8ZEw6NTu9UaAznoxJURZ8L~EeIqMOqll1s30SWhkIKkRz5vwmjwCQGhv~pHMeDATXi3MuMF5G--lmJwhVYoUusqXnOUrr4kC2WRt3DWlHy9Nwzp0O~o~O8QLY7k2tZZ6Ku6dpJ3gpznfbEsDwpi2zeBlbwsI-blHclrKcpe834g__&Key-Pair-Id=APKAIE5G5CRDK6RD3PGA)
MKD reduces proliferation and clonogenicity of B-ALL cells in vitro and tumorigenicity in vivo. (A) Knockdown efficiency of MondoA by doxycycline-inducible shRNA against MondoA compared with control shRNA (shCTRL, Tet-On) by qRT-PCR after treatment with doxycycline for 48 hours. Data are mean and SEM of n = 6 experiments, P < .05 (Reh) and P < .001(Nalm6). (B) Western blot of knockdown efficiency after 48 hours of doxycycline. (C) Contact-independent growth in Nalm6 and 697 cells stably transfected with doxycycline-inducible shRNA either against MondoA or control. Data are mean of n = 2 experiments; P < .01; Mann Whitney test. (D-F) Long-term proliferation measured by BrdU assay. Control and MKD cells pretreated with doxycycline for 48 hours (n = 6 for each time point; P < .001; 2-way ANOVA). (G-H) Xenograft transplantation of Nalm6 and 697 cells stably transfected with doxycycline-inducible shRNA infectants in Rag2−/−yc−/− mice. MKD clones and control Nalm6 and 697 cells were injected into the tail veins of immunocompromised mice. Serial sectioning of liver and spleen tissue, including measurements of liver and spleen weights as well as the relative amount of human CD10+ leukemic blasts in blood, BM, and spleen were then assessed. The reduced number of leukemic cells was also confirmed by hematoxylin-and-eosin (H&E) staining of formalin-fixed paraffin-embedded spleen and liver tissue. H&E staining of formalin-fixed paraffin-embedded liver and spleen (scale bar, 1.0 mm). Images captured from H&E staining of the 4-µm sections of paraffin blocks by Axioplan2 microscopy (Carl Zeiss) and AxioVs40 V.4.8.2.0 software. (I) Weight of spleen in grams. Cell lines either expressing shRNA against MondoA or control, as indicated (n = 5 in each group; P < .05). (J) Weight of liver in grams. Cell lines either expressing shRNA against MondoA or control, as indicated (n = 5 in each group, P < .01, results are presented as mean plus or minus SEM; Mann-Whitney test). MKD was associated with a significant reduction in average size and weights of spleen and liver (P < .05 and P < .01). CD10+ leukemic blasts in BM (K), spleens (L), and blood (M) in cell lines either expressing shRNA against MondoA or control, as indicated (P < .001 [Nalm6] and P < .01 [697]; results are presented as mean plus or minus SEM; Mann Whitney test). ddCt, ΔΔ cycle threshold; ns, not significant. *P < .05; **P < .01; ***P < .001.
MKD reduces proliferation and clonogenicity of B-ALL cells in vitro and tumorigenicity in vivo. (A) Knockdown efficiency of MondoA by doxycycline-inducible shRNA against MondoA compared with control shRNA (shCTRL, Tet-On) by qRT-PCR after treatment with doxycycline for 48 hours. Data are mean and SEM of n = 6 experiments, P < .05 (Reh) and P < .001(Nalm6). (B) Western blot of knockdown efficiency after 48 hours of doxycycline. (C) Contact-independent growth in Nalm6 and 697 cells stably transfected with doxycycline-inducible shRNA either against MondoA or control. Data are mean of n = 2 experiments; P < .01; Mann Whitney test. (D-F) Long-term proliferation measured by BrdU assay. Control and MKD cells pretreated with doxycycline for 48 hours (n = 6 for each time point; P < .001; 2-way ANOVA). (G-H) Xenograft transplantation of Nalm6 and 697 cells stably transfected with doxycycline-inducible shRNA infectants in Rag2−/−yc−/− mice. MKD clones and control Nalm6 and 697 cells were injected into the tail veins of immunocompromised mice. Serial sectioning of liver and spleen tissue, including measurements of liver and spleen weights as well as the relative amount of human CD10+ leukemic blasts in blood, BM, and spleen were then assessed. The reduced number of leukemic cells was also confirmed by hematoxylin-and-eosin (H&E) staining of formalin-fixed paraffin-embedded spleen and liver tissue. H&E staining of formalin-fixed paraffin-embedded liver and spleen (scale bar, 1.0 mm). Images captured from H&E staining of the 4-µm sections of paraffin blocks by Axioplan2 microscopy (Carl Zeiss) and AxioVs40 V.4.8.2.0 software. (I) Weight of spleen in grams. Cell lines either expressing shRNA against MondoA or control, as indicated (n = 5 in each group; P < .05). (J) Weight of liver in grams. Cell lines either expressing shRNA against MondoA or control, as indicated (n = 5 in each group, P < .01, results are presented as mean plus or minus SEM; Mann-Whitney test). MKD was associated with a significant reduction in average size and weights of spleen and liver (P < .05 and P < .01). CD10+ leukemic blasts in BM (K), spleens (L), and blood (M) in cell lines either expressing shRNA against MondoA or control, as indicated (P < .001 [Nalm6] and P < .01 [697]; results are presented as mean plus or minus SEM; Mann Whitney test). ddCt, ΔΔ cycle threshold; ns, not significant. *P < .05; **P < .01; ***P < .001.
We extended these findings to an in vivo setting, utilizing an isogenic Nalm6 B-ALL cell line with complete MKO. Following stable Cas9 MKO, MondoA was undetectable at the protein level (Figure 3A). In line with previous MKD experiments, MKO cells showed reduced proliferation and formed fewer colonies in comparison with controls (Figure 3B-D; supplemental Figure 1E). Consistently, the leukemogenic potential of MKO cells was significantly decreased in vivo. The survival of mice was monitored for 56 days at which time all 9 mice injected with control Nalm6 cells had to be euthanized (Figure 3E; P < .001). In sharp contrast, mice injected with MKO cells showed no sign of disease. Mice in the control group showed significant spleen enlargement and hepatomegaly postmortem compared with the experimental group (P < .001 and P < .01) (Figure 3F-G; supplemental Figure 1E). Furthermore, CD10+ blasts were below 1% in BM, spleen, and liver (data not shown). MKO results confirmed previous MKD (Figure 2G,H,K-M). Reexpression of MondoA in MKD lines led to the reconstitution of the proliferative phenotype of WT cells (supplemental Figure 1D). To summarize, our data suggest that stable MondoA maintains proliferation, clonogenicity, and aggressiveness of B-ALL cells in vitro and in vivo.
![MKO mediated by CRISPR/Cas9 reduces proliferation and clonogenicity of B-ALL cells in vitro and tumorigenicity in vivo. (A) Representative western blot with anti-MondoA antibody of Nalm6 MKO clone 1 and clone 2 lysates; Cas9-only transfected Nalm6 B-ALL cell line as control; GAPDH as loading control. (B) Long-term proliferation measured with BrdU assay (n = 6 for each time point, P < .01 at 48 hours and P < .001 at 72 hours, 2-way ANOVA). (C) Long-term proliferation measured by direct cell counting. Cas9-only transfected Nalm6 cell line and MKO clones 1 and 2, were grown under normoxia (20% O2) (n = 6 for each time point, P < .001 at 72 hours and 96 hours, 2-way ANOVA). (D) Contact-independent growth of Nalm6 cells with CRISPR/Cas9-mediated MKO. Quantitative evaluation in methylcellulose-based colony formation assay (n = 4, P < .001, results are presented as mean plus or minus SD; 1-way ANOVA). (E) Survival curves of mice transplanted with Nalm6 MKO and Cas9-only control cells (n = 8 for MKO group, n = 9 for CTRL, P < .001). (F-G) Xenograft transplantation of Nalm6 cells with either MKO (n = 8) or control (n = 9) in Rag2−/−yc−/− mice. Weight of liver and spleens in grams (P = .0026 [liver] and P = .0008 [spleen], results are presented as mean plus or minus SD; unpaired Student t test). **P < .01; ***P < .001.](https://ash.silverchair-cdn.com/ash/content_public/journal/blood/139/8/10.1182_blood.2020007932/6/m_bloodbld2020007932f3.png?Expires=1769129520&Signature=iiwyGclKUsPxpOTpfBcNnxQ-GjXo8svd-pv2~1CZvcfE8NIvy1Xvb9ByiuFlOiw7hltr8c98yAkA~lC7Mv30D6lmLf5Xo9YVCgr2-jxzDowHgJLBpM8l-CfhpLxy2ssKHQMEM9CVRtu4vwqxnhcKo1~ZvLi-vwC227F9yY6sEa2wP4uJ501xKIdi-Dg5tmIJPxgK3xWOY2~1ntbZKJAkmNxfBlACRi~9r1nvmSjdnhFKAAuHU4Mx0foPzdWPkcwGJ17o2CBHkUK~owpjUe7SXXkjFdtz8ZXSJGMnAHKDWN2mza91QG0n-8UhCv2Eq5SevQDWr2o32Xlj~wWhs5l2fg__&Key-Pair-Id=APKAIE5G5CRDK6RD3PGA)
MKO mediated by CRISPR/Cas9 reduces proliferation and clonogenicity of B-ALL cells in vitro and tumorigenicity in vivo. (A) Representative western blot with anti-MondoA antibody of Nalm6 MKO clone 1 and clone 2 lysates; Cas9-only transfected Nalm6 B-ALL cell line as control; GAPDH as loading control. (B) Long-term proliferation measured with BrdU assay (n = 6 for each time point, P < .01 at 48 hours and P < .001 at 72 hours, 2-way ANOVA). (C) Long-term proliferation measured by direct cell counting. Cas9-only transfected Nalm6 cell line and MKO clones 1 and 2, were grown under normoxia (20% O2) (n = 6 for each time point, P < .001 at 72 hours and 96 hours, 2-way ANOVA). (D) Contact-independent growth of Nalm6 cells with CRISPR/Cas9-mediated MKO. Quantitative evaluation in methylcellulose-based colony formation assay (n = 4, P < .001, results are presented as mean plus or minus SD; 1-way ANOVA). (E) Survival curves of mice transplanted with Nalm6 MKO and Cas9-only control cells (n = 8 for MKO group, n = 9 for CTRL, P < .001). (F-G) Xenograft transplantation of Nalm6 cells with either MKO (n = 8) or control (n = 9) in Rag2−/−yc−/− mice. Weight of liver and spleens in grams (P = .0026 [liver] and P = .0008 [spleen], results are presented as mean plus or minus SD; unpaired Student t test). **P < .01; ***P < .001.
MKO mediated by CRISPR/Cas9 reduces proliferation and clonogenicity of B-ALL cells in vitro and tumorigenicity in vivo. (A) Representative western blot with anti-MondoA antibody of Nalm6 MKO clone 1 and clone 2 lysates; Cas9-only transfected Nalm6 B-ALL cell line as control; GAPDH as loading control. (B) Long-term proliferation measured with BrdU assay (n = 6 for each time point, P < .01 at 48 hours and P < .001 at 72 hours, 2-way ANOVA). (C) Long-term proliferation measured by direct cell counting. Cas9-only transfected Nalm6 cell line and MKO clones 1 and 2, were grown under normoxia (20% O2) (n = 6 for each time point, P < .001 at 72 hours and 96 hours, 2-way ANOVA). (D) Contact-independent growth of Nalm6 cells with CRISPR/Cas9-mediated MKO. Quantitative evaluation in methylcellulose-based colony formation assay (n = 4, P < .001, results are presented as mean plus or minus SD; 1-way ANOVA). (E) Survival curves of mice transplanted with Nalm6 MKO and Cas9-only control cells (n = 8 for MKO group, n = 9 for CTRL, P < .001). (F-G) Xenograft transplantation of Nalm6 cells with either MKO (n = 8) or control (n = 9) in Rag2−/−yc−/− mice. Weight of liver and spleens in grams (P = .0026 [liver] and P = .0008 [spleen], results are presented as mean plus or minus SD; unpaired Student t test). **P < .01; ***P < .001.
MondoA suppresses MYC targets, fatty acid metabolism, Oxphos, and ROS-pathway genes in B-ALL
To better understand the underlying molecular mechanisms of how MondoA conferred aggressiveness in B-ALL, we performed microarray analyses of various B-ALL lines. For these experiments, we first analyzed Nalm6, 697, and REH harboring MKD. Second, we analyzed Nalm6 cells with MKO; 151 and 255 genes were upregulated and downregulated, respectively, upon MKD. MKO cells differentially expressed 1657 genes, with 1087 being upregulated (fold change [FC], ≥1.4) and 570 downregulated (FC, ≤0.7). Notably, 321 gene alterations (11.3%) overlapped in both MKD and MKO cells, and show similar patterns in network analyses (supplemental Figure 2C). Gene-set enrichment analyses (GSEAs) showed a significant downregulation of Myc target genes, as well as Oxphos, reactive oxygen species (ROS) pathways, DNA repair, and fatty acid metabolism genes in MondoA-competent cells. This suggests an essential role of MondoA in regulating metabolic pathways and downregulating energy-producing cascades as well as ROS-generating processes (Figure 4). Validation of microarray data by qRT-PCR is shown in supplemental Figure 2D-F.
![MondoA suppresses MYC targets including fatty acid metabolism, Oxphos, and ROS-pathway genes in B-ALL. (A) GSEA data summary represented as network generated using Cytoscape (version 3.7.1). Nodes depicted in the networks represent Hallmarks from GSEA with a false discovery rate (FDR) q-val < 0.05. Red color indicates negative normalized enrichment score (NES; overexpressed in MKD [REH, Nalm6, 697]) compared with control cell lines (REH, Nalm6, 697). Size of nodes corresponds to the number of genes in the pathway that belong to the core enrichment in gene set. Saturation intensity represents absolute NES. Edges connecting nodes represent number of genes that are shared between the 2 gene sets. (B) GSEA summary represented as network of Nalm6 cell lines either MKO or control Nalm6. Data representation as described in panel A. (C) Enrichment plots of significantly altered gene sets as yielded by the GSEA of microarray data of Nalm6 cell line with and without MKO. GSEA summary for MKO as well as GSEA summary for 3 cell lines (REH, Nalm6, 697) with knockdown in supplemental Figure 3C-D. Gene sets stimulated by MondoA according to MKD and MKO experiments are shown in supplemental Figure 3A-B. Heat maps showing representative genes comprising MYC-target, Oxphos, fatty acid metabolism, and glycolysis gene sets are shown in supplemental Figure 3E.](https://ash.silverchair-cdn.com/ash/content_public/journal/blood/139/8/10.1182_blood.2020007932/6/m_bloodbld2020007932f4.png?Expires=1769129520&Signature=vj16Dry5txnyxDC8koAfA2GJOr5QfggTTobuF6szjZZS21Ule0fRVwbzwfHq3a0pM8npVdSDVrgdAKlBEnHE64JuSNBF6jdUQQJW0FUHR6grtfxAslEXzaGQqy0nmzJ5dkH8Gus-bhSABqyk8Md7SXzXJLPaHwdWjiHDbA5ygkpvhEPFf9hCCUvENv2fLTE3dYRa00IYbzv4vgHJDziZoAlXNY8fDL0TzNnj9fFLATCj4LU~F6D5A3zsFahUKH4zq8RcAHNwni0k6-hWkHgoF4NkvXlypw70LHiAUBv-B0GaYf-Xb3PMUG7PKOvFPlPsO74T5oYbw3EDKuGWjxrjqQ__&Key-Pair-Id=APKAIE5G5CRDK6RD3PGA)
MondoA suppresses MYC targets including fatty acid metabolism, Oxphos, and ROS-pathway genes in B-ALL. (A) GSEA data summary represented as network generated using Cytoscape (version 3.7.1). Nodes depicted in the networks represent Hallmarks from GSEA with a false discovery rate (FDR) q-val < 0.05. Red color indicates negative normalized enrichment score (NES; overexpressed in MKD [REH, Nalm6, 697]) compared with control cell lines (REH, Nalm6, 697). Size of nodes corresponds to the number of genes in the pathway that belong to the core enrichment in gene set. Saturation intensity represents absolute NES. Edges connecting nodes represent number of genes that are shared between the 2 gene sets. (B) GSEA summary represented as network of Nalm6 cell lines either MKO or control Nalm6. Data representation as described in panel A. (C) Enrichment plots of significantly altered gene sets as yielded by the GSEA of microarray data of Nalm6 cell line with and without MKO. GSEA summary for MKO as well as GSEA summary for 3 cell lines (REH, Nalm6, 697) with knockdown in supplemental Figure 3C-D. Gene sets stimulated by MondoA according to MKD and MKO experiments are shown in supplemental Figure 3A-B. Heat maps showing representative genes comprising MYC-target, Oxphos, fatty acid metabolism, and glycolysis gene sets are shown in supplemental Figure 3E.
MondoA suppresses MYC targets including fatty acid metabolism, Oxphos, and ROS-pathway genes in B-ALL. (A) GSEA data summary represented as network generated using Cytoscape (version 3.7.1). Nodes depicted in the networks represent Hallmarks from GSEA with a false discovery rate (FDR) q-val < 0.05. Red color indicates negative normalized enrichment score (NES; overexpressed in MKD [REH, Nalm6, 697]) compared with control cell lines (REH, Nalm6, 697). Size of nodes corresponds to the number of genes in the pathway that belong to the core enrichment in gene set. Saturation intensity represents absolute NES. Edges connecting nodes represent number of genes that are shared between the 2 gene sets. (B) GSEA summary represented as network of Nalm6 cell lines either MKO or control Nalm6. Data representation as described in panel A. (C) Enrichment plots of significantly altered gene sets as yielded by the GSEA of microarray data of Nalm6 cell line with and without MKO. GSEA summary for MKO as well as GSEA summary for 3 cell lines (REH, Nalm6, 697) with knockdown in supplemental Figure 3C-D. Gene sets stimulated by MondoA according to MKD and MKO experiments are shown in supplemental Figure 3A-B. Heat maps showing representative genes comprising MYC-target, Oxphos, fatty acid metabolism, and glycolysis gene sets are shown in supplemental Figure 3E.
MondoA and MYC gene expression inversely correlates and MondoA enhances pharmacological MYC inhibition
MYC targets were found to be upregulated in ALL with overexpressed MYC and downregulated in MondoA-overexpressing (MOE) B-ALL. We then compared MondoA and MYC mRNA levels in different subtypes of leukemia defined by chromosomal aberrations. MYC is overexpressed in B-ALL with t(v;11q23.3); KMT2A rearranged (pro-B-ALL with MLL rearranged [MLLr]) and B-ALL with IGH-MYC fusion t(8;14) (FC, 2.39) in comparison with normal B-cell progenitor cells and normal mature blood nuclear cells (Figure 5A). Interestingly, we observed high MondoA expression in B-ALL subtypes with no Myc overexpression. In those, MondoA mRNA levels were increased in comparison with normal B-cell precursor cells and normal mature blood nuclear cells (Figure 5B). RNA-Seq data of 132 primary ALL BM samples confirmed the inverse correlation of MYC and MondoA (Figure 5C). MYC and MondoA also inversely correlate in B-cell maturation: while Mondo A decreases, MYC increases with maturation (Figure 5A-B).

MondoA and MYC gene expression inversely correlates, MondoA enhances pharmacological MYC inhibition, and loss of MondoA leads to significant redistribution of MYC toward DNA-binding sites shared with MondoA. (A) MYC (202431_s_at) expression in different subtypes of B-ALL defined according to chromosomal aberration, normal B cells, and whole blood. (B) MondoA (MLXIP, 202519_at) expression in different subtypes of B-ALL defined according to chromosomal aberration. All data sets were normalized simultaneously using RMA and custom microarray (v15 ENTREZG) CDF files. (C) Dot plot indicates significant inverse correlation between MYC and MondoA (MLXIP) gene expression. RNA-Seq data from TARGET Pan-Cancer (Xena). (D) WB showing MondoA, poly (ADP-ribose) polymerase (PARP), cleaved-PARP (cl-PARP), and MYC under pharmacological inhibition of MYC by JQ1 (400 nM, 16 hours), GAPDH as loading control. (E) Line graph showing relative cell viability after 48 hours of JQ1 treatment at various concentrations. The y-axis represents the percentage of viable cells (Ctrl, MKO, and MOE cells) related to total number of cells as measured by Celigo S Imaging Cytometer (Nexcelom Bioscience). Live cells were measured by costaining cells with Hoechst 33342 to identify nuclei and fluorescently labeled CalceinAM (C3099; Thermo Fisher Scientific) to identify live cells. (F) Overlap of MondoA-bound genes with genes that are differentially expressed in MKO (log FC, ≥0.4 and ≤ −0.4). The diagram created with online tool Venny 2.1. Detailed ChIP-Seq data in supplemental Table 1. MondoA binding peaks and joint expression pathway analyses (G) Overlap of MondoA-bound genes with genes that are MYC target genes. (H) Average coverage profile of MYC-binding sites on DNA not overlapping (left) and overlapping with MondoA (right) binding sites. The drop in binding affinity in Myc-MKO compared with Myc-MondoA wildtype (MWT) is noticeably larger in MYC-binding sites, which are distant from MondoA-binding sites. (I) Box plot shows statistically significant increase in log2 Fc of Myc-MKO over Myc-MWT for Myc-binding sites overlapping or in close vicinity to MondoA-binding sites. (J) ChIP-Seq peak coverage was visualized with Integrated Genome Browser (IGB). Gene description is given in “Results.” cALL, common ALL. **P < .01; ***P < .001.
MondoA and MYC gene expression inversely correlates, MondoA enhances pharmacological MYC inhibition, and loss of MondoA leads to significant redistribution of MYC toward DNA-binding sites shared with MondoA. (A) MYC (202431_s_at) expression in different subtypes of B-ALL defined according to chromosomal aberration, normal B cells, and whole blood. (B) MondoA (MLXIP, 202519_at) expression in different subtypes of B-ALL defined according to chromosomal aberration. All data sets were normalized simultaneously using RMA and custom microarray (v15 ENTREZG) CDF files. (C) Dot plot indicates significant inverse correlation between MYC and MondoA (MLXIP) gene expression. RNA-Seq data from TARGET Pan-Cancer (Xena). (D) WB showing MondoA, poly (ADP-ribose) polymerase (PARP), cleaved-PARP (cl-PARP), and MYC under pharmacological inhibition of MYC by JQ1 (400 nM, 16 hours), GAPDH as loading control. (E) Line graph showing relative cell viability after 48 hours of JQ1 treatment at various concentrations. The y-axis represents the percentage of viable cells (Ctrl, MKO, and MOE cells) related to total number of cells as measured by Celigo S Imaging Cytometer (Nexcelom Bioscience). Live cells were measured by costaining cells with Hoechst 33342 to identify nuclei and fluorescently labeled CalceinAM (C3099; Thermo Fisher Scientific) to identify live cells. (F) Overlap of MondoA-bound genes with genes that are differentially expressed in MKO (log FC, ≥0.4 and ≤ −0.4). The diagram created with online tool Venny 2.1. Detailed ChIP-Seq data in supplemental Table 1. MondoA binding peaks and joint expression pathway analyses (G) Overlap of MondoA-bound genes with genes that are MYC target genes. (H) Average coverage profile of MYC-binding sites on DNA not overlapping (left) and overlapping with MondoA (right) binding sites. The drop in binding affinity in Myc-MKO compared with Myc-MondoA wildtype (MWT) is noticeably larger in MYC-binding sites, which are distant from MondoA-binding sites. (I) Box plot shows statistically significant increase in log2 Fc of Myc-MKO over Myc-MWT for Myc-binding sites overlapping or in close vicinity to MondoA-binding sites. (J) ChIP-Seq peak coverage was visualized with Integrated Genome Browser (IGB). Gene description is given in “Results.” cALL, common ALL. **P < .01; ***P < .001.
Next, we asked whether inhibition of MYC alters the phenotype in combination with the loss of MondoA. Bidirectional repression of MYC by MondoA and MondoA by MYC was shown by western analysis of MOE clones and pharmacological inhibition of MYC by JQ1. MYC inhibition with JQ1 not only appears to slightly induce MondoA, but MYC levels are also changed with MondoA loss or overexpression (Figure 5D; supplemental Figure 4G). Interestingly, MondoA also enhanced the sensitivity to inhibition with JQ1 (Figure 5E).
ChIP-Seq analysis reveals redistribution of MYC DNA binding toward MondoA-binding sites upon loss of MondoA
Chromatin immunoprecipitation (ChIP) sequencing (ChIP-Seq) analysis was used to ascertain whether a subset of targets, identified by transcriptomics, is directly bound on their promoters, enhancers, or gene body by MondoA. We looked at both MYC and MondoA occupancy in the presence and absence of MondoA. This allowed for the identification of the proximal cause of altered gene expression upon loss of MondoA. Looking at specific genes, the canonical MondoA targets thioredoxin-interacting protein (TXNIP), arrestin domain containing 4 (ARRDC4), and Krüppel-like factor 10 (KLF10; alias transforming growth factor β–inducible early growth response protein), as expected, ranked among the top MondoA-binding sites. When we correlated MondoA occupancy with gene-expression changes in MKO cells, we found that ∽10% of the genes downregulated and ∽10% of upregulated genes were directly bound by MondoA in WT (Figure 5F); 85% of MondoA DNA target genes were found to be shared by MYC (Figure 5G). Multiple genes involved in metabolism were identified as direct MondoA targets but not PDK1 (supplemental Table 1). Comparison of expression with ChIP-Seq data revealed 86 genes down in MKO vs WT, indicating direct induction by binding of MondoA to their promotors. These 86 genes include TXNIP and KLF10. Adjusted P values of pathway analyses (MSigDB Hallmark 2020) were >.1 (supplemental Table 1). In contrast, 186 genes were upregulated in MKO, indicating direct suppression (supplemental Table 2). Adjusted P values of pathway analyses were highly significant for MYC targets and <.07 for glycolysis (supplemental Table 1).
Gene ontology (GO)/Kyoto Encyclopedia of Genes and Genomes (KEGG)/Reactome/Biocarta-pathway analyses of general promotor binding by MondoA revealed, among others, DNA and RNA binding, ribosome, spliceosome, and oxidative stress response to be significantly regulated (supplemental Table 3.1). Adjusted P values for pathway analyses regulated by MondoA DNA binding to genes not shared with MYC binding were >0.1 (supplemental Table 3.2). These findings suggest that the proximal cause of alteration of metabolic gene expression by MondoA is not solely binding of MondoA to the promotor regions of its target genes but is more complex and highly contextual. In addition to metabolic pathways, MondoA can regulate other cellular functions, mainly in conjunction with MYC.
Thus, we asked next which MondoA-repressed MYC targets are directly bound by MondoA and which were just MYC dependent. To gauge whether MondoA is just repressing MYC itself, or, competing with MYC for shared genomic targets, and how MondoA affects genome-wide MYC binding, we compared MYC-binding sites overlapping with MondoA-binding sites to MYC-binding sites with no MondoA binding in MondoA WT vs MKO cells. TXNIP as a canonical target of MondoA vs MYC competition was used as validation. In general, we found a modest but highly significant redistribution of MYC toward binding sites shared with MondoA upon loss of MondoA (Figure 5H-I; supplemental Table 3). Many MYC peaks at locations where we also saw a specific MondoA peak tended to increase in MKO cells. In contrast, MYC binding is decreased in MKO, in particular at targets without MondoA binding. For example, canonical MondoA targets TXNIP and KLF10, as well as the noncanonical targets LAS1-like ribosome biogenesis factor (LAS1L) and TMEM97 (membrane protein implicated in cholesterol homeostasis), all shared by MYC and MondoA, show increased binding of MYC at various degrees upon loss of MondoA. Of interest, LAS1L displays a double MYC-binding peak. MYC binding increases at the site co-occupied by MondoA in MKO, whereas it decreases at the site without MondoA binding. Moreover, MYC binding to tubulin-β-4A (TUBB4A) and COMTD1 (catecholamine metabolism), not shared with MondoA, decreases in MKO (Figure 5J).
GO/KEGG/Reactome/Biocarta analyses of pathways, favored by MYC redistribution to MondoA-binding sites in MKO, revealed, among others, transforming growth factor β signaling (Reactome; adjusted P .0015) in addition to RNA binding (GO), ribosome, spliceosome (KEGG), and stress response (Reactome) (supplemental Table 4).
MondoA provides leukemia stress resistance by limiting Oxphos via increased PDK activity and can be targeted by a designer drug
To further investigate the metabolic restriction mediated by MondoA, we initially performed a proliferation assay comparing 2 MKO clones with an MOE clone and control cells. MKO clones proliferated at significantly lower rates than both control and MOE cells (Figure 6A). Because our GSEA suggested that Oxphos is reduced by MondoA, we measured mitochondrial respiration by determining cellular OCR using an extracellular flux analyzer. MKO cells displayed a significantly higher rate of basal mitochondrial respiration compared with controls as well as MOE cells (Figure 6B,D). Additionally, adenosine triphosphate (ATP) production (ie, the difference between basal respiration and respiration following oligomycin treatment [Figure 6B,E]) and the maximum respiratory capacity (after addition of FCCP [Figure 6B,F]) were increased in MKO cells compared with controls. Increased OCR in MKO was accompanied by significantly increased basal glycolysis (extracellular acidification rate [ECAR], as an indicator of glycolysis). In line with this, MOE reduced glycolysis back to control cell levels (Figure 6C,G). Consistent with the induction of glycolysis, in metabolomic analysis, 2 different MKO lines secrete more lactate and take up more glucose from the medium compared with controls (Figure 6H). Of interest, metabolomic analysis also revealed decreased serine biosynthesis from the 3-phosphoglycerate intermediate (supplemental Figure 4F). Notably, overexpression did not restore low WT lactate, suggesting a bimodal effect of Mondo A on glycolysis. Nevertheless, these findings together indicate that MondoA limits Oxphos and glycolysis in B-ALL cells.
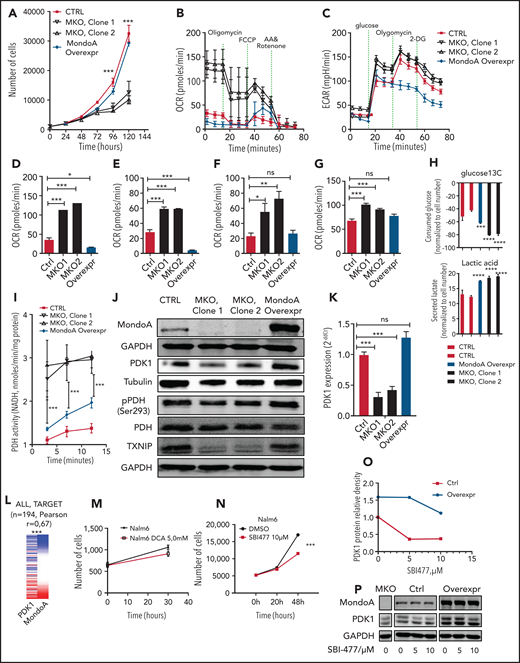
MondoA provides leukemia stress resistance by limiting Oxphos and fatty acid synthesis via decreased PDH activity. (A) Long-term proliferation measured by direct cell counting. Control Cas9-only Nalm6 B-ALL cell line, MondoA overexpression, and MKO, grown under normoxia (20% O2) (n = 6 for each time point, P < .001 at 96 hours and 120 hours). (B) Mitochondrial respiration determined by cellular OCR in control, MKO clones, and Nalm6 cells with MondoA overexpression using a Seahorse extracellular flux analyzer (Agilent). (C) Glycolysis determined by ECAR in control, MKO clones, and Nalm6 cells with MondoA overexpression using a Seahorse extracellular flux analyzer (Agilent). (D) Basal respiration as measured OCR before oligomycin injection (P < .05 and P < .001, 2-way ANOVA with Bonferroni posttest). (E) ATP production is measured as the difference between basal respiration and OCR levels after oligomycin injection. (F) Maximal respiration as measured by OCR levels after FCCP injection (P < .05 and P < .01, 2-way ANOVA with Bonferroni posttest). (G) Glycolysis as measured as the difference between basal ECAR and ECAR levels after glucose injection. (H) Gas chromatography–mass spectrometry quantification of glucose uptake from, and lactate secretion into, culture medium of the indicated cell lines (P ≤ .0001, 2-way ANOVA with the Tukey multiple comparisons test). (I) PDH activity assessed by NADH production. PDH activity in control, MKO, and MOE Nalm6 cells assessed by the colorimetric PDH activity assay kit (n = 3 for each time point, P < .001, 2-way ANOVA with the Bonferroni posttest). (J) Western blot showing MondoA, total PDK1, pPDH (Ser293), total PDH, TXNIP, α-tubulin, and GAPDH as loading controls in Cas9-only control Nalm6 cells, MKO, and MOE cells. (K) PDK1 mRNA in MKO clones compared with CTRL and MOE clones measured by qRT-PCR (P < .001, 2-way ANOVA with the Bonferroni posttest). (L) Heat map showing PDK1 gene coexpression with MondoA in B-ALL. RNA-Seq data of 194 primary ALL patient samples (TARGET) from Xena browser. (M) Pharmacological inhibition of Nalm6 cell proliferation with PDK-inhibitor dichloroacetic acid (DCA; 5 mM) as measured by live cell analysis with image-based cytometry. (N) Pharmacological inhibition of Nalm6 cell proliferation with MondoA-inhibitor SBI477 (10 µM) as measured by live cell analysis with image-based cytometry. (O) Line graph and (P) western blot showing PDK1 protein relative density in Nalm6 control cells and MOE cells after 16 hours of SBI477 treatment at various concentrations (0, 5, 10 µM). DMSO, dimethyl sulfoxide. *P < .05; **P < .01; ***P < .001; ****P < .0001.
MondoA provides leukemia stress resistance by limiting Oxphos and fatty acid synthesis via decreased PDH activity. (A) Long-term proliferation measured by direct cell counting. Control Cas9-only Nalm6 B-ALL cell line, MondoA overexpression, and MKO, grown under normoxia (20% O2) (n = 6 for each time point, P < .001 at 96 hours and 120 hours). (B) Mitochondrial respiration determined by cellular OCR in control, MKO clones, and Nalm6 cells with MondoA overexpression using a Seahorse extracellular flux analyzer (Agilent). (C) Glycolysis determined by ECAR in control, MKO clones, and Nalm6 cells with MondoA overexpression using a Seahorse extracellular flux analyzer (Agilent). (D) Basal respiration as measured OCR before oligomycin injection (P < .05 and P < .001, 2-way ANOVA with Bonferroni posttest). (E) ATP production is measured as the difference between basal respiration and OCR levels after oligomycin injection. (F) Maximal respiration as measured by OCR levels after FCCP injection (P < .05 and P < .01, 2-way ANOVA with Bonferroni posttest). (G) Glycolysis as measured as the difference between basal ECAR and ECAR levels after glucose injection. (H) Gas chromatography–mass spectrometry quantification of glucose uptake from, and lactate secretion into, culture medium of the indicated cell lines (P ≤ .0001, 2-way ANOVA with the Tukey multiple comparisons test). (I) PDH activity assessed by NADH production. PDH activity in control, MKO, and MOE Nalm6 cells assessed by the colorimetric PDH activity assay kit (n = 3 for each time point, P < .001, 2-way ANOVA with the Bonferroni posttest). (J) Western blot showing MondoA, total PDK1, pPDH (Ser293), total PDH, TXNIP, α-tubulin, and GAPDH as loading controls in Cas9-only control Nalm6 cells, MKO, and MOE cells. (K) PDK1 mRNA in MKO clones compared with CTRL and MOE clones measured by qRT-PCR (P < .001, 2-way ANOVA with the Bonferroni posttest). (L) Heat map showing PDK1 gene coexpression with MondoA in B-ALL. RNA-Seq data of 194 primary ALL patient samples (TARGET) from Xena browser. (M) Pharmacological inhibition of Nalm6 cell proliferation with PDK-inhibitor dichloroacetic acid (DCA; 5 mM) as measured by live cell analysis with image-based cytometry. (N) Pharmacological inhibition of Nalm6 cell proliferation with MondoA-inhibitor SBI477 (10 µM) as measured by live cell analysis with image-based cytometry. (O) Line graph and (P) western blot showing PDK1 protein relative density in Nalm6 control cells and MOE cells after 16 hours of SBI477 treatment at various concentrations (0, 5, 10 µM). DMSO, dimethyl sulfoxide. *P < .05; **P < .01; ***P < .001; ****P < .0001.
Next, we analyzed the effect of MondoA on pyruvate shunting into the TCA cycle. PDH is an essential enzyme complex in the mitochondria that catalyzes the reaction from pyruvate to acetyl-CoA, which is subsequently used for the TCA cycle and Oxphos.24 In view of the increased oxidative capacity of MondoA-deficient cells, we assessed PDH activity in those cells by examining Ser293 phosphorylation, which leads to its inactivation (pPDH). MKO clones showed decreased pPDH in comparison with CTRL or MOE. Control cells and cells with MondoA overexpression did not demonstrate a significant difference in active PDH (Figure 6J).
Phosphorylation of PDH is catalyzed by PDK.25 Correspondingly, reduced PDK levels were observed at the protein and mRNA levels in the absence of MondoA (Figure 6J-K). Consistent with this, we observed a similar correlation in patient RNA-Seq data sets (UCSC Xena, TARGET), whereby MondoA overexpression was highly correlated with increased expression of PDK1 transcripts (Figure 6L). Utilizing live cell analysis with image-based cytometry, we demonstrated inhibition of proliferation in high MondoA-expressing cell line Nalm6 via pharmacological inhibition of PDK (Figure 6M). Finally, pharmacological inhibition of MondoA with the designer compound SBI-477 reduced PDK1, drug and target dose dependently, in CTRL and MOE to levels of MKO cells (Figure 6N-P). ChIP-Seq analysis revealed that MondoA effect on PDK1 appears to be transcriptionally indirect. Taken together, our data suggest that MondoA induces PDK mRNA expression to reduce Oxphos in B-ALL cells.
Because it would be of translational importance to know whether pharmacological inhibition affects viability and/or recapitulates the effects of loss of MondoA in KD and KO cell lines, we assessed pharmacological inhibition of MondoA with the designer compound SBI-477. Utilizing a high-throughput drug-discovery platform, we demonstrated SBI-477 to inhibit proliferation of high MondoA-expressing B-ALL lines (Figure 6N; supplemental Figure 4E).
MondoA confers adaptation to metabolic stress, induces glutamine anaplerosis, and limits ROS production in B-ALL cells
Although the process of Oxphos is highly efficient for generating ATP in cells, it poses high levels of endogenous ROS through the electron transport chain, which in turn can result in damage to DNA and proteins.26 To investigate whether MondoA reduces Oxphos in B-ALL cells to limit the production of ROS, we measured ROS levels in the presence and absence of MondoA. Indeed, under normal media conditions, control cells expressing MondoA generated significantly less ROS than MKO cells (Figure 7A). Cells downregulate their TCA cycle activity under glutamine starvation, possibly to limit ROS accumulation.27-30 To investigate whether MondoA similarly facilitates adaptation to metabolic stress, we conditioned B-ALL cells in glutamine-depleted culture medium for 24 hours. Notably, MKO cells showed higher ROS levels under glutamine starvation, whereas no differences in ROS levels were observed in control cells under the same conditions (Figure 7A). Moreover, although there was only a small increase in cell death in MKO compared with control cells under glutamine-replete conditions, MKO cells showed a marked decrease in viability when starved of glutamine (Figure 7B). Markedly, MondoA depletion resulted in an inability to reduce PDH activity under glutamine starvation; in contrast, MOE cells significantly reduced PDH activity under the same conditions (Figure 7C). Additionally, induction of apoptosis by glutamine starvation was not only reversed by glutamine but also, at least in part, by blockade of respiratory chain ATP synthase utilizing oligomycin (Figure 7D). Inhibition of MondoA with SBI-477 reproduced the apoptotic phenotype of MKO. Overexpression of MondoA attenuated apoptosis induction by pharmacological MondoA inhibition (Figure 7D).

MondoA confers adaptation to metabolic stress, induces glutamine anaplerosis, and limits ROS production in B-ALL cells. (A) Cellular ROS measurement of Nalm6 MKO and control cells under either glutamine (GLN) withdrawal or full media. 2′,7′-Dichlorodihydrofluorescein diacetate (H2DCFDA) fluorescence measured by flow cytometry (n = 3 for each experimental condition, P < .001, 1-way ANOVA with the Bonferroni posttest). (B) Cell death rate determined by Annexin V and 7-aminoactinomycin D (7AAD) staining in control and MKO cells in either full medium or medium lacking GLN (n = 3 for each experimental condition, P < .05, P < .01, or P < .001, 1-way ANOVA with the Bonferroni posttest). (C) PDH activity assessed by NADH production. PDH activity in MKO and MOE Nalm6 cells with or without GLN starvation assessed by colorimetric PDH activity assay kit (n = 3 for each time point, P < .001, 2-way ANOVA with the Bonferroni posttest). (D) Western blot showing MondoA, PARP and cl-PARP, and pPDH and total PDH in control Nalm6 cells and cells with MondoA overexpression under 16 hours of GLN starvation and oligomycin (2.5 µM) or SBI477 (10 µM) treatment. GAPDH as loading control. (E) Relative cell viability after 16 hours of GLN starvation and αKG (5 mM). GLN (4 mM) readdition as a control as measured by Celigo S Imaging Cytometer (Nexcelom Bioscience). Live cells were measured by costaining cells with Hoechst 33342 to identify nuclei and fluorescently labeled CalceinAM (C3099; Thermo Fisher Scientific) to identify live cells. (F) Western blot showing MondoA, PARP, and cl-PARP in control Nalm6 cells, MKO and cells with MondoA overexpression under 16 hours of GLN starvation and asparagine (0.1 mM). GAPDH as loading control. (G) Western blot showing MondoA, PARP, and cl-PARP in control Nalm6 cells, MKO, and cells with MondoA overexpression under 16 hours of GLN starvation and glucose (20 mM). GAPDH as loading control. MFI, mean fluorescence intensity. *P < .05; **P < .01; ***P < .001.
MondoA confers adaptation to metabolic stress, induces glutamine anaplerosis, and limits ROS production in B-ALL cells. (A) Cellular ROS measurement of Nalm6 MKO and control cells under either glutamine (GLN) withdrawal or full media. 2′,7′-Dichlorodihydrofluorescein diacetate (H2DCFDA) fluorescence measured by flow cytometry (n = 3 for each experimental condition, P < .001, 1-way ANOVA with the Bonferroni posttest). (B) Cell death rate determined by Annexin V and 7-aminoactinomycin D (7AAD) staining in control and MKO cells in either full medium or medium lacking GLN (n = 3 for each experimental condition, P < .05, P < .01, or P < .001, 1-way ANOVA with the Bonferroni posttest). (C) PDH activity assessed by NADH production. PDH activity in MKO and MOE Nalm6 cells with or without GLN starvation assessed by colorimetric PDH activity assay kit (n = 3 for each time point, P < .001, 2-way ANOVA with the Bonferroni posttest). (D) Western blot showing MondoA, PARP and cl-PARP, and pPDH and total PDH in control Nalm6 cells and cells with MondoA overexpression under 16 hours of GLN starvation and oligomycin (2.5 µM) or SBI477 (10 µM) treatment. GAPDH as loading control. (E) Relative cell viability after 16 hours of GLN starvation and αKG (5 mM). GLN (4 mM) readdition as a control as measured by Celigo S Imaging Cytometer (Nexcelom Bioscience). Live cells were measured by costaining cells with Hoechst 33342 to identify nuclei and fluorescently labeled CalceinAM (C3099; Thermo Fisher Scientific) to identify live cells. (F) Western blot showing MondoA, PARP, and cl-PARP in control Nalm6 cells, MKO and cells with MondoA overexpression under 16 hours of GLN starvation and asparagine (0.1 mM). GAPDH as loading control. (G) Western blot showing MondoA, PARP, and cl-PARP in control Nalm6 cells, MKO, and cells with MondoA overexpression under 16 hours of GLN starvation and glucose (20 mM). GAPDH as loading control. MFI, mean fluorescence intensity. *P < .05; **P < .01; ***P < .001.
Because glutamine can either undergo anaplerosis or serve as a substrate for glutathione (GSH) and is known to restrict MondoA expression, we asked next whether induction of apoptosis by glutamine starvation in the absence of MondoA is due to reduced anaplerosis or to reduced ROS scavenger production.31 GSH supplementation led only to a marginal reduction of apoptosis under glutamine starvation in the absence of MondoA (supplemental Figure 4C). Besides, we could not demonstrate rescue of cell viability by various scavengers (GSH, N-acetylcysteine, tempol, data not shown) at all. In contrast, α-ketoglutarate (αKG) supplementation restored cell viability, concurrent with MondoA expression, to levels reached under glutamine repletion (Figure 7E), indicating that induction of apoptosis by glutamine starvation in the absence of MondoA is due to reduced anaplerosis. Concomitantly, under glutamine starvation, oligomycin and to a lesser degree SBI477 reduced pPDH. Concurrently, oligomycin, but not SBI477, rescued WT cells from apoptosis (Figure 7D).
Leukemia cells consume large quantities of glutamine to maintain TCA cycle anaplerosis. Asparagine is necessary and sufficient to suppress glutamine withdrawal–induced apoptosis without restoring the levels of other nonessential amino acids or TCA cycle intermediates. Reduced TCA cycle activity and diverted production of nonessential amino acids aspartate and asparagine out of oxaloacetate are required. l-asparaginase is an essential part of childhood ALL treatment. It depletes both asparagine and glutamine and induces ALL cell apoptosis.32 We hypothesized that MondoA is required for asparagine-mediated rescue of apoptosis induced by glutamine withdrawal in ALL. MKO cells demonstrate increased apoptosis under glutamine withdrawal, which was almost entirely rescued by addition of asparagine. MOE cells were less sensitive to glutamine withdrawal and asparagine substituted the absence of glutamine (Figure 7F; supplemental Figure 4A).
During leukemia induction treatment, most children have increased nutritional intake and increased circulating glucose due to steroid-induced hyperphagia. MondoA regulates glucose uptake via its canonical downstream target TXNIP. TXNIP suppresses glucose uptake by binding to the glucose transporter GLUT1 and inducing GLUT1 internalization, as well as by reducing the level of GLUT1 mRNA.33 We hypothesized that MondoA is required for leukemia cells to tolerate steroid-induced hyperglycemia in glutamine- and asparagine-depleted condition. We tested apoptosis induction and pPDH under glutamine withdrawal in the absence of asparagine and additional (20 mM) glucose. Our results demonstrate induction of apoptosis under a hyperglycemia-imitating condition in control cells and in those MKO clones, in which glutamine withdrawal itself did not induce maximum apoptosis. Concurrently, overexpression of MondoA provided resistance against depletion of both amino acids plus hyperglycemia (Figure 7G; supplemental Figure 4). These results indicate that hyperglycemia is detrimental for the leukemia cells in amino acid starvation and that MondoA is critically involved in resistance to such metabolic treatments.
It has been previously indicated that glucose-responsive transcriptional activity of MondoA coordinates glucose availability with glutamine uptake.34 Our data expand these findings by demonstrating that MondoA enables cell survival in nutrient-scarce conditions via coordinating Oxphos and glycolysis.
Although further studies are necessary to fully uncover the mechanism, these data suggest that loss of MondoA renders B-ALL cells unable to reduce PDH activity and therefore the TCA cycle in response to starvation. We postulate that in this way, MondoA enables leukemia cells to switch to glutamine anaplerosis under nutrient stress conditions.
Discussion
Our findings establish MondoA as a malignancy factor in common B-ALL by providing adaptation to metabolic stress via dialing down Krebs cycle activity and subsequent generation of ROS, in line with our previous findings.21 This supports the notion that, in glutamine-dependent tumor entities, such as neuroblastoma or B-ALL, MondoA propagates malignancy.17 While in neuroblastoma, the loss of MondoA results in downregulation of Oxphos and metabolic activity,16 we see a different mechanism in B-ALL, whereby MondoA senses metabolic stress and restricts Oxphos to a sustainable level. This is achieved at least in part by reducing PDH activity in glutamine-scarce environments. Moreover, MondoA restricts Oxphos and PDH activity, to adapt to glutamine starvation. Oxphos is a major endogenous source of ROS and can result in lethality through oxidation of many essential components in a proliferating cell.35 Carefully regulated ROS generation as well as scavenge mediated through MondoA is hence essential for sustaining B-ALL. Although MondoA restriction of Oxphos is associated with increased serine biosynthesis, it may hypothetically also favor generation of other building blocks (purins, fatty acids, glycolipids, and phospholipids) contributing to the Warburg effect. Besides, MondoA supports MYC DNA binding at a global level, possibly by indirectly favoring MYC/MAX heterodimerization,17 while competing at binding sites shared with MYC.
Additionally, we show the clinical relevance of MondoA expression in B-ALL patients. Their data sets allowed us to explore the role of MondoA in B-ALL by assessing high expression in B-ALL compared with solid tumors and other hematopoietic malignancies, and documenting its role for the aggressiveness of leukemia in vitro and in vivo as well as its consequences for gene expression and metabolic function. However, this remains a surprising finding because MondoA downregulation being required for proliferation has been described for glycolytic tumors, triple-negative breast cancer, or malignant melanoma.20 As mentioned earlier, in neuroblastoma, an opposing role of MondoA has already been described,17 confirming our previous observation of MondoA as a malignancy factor. Thus, the role of the MondoA axis, including its canonical downstream target TNXIP, is highly contextual in solid vs liquid malignancies. Given that these different malignancy types have disparate metabolic requirements due to their specific microenvironments, this finding might not be too surprising: although the priority of solid tumors is to adapt to oxygen-scarce, hypoxic environments to generate enough ATP, leukemias live in the land of plenty and need to be protected from the detrimental effects of oxygen abundance. MondoA seems to function in both. Last not least, the data presented here may also warrant further assessment of MondoA expression as a biomarker of resistance against metabolic treatment modalities.
In conclusion, our findings indicate that the role of MondoA in regulating metabolic processes is highly contextual and heavily depends on the metabolic profile of the specific malignancy type. In pediatric B-ALL, MondoA overexpression correlates with an inferior clinical outcome due to the metabolic adaptive capabilities of MondoA. Interference with MondoA or its downstream targets, such as TXNIP, by candidate inhibitors36,37 could render those cells inept to adaption and hence be a novel therapeutic target for B-ALL.
Acknowledgments
The authors thank Daniel P. Kelly (Cardiovascular Institute and Institute for Diabetes, Obesity and Metabolism, Department of Medicine, Perelman School of Medicine at the University of Pennsylvania, Philadelphia, PA) and Rick B. Vega (Sanford Burnham Prebys Medical Discovery Institute at Lake Nona, Orlando, FL) for providing SBI477. The authors also thank Torsten Haferlach (Munich Leukemia Laboratory [MLL]) for provision of annotated leukemia gene-expression data. The experimental support by Oxana Schmidt is gratefully acknowledged, as well as the graphical abstract art work by Ljuba Sipol. The authors also thank the following clinicians for providing samples used in this work: Katja Gall, Angela Wawer, and Irene Teichert-von Lüttichau. The authors appreciate the technical assistance provided by Nadine Kliese during the submission process.
A.S. received grants from Cura Placida, the Children’s Cancer Research Foundation (CP102/120815), and TRANSAID Stiftung für Krebskranke Kinder (8810001358 GCP). E.H. received a grant from the Else-Kröner-Stiftung. B.X. was supported by the Chinese Scholarship Council (CSC; no. 201908210290). The laboratory of T.G.P.G. was supported by grants from German Cancer Aid (DKH-70112257), the Gert and Susanna Mayer Foundation, and the Barbara and Wilfried Mohr Foundation. M.B. was supported by Doris Stiftung. S.E.G.B. and U.T. were supported by Willhelm Sander Stiftung und Cura Placida. D.B. was funded by the ATTRACT program (A14/BM/7632103), and a CORE grant (C18/BM/12691266) of the Luxembourg National Research Fund (FNR). EW was funded by European Research Council (TarMYC to) and German Research Foundation (DFG;WO 2108/1-1).
Authorship
Contribution: A.S. and E.H. coordinated and designed the study, performed all functional experiments, performed data analyses, wrote the paper, designed the figures, and helped with grant applications; B.X. and R.Ö. performed most experiments required for resubmission; J.H. and E.W. performed most experiments required for second resubmission; C.P., G.J., and M.B. did bioinformatic analysis; A.P. and A.G. provided guidance with ROS and hypoxia experiments and data analysis; D.G.F. and D.B. helped to investigate metabolism; T.G.P.G. participated in the study design, provided compilations of independent published microarray studies, helped write the paper and design the figures, and provided statistical guidance; J.S. analyzed the expression data of the BFM cohort patient samples; R.A.R. carried out histologic analyses for in vivo experiments; M.C.B. carried out analyses of independent published microarray studies; G.C. provided expression data for the patients comprising the BFM cohort; G.H.S.R. and U.T. provided biological and genetic guidance and helped with grant applications; R.R. and J.R. supervised the study and provided laboratory infrastructure; P.H.S. supervised the study and helped write the paper; S.E.G.B. initiated, designed, and supervised the study, analyzed the data, wrote the paper together with A.S. and E.H., and provided laboratory infrastructure and financial support; and all authors read and approved the final manuscript.
Conflict-of-interest disclosure: S.E.G.B. has an ownership interest in PDL BioPharma, and served as a consultant to EOS Biotechnology Inc, Bayer AG, and Swedish Orphan Biovitrum AB. S.E.G.B. and G.H.S.R. held US and EU intellectual properties in gene-expression analysis. The remaining authors declare no competing financial interests.
The current affiliation for A.S. is Munich Leukemia Laboratory (MLL), Munich, Germany.
The current affiliation for T.G.P.G. is Division of Translational Pediatric Sarcoma Research, German Cancer Research Center (DKFZ), Hopp-Children’s Cancer Center (KiTZ), and Institute of Pathology, Heidelberg University Hospital, Heidelberg, Germany.
The current affiliation for G.H.S.R. is Division of Oncology and Hematology, Department of Pediatrics, Charité–Universitaetsmedizin Berlin, Berlin, Germany.
The current affiliation for S.E.G.B. is Translational Pediatric Cancer Research–Institute of Pathology, TUM School of Medicine, Technical University of München, Munich, Germany and Department of Molecular Oncology, British Columbia Cancer Research Centre, Vancouver, BC, Canada.
Correspondence: Stefan Burdach, Translational Pediatric Cancer Research–Institute of Pathology, TUM School of Medicine, Technical University of Munich, Trogerstr 18, D-81675 Munich, Germany; e-mail: stefan.burdach@tum.de.
The full ChIPseq data as well as the full microarray data reported in this article have been deposited in the Gene Expression Omnibus database (accession numbers GSE168866 and GSE76277).
The online version of this article contains a data supplement.
The publication costs of this article were defrayed in part by page charge payment. Therefore, and solely to indicate this fact, this article is hereby marked “advertisement” in accordance with 18 USC section 1734.

This feature is available to Subscribers Only
Sign In or Create an Account Close Modal