

Key Points
The OHI index comprising soluble CD25 >3900 U/mL and ferritin >1000 ng/mL accurately identifies malignancy-associated HLH.
Soluble CD25 and ferritin assessment should be considered early in diverse HMs as the OHI index is highly predictive of mortality.

Abstract
Hemophagocytic lymphohistiocytosis (HLH) is a life-threatening inflammatory syndrome that may complicate hematologic malignancies (HMs). The appropriateness of current criteria for diagnosing HLH in the context of HMs is unknown because they were developed for children with familial HLH (HLH-2004) or derived from adult patient cohorts in which HMs were underrepresented (HScore). Moreover, many features of these criteria may directly reflect the underlying HM rather than an abnormal inflammatory state. To improve and potentially simplify HLH diagnosis in patients with HMs, we studied an international cohort of 225 adult patients with various HMs both with and without HLH and for whom HLH-2004 criteria were available. Classification and regression tree and receiver-operating curve analyses were used to identify the most useful diagnostic and prognostic parameters and to optimize laboratory cutoff values. Combined elevation of soluble CD25 (>3900 U/mL) and ferritin (>1000 ng/mL) best identified HLH-2004–defining features (sensitivity, 84%; specificity, 81%). Moreover, this combination, which we term the optimized HLH inflammatory (OHI) index, was highly predictive of mortality (hazard ratio, 4.3; 95% confidence interval, 3.0-6.2) across diverse HMs. Furthermore, the OHI index identified a large group of patients with high mortality risk who were not defined as having HLH according to HLH-2004/HScore. Finally, the OHI index shows diagnostic and prognostic value when used for routine surveillance of patients with newly diagnosed HMs as well as those with clinically suspected HLH. Thus, we conclude that the OHI index identifies patients with HM and an inflammatory state associated with a high mortality risk and warrants further prospective validation.
Medscape Continuing Medical Education online
In support of improving patient care, this activity has been planned and implemented by Medscape, LLC and the American Society of Hematology. Medscape, LLC is jointly accredited by the Accreditation Council for Continuing Medical Education (ACCME), the Accreditation Council for Pharmacy Education (ACPE), and the American Nurses Credentialing Center (ANCC), to provide continuing education for the healthcare team.
Medscape, LLC designates this Journal-based CME activity for a maximum of 1.00 AMA PRA Category 1 Credit(s)™. Physicians should claim only the credit commensurate with the extent of their participation in the activity.
Successful completion of this CME activity, which includes participation in the evaluation component, enables the participant to earn up to 1.0 MOC points in the American Board of Internal Medicine’s (ABIM) Maintenance of Certification (MOC) program. Participants will earn MOC points equivalent to the amount of CME credits claimed for the activity. It is the CME activity provider’s responsibility to submit participant completion information to ACCME for the purpose of granting ABIM MOC credit.
All other clinicians completing this activity will be issued a certificate of participation. To participate in this journal CME activity: (1) review the learning objectives and author disclosures; (2) study the education content; (3) take the post-test with a 75% minimum passing score and complete the evaluation at http://www.medscape.org/journal/blood; and (4) view/print certificate. For CME questions, see page 1117.
Disclosures
Editor Andrew Roberts's organization, the Walter and Eliza Hall Institute, received grants for clinical research from AbbVie Inc and Janssen Pharmaceuticals, Inc. The Walter and Eliza Hall Institute also received royalties related to venetoclax and will control any distribution based on their institutional policies about scientific contribution to commercial income. CME questions author Laurie Barclay, freelance writer and reviewer, Medscape, LLC, declares no competing financial interests.
Learning objectives
Upon completion of this activity, participants will:
- 1.
Compare clinical, diagnostic, and prognostic parameters and optimized laboratory cutoff values between patients with hematologic malignancies (HMs) and hemophagocytic lymphohistiocytosis (HLH) with HMs, according to an international cohort study
- 2.
Describe component features and diagnostic performance of the optimized HLH inflammatory (OHI) index, according to an international cohort study
- 3.
Determine clinical implications of diagnostic performance of the OHI index, according to an international cohort study
Release date: February 17, 2022; Expiration date: February 17, 2023
Introduction
Hemophagocytic lymphohistiocytosis (HLH) is a life-threatening hyperinflammatory syndrome with genetic and acquired etiologies. Familial HLH (FHL) is a genetic disorder caused by granule-mediated lymphocyte cytotoxic function defects occurring mainly in young children.1 By contrast, most adults with HLH lack FHL genetic variants2 and ∼50% have an underlying cancer, of which hematologic malignancies (HMs) are the most common.3,4 The diagnosis and treatment of HLH occurring in the context of HMs (HM-HLH) are largely based on extrapolations from clinical experience with FHL, along with expert opinion.3,5-8
Overall, HLH affects ∼1% of adults with an HM,9 although the incidence may reach 2.8% in cases with B-cell and T-cell lymphomas.10 T-cell lymphomas are more commonly associated with the development of HLH (35% of HM-HLH cases) than B-cell lymphoma (32% of HM-HLH cases),4,5 and myeloid malignancies may also be complicated by HM-HLH.11-14 HM-HLH has the worst prognosis of all HLH subgroups, with 5-year overall survival ranging from 10% to 30%.15,16
HLH is commonly defined by using the enrollment criteria from the HLH-2004 study, which were developed to diagnose pediatric FHL. HLH is diagnosed when a causative genetic mutation is identified or suspected based on family history or when a patient fulfills ≥5 of the HLH-2004 diagnostic criteria.17 The appropriateness of these criteria for the diagnosis of HM-HLH has not been determined. Furthermore, diagnostic cutoff levels for laboratory markers of HLH have not been optimized or validated in HM-HLH.18 In addition, although a number of these features are driven by inappropriate immune activation in FHL,19 their presence in HM may represent nonimmunologic effects of the malignant clone itself, such as infiltration of the marrow or spleen or soluble CD25 (sCD25) production by neoplastic cells. This has led to the suggestion that the syndrome of HM-HLH may be a “mimic” of the syndrome seen in patients with FHL and that patients may not benefit or may even be harmed by the use of HLH-directed therapy.20 As a result, there is no consensus regarding whether patients fulfilling HLH-2004 diagnostic criteria should be treated with tumor-directed therapy, HLH-directed therapy, or both.7
Another scoring system, the HScore, was developed to determine the diagnosis of HLH in adults.21 Although valuable in some contexts, the HScore is imperfect as it was derived from a cohort of patients who were retrospectively defined as having HLH and because sCD25 results were not included in the score due to a lack of data. Moreover, HMs were significantly underrepresented in the non-HLH group, limiting the use of the HScore in diagnosing HM-HLH.21 Tamamyan et al18 proposed a tool with extended diagnostic criteria for malignancy-associated HLH, adding selected variables to the HLH-2004 that were described in association with adult HLH. This tool was intended to supplement the HLH-2004 criteria to facilitate diagnosis of the syndrome in its early phase and thus reduce early mortality.
We conducted the current study to optimize and simplify HM-HLH diagnosis based on HLH-2004–defining features and used disease outcomes as an external validation measure.
Methods
This study was a multicenter, retrospective study of adult patients with HM in whom sCD25 was measured because of clinically suspected HM-HLH or as part of routine surveillance of patients with a newly diagnosed HM.
Population
Patients were from 3 centers in Israel (Meir Medical Center, Rabin Medical Center, and Sheba Medical Center); 2 centers in the United States (Dana-Farber Cancer Institute and MD Anderson Cancer Center); and a single center in Japan (Toyama University Hospital). The patients were tested for clinically suspected HM-HLH (all centers) or as routine surveillance of patients with a newly diagnosed lymphoma (MD Anderson Cancer Center and University of Toyama) between May 2010 and April 2020 (except for 6 patients from Toyama University Hospital that were tested between April 2003 and March 2008). We categorized patients fulfilling at least 5 of 8 of the HLH-2004 diagnostic criteria as having HM-HLH, whereas patients with <5 criteria were assigned to the HM group. In addition, patients developing HLH features only after receiving chimeric antigen receptor T-cell therapy or patients whose malignancy was not represented in the HLH group were excluded.
Data collection
Institutional review board and ethics committee approval for the study was obtained at all centers. The demographic characteristics, clinical features, imaging, and laboratory results of all patients were extracted from the patients’ medical records. In addition, we collected data pertaining to the HLH-2004 and HScore parameters and parameters from the extended diagnostic criteria of Tamamyan et al.18 Demographic and clinical characteristics were age at diagnosis, sex, presence of fever and maximum fever, and presence of splenomegaly and hepatomegaly. Details pertaining to the histology of the underlying malignancy and whether HLH was suspected were also documented. In addition, the following laboratory parameters were obtained closest to the first blood sampling date for sCD25 or ferritin: hemoglobin, platelets, absolute neutrophil count, sCD25, ferritin, triglycerides, fibrinogen, natural killer (NK) cell activity, lactate dehydrogenase, aspartate aminotransferase, alanine aminotransferase, and albumin.
In addition, nadir or peak values of these parameters during the index admission were recorded. Nadir or peak values were used as appropriate to determine subsequent fulfillment of the HLH-2004 criteria (ie, nadir values for hemoglobin and platelets and peak values for temperature and sCD25). The presence or absence of hemophagocytosis identified in the bone marrow aspirate was recorded. Details of treatment, including corticosteroids, chemotherapy, or other agents that have affected the laboratory results during the month before testing, were obtained. Patients receiving such agents were excluded from the study. The primary analyses were performed by using laboratory values obtained at the first sCD25 or ferritin blood sampling, and analyses using nadir and peak values were used for validation. Considering that most patients did not have NK cell activity measured, we required data on at least 6 of 8 HLH-2004 criteria for each patient classified as HM and 5 of 8 HLH-2004 criteria for each patient classified as HM-HLH for study inclusion.
Data harmonization
Although most of the HLH-2004 laboratory parameters lack interobserver variability, sCD25 levels may vary across early childhood and according to testing methodology. However, the upper limit of the normal range for adults is similar at ∼1000 U/mL in all laboratories involved in the study. Nonetheless, to identify a possible “center effect,” we examined the performance of our diagnostic tool by analyzing the data obtained in different centers.
Statistical analysis
Statistical analyses were performed by using Prism version 8.0.1 (GraphPad Software) and SPSS version 27.0.0.0 (IBM SPSS Statistics, IBM Corporation). Descriptive analysis included medians, interquartile ranges, means, standard deviation, frequencies, and percentages. The Mann-Whitney U test was used to compare continuous variables and Fisher’s exact test to compare categorical parameters. A value of P <.05 was considered statistically significant for univariate comparisons.
We created a decision tree using classification and regression analysis (CART) analysis parameters at initial presentation and with all 24 available parameters (only parameters with >60% completeness) (supplemental Table 1, available on the Blood Web site). The primary outcome variable was the fulfillment of the HLH-2004 criteria at nadir/peak values. The results were validated with 10% cross validation.
The area under the curve (AUC), sensitivity, specificity, and optimal cutoff levels were calculated by using receiver-operating curves (ROC) for HLH-2004 diagnosis and mortality prediction. An AUC >0.8 reflects a test with good discriminatory ability. An AUC of 0.6 to 0.8 implies intermediate discriminatory ability. Thus, an AUC <0.6 reflects the test’s inability to discriminate between patients with HM-HLH vs those with HM alone. Next, we calculated the optimal cutoff point for each parameter chosen as the point with the highest Youden index22 (sensitivity + specificity − 1).
Binary logistic regression was performed by using the markers with the highest probability to identify HLH-2004 criteria and mortality at 500 days (most patients were followed up until that time point). The combined ROC curve was then produced using the predicted probability as the test variable. Finally, we used Kaplan-Meier curves, censoring all patients at 500 days. Hazard ratios (HRs) and the 95% confidence intervals (CIs) for mortality are reported by using the Mantel-Haenszel test.
Results
Patient characteristics
We reviewed 246 patients with HMs; 91% of the patients (225) were included in the final analysis. The reasons for exclusion are specified in supplemental Figure 1. Data for most parameters were >90% complete (supplemental Table 1).
We classified the 112 patients who fulfilled at least 5 of 8 HLH-2004 diagnostic criteria as HM-HLH and 113 as uncomplicated HM. Thirty-five percent of the patients had HLH-relevant laboratory tests assessed routinely upon HM diagnosis, and the remainder were evaluated because of suspicion of HLH (supplemental Table 2). Overall, 177 patients (79%) had a lymphoid malignancy (B-cell lymphoma, 40%; T/NK-cell lymphoma, 26%; Hodgkin lymphoma, 8%; chronic lymphocytic leukemia, 4%), and 48 (21%) had a myeloid malignancy (acute myeloid leukemia, 8%; myelodysplastic syndrome, 8%; myeloproliferative neoplasm, 6%). Patients with or without HLH had similar underlying HMs, as shown in Table 1. Patients with HM-HLH were significantly younger than patients with HM (P = .0002), with a median age of 62.5 (range, 19-86) years vs 66 (range, 22-92) years.
General characteristics of the entire study cohort
| Characteristic | HM (n = 113) | HM-HLH (n = 112) | P | |
|---|---|---|---|---|
| Age at diagnosis, median (25%, 75%), y | 66 (60, 75.5) | 62 (53, 69) | .0002 | |
| Female/male, N (%) | 47 (42)/66 (58) | 48 (43) /64 (57) | .89 | |
| T/NK-cell lymphoma, N (%) | 32 (28) | 26 (23) | .45 | |
| PTCL | 11 (10) | 8 (7) | ||
| Anaplastic large cell lymphoma | 4 (4) | 4 (4) | ||
| CTCL | 3 (3) | 2 (2) | ||
| AITL | 5 (4) | 2 (2) | ||
| GDHSTCL | 2 (2) | 1 (1) | ||
| Nasal/other NK/T-cell lymphoma | 7 (6) | 9 (8) | ||
| B-cell lymphoma, N (%) | 47 (42) | 44 (39) | .89 | |
| DLBCL | 26 (23) | 24 (21) | ||
| IVLBCL | 5 (4) | 7 (6) | ||
| Follicular lymphoma | 6 (5) | 3 (3) | ||
| T-cell/histiocyte-rich large B-cell lymphoma | 1 (1) | 3 (3) | ||
| Other types of B-cell lymphoma | 9 (8) | 7 (6) | ||
| Hodgkin lymphoma, N (%) | 9 (8) | 9 (8) | 1 | |
| AML, N (%) | 7 (6) | 11 (10) | .34 | |
| MDS, N (%) | 8 (7) | 10 (9) | .64 | |
| MPN, N (%) | 6 (5) | 6 (5) | 1 | |
| CLL, N (%) | 4 (3) | 6 (5) | .54 | |
| Eastern | Japan | 62 (55) | 19 (17) | |
| Western | Israel | 23 (20) | 45 (40) | |
| United States | 28 (25) | 48 (43) | ||
P values were calculated with Fisher’s exact test. AITL, angioimmunoblastic T-cell lymphoma; AML, acute myeloid leukemia; CLL, chronic lymphocytic leukemia; CTCL, cutaneous T-cell lymphoma; DLBCL, diffuse large B-cell lymphoma; GDHSTCL, gamma delta hepatosplenic T-cell lymphoma; IVLBCL, intravascular large B-cell lymphoma; MDS, myelodysplastic syndrome; MPN, myeloproliferative neoplasms; PTCL, peripheral T-cell lymphoma.
There is significant overlap in the distribution of all HLH diagnostic criteria between HM and HM-HLH patients
We examined the distribution of diagnostic markers for patients examined as routine investigation at diagnosis of their malignancy vs those tested for suspicion of HLH. We hypothesized that most HLH-2004 parameters would overlap between HM and HM-HLH patients. Indeed, although some parameters were significantly different between groups (Figure 1), there was extensive overlap, and many values fell above or below the diagnostic range in both groups (Figure 1B-C). The only significantly different parameters between groups that were above diagnostic thresholds were the inflammatory markers sCD25 and ferritin, regardless of whether the tests were performed routinely or because of HLH suspicion (Figure 1A; supplemental Table 2). In addition, analysis of nadir/peak levels of HLH diagnostic markers during the index encounter revealed overlap between the patient groups even under these conditions (supplemental Figure 2).
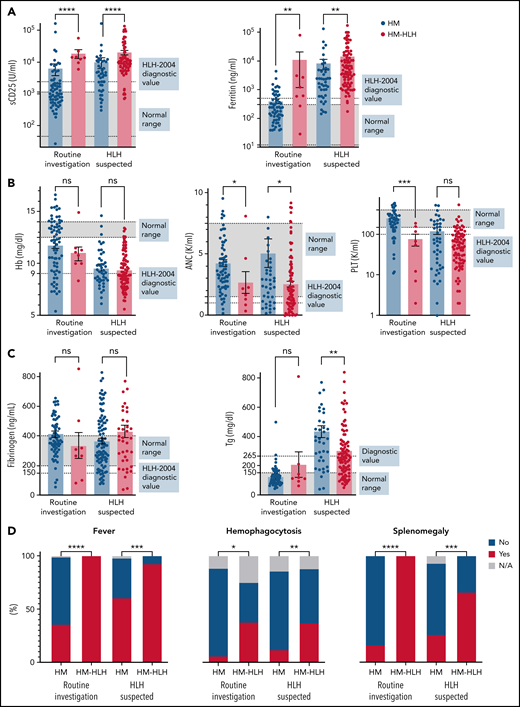
The distribution of HLH-defining features reveals significant overlap between patients with uncomplicated HMs and patients with malignancies complicated by HLH, regardless of clinical suspicion for HLH. Normal range and the diagnostic threshold level from the HLH-2004 study (used for FHL) are shown in patients examined as routine at HM diagnosis (left bars) and patients tested due to HLH suspicion (right bars). These values are the preliminary measurements at the initial presentation of HLH/malignancy. The distribution of maximally pathologic values during the index encounter is shown in supplemental Figure 2. (A) Distribution of the inflammatory markers. The values of sCD25 between HM-HLH with suspected HLH and those evaluated as routine were not significantly different (P = .09), whereas the ferritin values were (P = .016). (B) Distribution of the blood lineages. (C) Distribution of other markers. (D) Categorical parameters. The statistics of the quantitative parameters were analyzed by using the Mann-Whitney U test. The statistics of the categorical parameters were analyzed with Fisher’s exact test. Values shown were available for >90% of the patients. NK activity was available for only 4% of the patients and therefore is not shown. HM = patients with uncomplicated HMs; HM-HLH = patients fulfilling 5 of 8 HLH-2004 diagnostic criteria.*P < .05, **P < .01, ***P < .001 ****P < .0001. ANC, absolute neutrophil count; Hb, hemoglobin; N/A, not available; ns, not significant; PLT, platelets; Tg, triglycerides.
The distribution of HLH-defining features reveals significant overlap between patients with uncomplicated HMs and patients with malignancies complicated by HLH, regardless of clinical suspicion for HLH. Normal range and the diagnostic threshold level from the HLH-2004 study (used for FHL) are shown in patients examined as routine at HM diagnosis (left bars) and patients tested due to HLH suspicion (right bars). These values are the preliminary measurements at the initial presentation of HLH/malignancy. The distribution of maximally pathologic values during the index encounter is shown in supplemental Figure 2. (A) Distribution of the inflammatory markers. The values of sCD25 between HM-HLH with suspected HLH and those evaluated as routine were not significantly different (P = .09), whereas the ferritin values were (P = .016). (B) Distribution of the blood lineages. (C) Distribution of other markers. (D) Categorical parameters. The statistics of the quantitative parameters were analyzed by using the Mann-Whitney U test. The statistics of the categorical parameters were analyzed with Fisher’s exact test. Values shown were available for >90% of the patients. NK activity was available for only 4% of the patients and therefore is not shown. HM = patients with uncomplicated HMs; HM-HLH = patients fulfilling 5 of 8 HLH-2004 diagnostic criteria.*P < .05, **P < .01, ***P < .001 ****P < .0001. ANC, absolute neutrophil count; Hb, hemoglobin; N/A, not available; ns, not significant; PLT, platelets; Tg, triglycerides.
Inflammatory features are essential to HLH diagnosis in patients with HMs
To build a diagnostic rule in an unbiased fashion, we used CART analysis with cross-validation using all parameters at initial presentation to identify the most important markers for HLH-2004 diagnosis (Figure 2A). The CART analysis chose initial sCD25 >3601 U/mL and initial ferritin >2636 ng/mL levels to identify most patients with HM-HLH (68 of 112 patients). We validated our findings with the same analysis incorporating HLH-2004 parameters at presentation, at nadir/peak, and other parameters typically affected in patients with HLH (supplemental Table 1). The more inclusive CART analysis (supplemental Figure 3) again determined that initial sCD25 and peak ferritin could identify most patients (83 of 112 patients). ROC curve analysis of initial (Figure 2B) and peak/nadir (supplemental Figure 4) laboratory values showed that sCD25 and ferritin most effectively discriminated between patients with HM fulfilling at least 5 of 8 HLH-2004 criteria and those who did not, with an AUC of 0.83 for each initial parameter. Moreover, the ROC of peak ferritin had the most improved AUC (0.87). Although current HLH-2004 diagnostic thresholds for both sCD25 (>2400 U/mL) and ferritin (>500 ng/mL) were sensitive for detecting HLH in patients with HM (94% and 96%, respectively), they lacked specificity (53% and 54%). ROC analysis indicated that sCD25 had an optimal cutoff level of >3601 U/mL (sensitivity, 94%; specificity, 66%), whereas the optimal cutoff level for ferritin was >920 ng/mL (sensitivity, 88%; specificity, 65%). Thus, ROC analysis reveals that among individual features of HLH, only sCD25 and ferritin have sufficient discriminatory power for diagnosis. Combining both of these markers (Figure 2C) resulted in an improved diagnostic prediction (sensitivity, 94%; specificity, 72%) that increased further with optimized cutoffs (sensitivity, 88%; specificity, 76%).
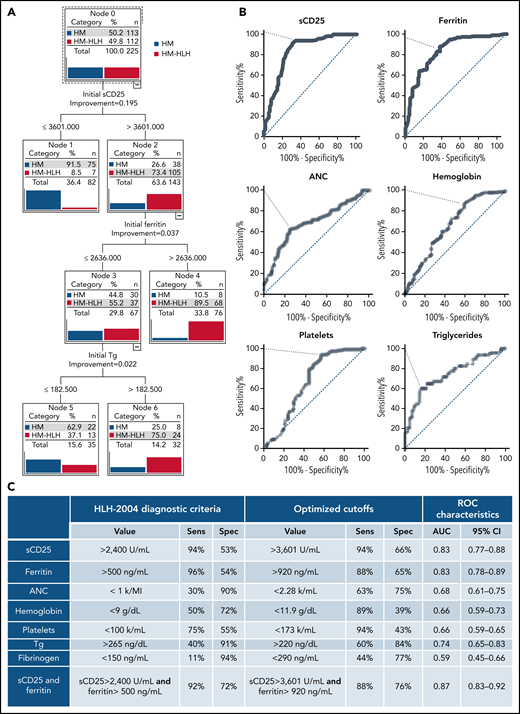
Inflammatory markers best discriminate between patients with uncomplicated HMs and patients with HLH in the context of HMs. (A) CART, including initial assessment of all markers, is shown. CART analysis determines the relative importance of different variables for identifying homogeneous groups within a data set. CART’s growth limits were defined with the Gini method, limiting 4 cases in the child node and 5 cases in the parent node. The minimum change in improvement was defined as 0.0001 and pruning with the minimum difference in risk of 1 standard error. (B) ROC analysis for individual HLH-defining markers at presentation (initial measurement) is shown. The distribution of maximally pathologic values during the index encounter is shown in supplemental Figure 4. The dotted line indicates the pertinent point on the curve identified as the best balance between sensitivity and specificity (with the highest Youden index). (C) The table summarizes the performance of each marker and thresholds defined by the HLH-2004 and ROC analyses. AUC, 95% CIs, P values, sensitivity (Sens), and specificity (Spec) for the HLH-2004 thresholds and the optimized ones at initial presentation are presented. ANC, absolute neutrophil count; Tg, triglycerides.
Inflammatory markers best discriminate between patients with uncomplicated HMs and patients with HLH in the context of HMs. (A) CART, including initial assessment of all markers, is shown. CART analysis determines the relative importance of different variables for identifying homogeneous groups within a data set. CART’s growth limits were defined with the Gini method, limiting 4 cases in the child node and 5 cases in the parent node. The minimum change in improvement was defined as 0.0001 and pruning with the minimum difference in risk of 1 standard error. (B) ROC analysis for individual HLH-defining markers at presentation (initial measurement) is shown. The distribution of maximally pathologic values during the index encounter is shown in supplemental Figure 4. The dotted line indicates the pertinent point on the curve identified as the best balance between sensitivity and specificity (with the highest Youden index). (C) The table summarizes the performance of each marker and thresholds defined by the HLH-2004 and ROC analyses. AUC, 95% CIs, P values, sensitivity (Sens), and specificity (Spec) for the HLH-2004 thresholds and the optimized ones at initial presentation are presented. ANC, absolute neutrophil count; Tg, triglycerides.
A novel inflammatory index comprising optimized sCD25 and ferritin levels has improved diagnostic and prognostic value in HM-HLH
We next hypothesized that the combination of sCD25 and ferritin would also predict mortality. Therefore, we assessed the predictive value of all HM-HLH features using ROC. Indeed, sCD25 and ferritin had the highest AUC for predicting mortality (AUC of 0.76 and 0.79, respectively) (supplemental Figure 5).
Moreover, their combination was synergistic for both HLH diagnosis and mortality prediction as reflected by the higher AUC of the combined ROC compared with either one individually (AUC of 0.87 for HLH-2004 prediction, and AUC of 0.83 for mortality prediction) (Figure 3A). We established this combination as the optimized HLH inflammatory (OHI) index. Due to the proximity of the optimal diagnostic and prognostic point of sCD25 and ferritin (Figure 3B), we determined the cutoffs as the average of these 2 ROCs (sCD25 >3900 U/mL and ferritin >1000 ng/mL). Surprisingly, the OHI index improved diagnostic prediction of HLH-2004–defining features (sensitivity, 84%; specificity, 81%) (Figure 3B compared with optimal diagnostic cutoffs in the table of Figure 2C). Moreover, the OHI index also improved prognostic prediction ability at presentation (107 patients; HR, 4.3; CI, 3.0-6.2) (Figure 3C) compared with the HLH-2004 (79 patients; HR, 2.8; CI, 1.9-4.3) or the “optimized” HLH-2004 (O-HLH2004, operationally defined as HLH-2004 diagnostic criteria but with sCD25 >3900 U/mL and ferritin >1000 ng/mL; 74 patients; HR, 2.5; CI, 1.7-3.7).
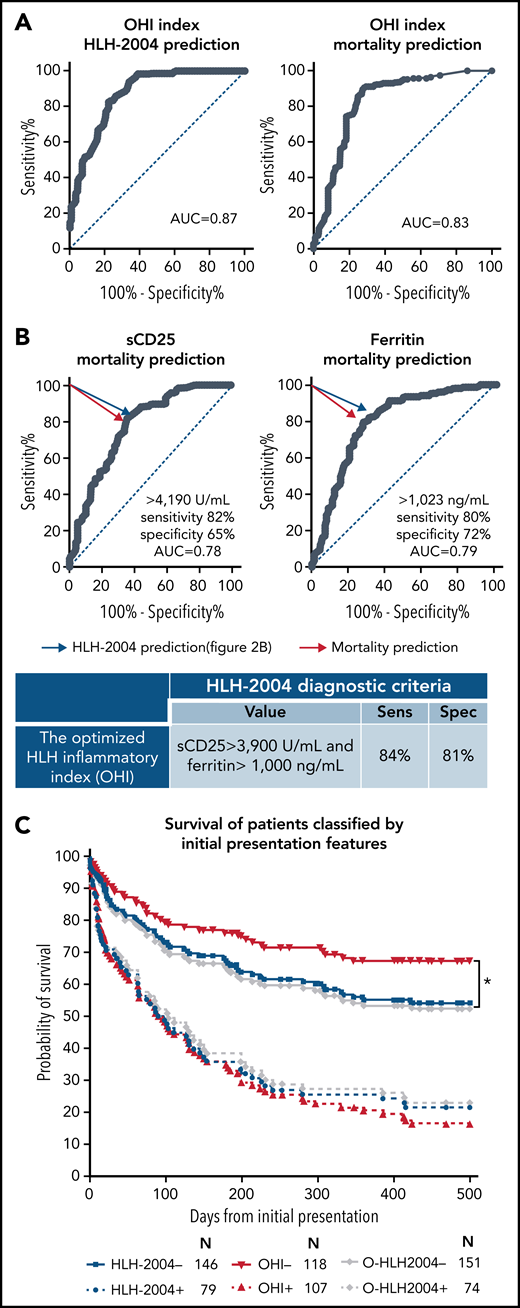
An optimized combination of sCD25 and ferritin with the OHI index improves mortality prediction in patients with HMs. (A) Binary linear regression for the OHI index (combination of sCD25 and ferritin) was performed to calculate the predicted probabilities of diagnosing HLH (per HLH-2004) and prediction of mortality at 500 days. ROC for the predicted probabilities to predict HLH-2004 is presented on the left, and ROC for the predicted mortality probabilities at day 500 is presented on the right. (B) ROC analysis for sCD25 and ferritin identifying mortality by day 500 is shown. The blue arrow indicates the optimal point identified in the prior ROC analysis for identifying patients meeting the HLH-2004 criteria (Figure 2B). The red arrow indicates the pertinent point on the curve identified as the best balance between sensitivity and specificity (with the highest Youden index) for identifying mortality. These values were determined as the OHI index values. The table shows the sensitivity (Sens) and specificity (Spec) of the OHI for identifying ≥5 HLH-2004 parameters. The sensitivity and specificity were calculated by using a contingency table. (C) Kaplan-Meier curves of patients classified at the initial presentation (utilizing initial measurement) by HLH-2004 (blue), OHI (sCD25 ≥3900 U/mL and ferritin ≥1000 ng/mL, red), and “optimized” HLH-2004, O-HLH2004 (the same framework as HLH-2004 but with sCD25 ≥3900 U/mL and ferritin ≥1000 ng/mL, gray). The number at risk is presented for each group. Statistics were calculated with the log-rank (Mantel-Cox) test. *P < .05. All diagnostic indices were highly distinct between patients who were positive and negative (P < .0001).
An optimized combination of sCD25 and ferritin with the OHI index improves mortality prediction in patients with HMs. (A) Binary linear regression for the OHI index (combination of sCD25 and ferritin) was performed to calculate the predicted probabilities of diagnosing HLH (per HLH-2004) and prediction of mortality at 500 days. ROC for the predicted probabilities to predict HLH-2004 is presented on the left, and ROC for the predicted mortality probabilities at day 500 is presented on the right. (B) ROC analysis for sCD25 and ferritin identifying mortality by day 500 is shown. The blue arrow indicates the optimal point identified in the prior ROC analysis for identifying patients meeting the HLH-2004 criteria (Figure 2B). The red arrow indicates the pertinent point on the curve identified as the best balance between sensitivity and specificity (with the highest Youden index) for identifying mortality. These values were determined as the OHI index values. The table shows the sensitivity (Sens) and specificity (Spec) of the OHI for identifying ≥5 HLH-2004 parameters. The sensitivity and specificity were calculated by using a contingency table. (C) Kaplan-Meier curves of patients classified at the initial presentation (utilizing initial measurement) by HLH-2004 (blue), OHI (sCD25 ≥3900 U/mL and ferritin ≥1000 ng/mL, red), and “optimized” HLH-2004, O-HLH2004 (the same framework as HLH-2004 but with sCD25 ≥3900 U/mL and ferritin ≥1000 ng/mL, gray). The number at risk is presented for each group. Statistics were calculated with the log-rank (Mantel-Cox) test. *P < .05. All diagnostic indices were highly distinct between patients who were positive and negative (P < .0001).
We examined these cutoffs within our cohort in a subgroup analysis of the underlying malignancies (Figure 4). ROC analyses were performed for HLH and mortality prediction in all patients with lymphoma (T/NK-cell lymphoma and B-cell lymphoma) (Figure 4A; supplemental Figure 6A-B) and myeloid malignancies (Figure 4B). In all cases, the OHI threshold was identical or very close to the malignancy subgroup threshold. Moreover, the OHI index improved mortality prediction in specific malignancies (Figure 4D; supplemental Figure 6C).
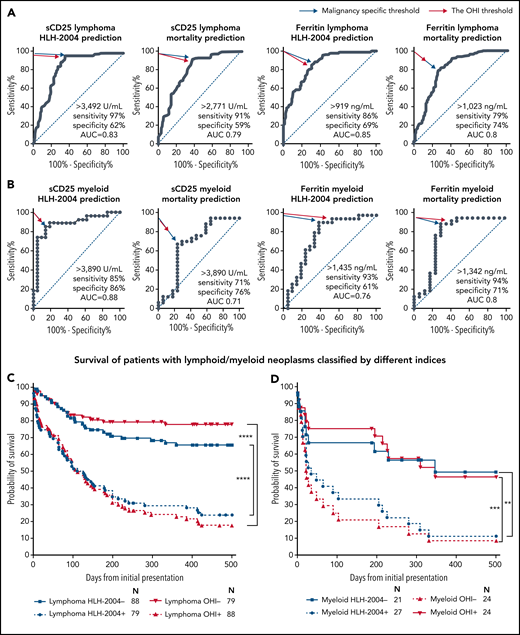
The OHI index is highly predictive of mortality in patients with lymphoid or myeloid malignancies. ROC analyses for sCD25 and ferritin for predicting HLH-2004 diagnosis (≥5 diagnostic criteria) and mortality prediction in patients with lymphoma (A) and patients with myeloid malignancies (B). The blue arrow indicates the pertinent point on the curve identified as the best balance between sensitivity and specificity (with the highest Youden index). The red arrow indicates the point closest to the OHI values (sCD25 >3900 U/mL and ferritin >1000 ng/mL). (C) Survival of patients with lymphoma (B-cell lymphoma, T-cell lymphoma, and Hodgkin lymphoma; n = 167), classified per the indicated HLH indices. (D) Survival of patients with myeloid malignancies (acute myeloid leukemia, myelodysplastic syndrome, and myeloproliferative neoplasms; n = 48) as in panel C. Classification for this Kaplan-Meier analysis is based on the peak/nadir laboratory values obtained during the initial presentation of HLH/malignancy. The number at risk is presented for each group. Statistics were calculated with the log-rank (Mantel-Cox) test. **P < .001, ***P = .001, ****P < .0001.
The OHI index is highly predictive of mortality in patients with lymphoid or myeloid malignancies. ROC analyses for sCD25 and ferritin for predicting HLH-2004 diagnosis (≥5 diagnostic criteria) and mortality prediction in patients with lymphoma (A) and patients with myeloid malignancies (B). The blue arrow indicates the pertinent point on the curve identified as the best balance between sensitivity and specificity (with the highest Youden index). The red arrow indicates the point closest to the OHI values (sCD25 >3900 U/mL and ferritin >1000 ng/mL). (C) Survival of patients with lymphoma (B-cell lymphoma, T-cell lymphoma, and Hodgkin lymphoma; n = 167), classified per the indicated HLH indices. (D) Survival of patients with myeloid malignancies (acute myeloid leukemia, myelodysplastic syndrome, and myeloproliferative neoplasms; n = 48) as in panel C. Classification for this Kaplan-Meier analysis is based on the peak/nadir laboratory values obtained during the initial presentation of HLH/malignancy. The number at risk is presented for each group. Statistics were calculated with the log-rank (Mantel-Cox) test. **P < .001, ***P = .001, ****P < .0001.
OHI index identifies patients with poor outcomes missed by current indices
Among patients who are discordantly classified by the OHI index and other indices, the OHI index performed better in recognizing high-risk patients. Hence, patients who were HLH-2004–/OHI+ (Figure 5A) had a significantly higher mortality risk (n = 22; HR, 13.8; CI, 5.6-34.0) than HLH-2004–/OHI– patients. Conversely, HLH-2004+/OHI– patients had a significantly better prognosis (n = 17; HR, 0.5; CI, 0.3-0.9) than HLH-2004+/OHI+ patients. Using modified HLH-2004 criteria, with optimized sCD25 and ferritin thresholds, resulted in many high-risk patients not being diagnosed (n = 25; HR, 10.4; CI, 4.6-23.8) (Figure 5B). The HScore missed an even greater number of high-risk patients diagnosed by using the OHI index (n = 39; HR, 8.1; CI, 4.2-15.8) (Figure 5C). The large number of patients missed by the HScore can be explained by the absence of sCD25 in its defining features. When comparing the OHI index vs the HLH-2004 without sCD25 (supplemental Figure 7), a much larger high-risk population group was missed (n = 71; HR, 5.8; CI, 3.6-9.2). These data emphasize the importance of assessing sCD25. Furthermore, although OHI+ predicted all HLH clinical features, even in patients who were HLH-2004– (supplemental Figure 8), only sCD25 and ferritin were essential for mortality prediction within the HLH-2004 framework (supplemental Figure 9).
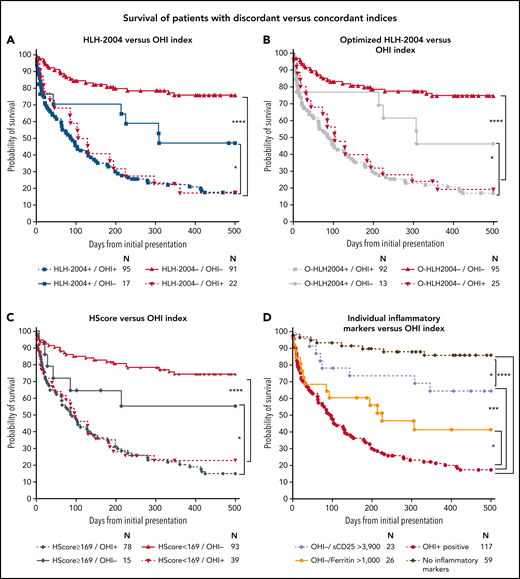
The OHI index recognizes patients at high mortality risk not identified by current diagnostic indices. The patients were classified based on the HLH-2004 (≥5 diagnostic criteria), optimized HLH-2004 (O-HLH2004, the HLH-2004 framework with sCD25 >3900 U/mL and ferritin >1000 ng/mL), the OHI index (sCD25 >3900 U/mL and ferritin >1000 ng/mL), or HScore ≥ 169 based on the peak/nadir of relevant laboratory values obtained during the index hospitalization. (A) Kaplan-Meier curve for patients classified concordantly or discordantly by using the HLH-2004 criteria and the OHI index. (B) Kaplan-Meier curve for patients classified concordantly or discordantly by using the optimized HLH-2004 criteria (O-HLH2004) and the OHI index. (C) Kaplan-Meier curve for patients classified concordantly or discordantly by using the HScore and the OHI index. (D) Kaplan-Meier curves of patients classified by using the OHI index or parameters of the OHI index. The number at risk is presented for each group. Statistics were calculated with the log-rank (Mantel-Cox) test. *P < .05, ***P < .001, ****P < .0001.
The OHI index recognizes patients at high mortality risk not identified by current diagnostic indices. The patients were classified based on the HLH-2004 (≥5 diagnostic criteria), optimized HLH-2004 (O-HLH2004, the HLH-2004 framework with sCD25 >3900 U/mL and ferritin >1000 ng/mL), the OHI index (sCD25 >3900 U/mL and ferritin >1000 ng/mL), or HScore ≥ 169 based on the peak/nadir of relevant laboratory values obtained during the index hospitalization. (A) Kaplan-Meier curve for patients classified concordantly or discordantly by using the HLH-2004 criteria and the OHI index. (B) Kaplan-Meier curve for patients classified concordantly or discordantly by using the optimized HLH-2004 criteria (O-HLH2004) and the OHI index. (C) Kaplan-Meier curve for patients classified concordantly or discordantly by using the HScore and the OHI index. (D) Kaplan-Meier curves of patients classified by using the OHI index or parameters of the OHI index. The number at risk is presented for each group. Statistics were calculated with the log-rank (Mantel-Cox) test. *P < .05, ***P < .001, ****P < .0001.
sCD25 and ferritin individually and combined within the OHI index are highly predictive of mortality in patients with diverse HMs
We tested the individual and combined contribution of sCD25 and ferritin to mortality prediction in patients in our entire cohort (Figure 5D). Patients with an elevation in either sCD25 or ferritin had a higher mortality risk than those with no elevation of either in the entire cohort and myeloid malignancies (supplemental Figure 10). However, the OHI index was synergistic in its power to identify a large group of high-risk patients (n = 117; HR, 9.3; CI, 3.5-24.9). Strikingly, 87% of the 59 patients in the cohort who did not have elevated inflammatory markers survived to 500 days, whereas only 17% of OHI+ patients survived (Figure 5D). Notably, the distribution of diagnoses in these patients was almost identical to that in patients who were OHI+/HLH-2004+ (supplemental Figure 11). These data imply that the OHI index does not overrepresent a specific HM diagnosis but rather identifies a harmful inflammatory state that is the essence of the HLH syndrome. We further examined the performance of the OHI index by analyzing patients who were tested in centers performing these tests as routine surveillance at lymphoma diagnosis (Toyama University Hospital in Japan and MD Anderson Cancer Center in the United States) vs centers evaluating for HLH only based on clinical suspicion (Israeli centers and Dana-Farber Cancer Institute in the United States). Although there was no difference in outcome using either strategy among OHI+ patients, OHI– patients had improved outcomes in centers with a routine surveillance policy, suggesting that the OHI index remains useful in patients with a low pretest probability (Figure 6A). The same analysis with treatment-naive vs treatment-conditioned patients (patients who received minimal treatment such as a few days of steroids) yielded similar trends (Figure 6B). Both these observations show the usefulness of early assessment of the OHI index. Finally, we found that decisions to adjust therapy due to HLH correlated well with OHI status (even when HLH-2004 negative), suggesting that the treating physicians intuitively recognized the aberrant inflammation reflected by the OHI index (supplemental Figure 12).
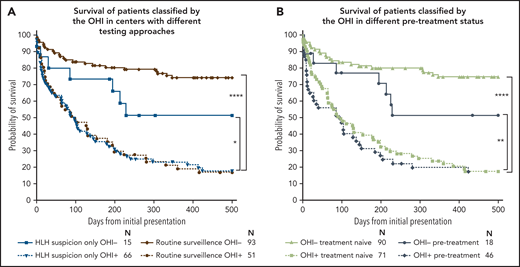
The OHI index performs better when assessed during routine surveillance and in treatment-naive patients. Kaplan-Meier curves of subgroup analyses of patients classified by using the OHI index. (A) Centers evaluating sCD25 and ferritin upon HLH suspicion only vs centers that have routine surveillance of patients with newly diagnosed lymphoma (Toyama Hospital in Japan and MD Anderson Cancer Center in the United States). (B) Treatment-naive patients vs pretreated patients. Although patients who received treatments that will undoubtedly influence their laboratory results (eg, cytoreductive therapy/high-dose steroids) were excluded from the study, patients who received minimal pretreatment (eg, lower dose steroids for only a few days) before assessment of relevant studies were included and defined in the pre-treatment group. The number at risk is presented for each group. Statistics were calculated with the log-rank (Mantel-Cox) test. *P < .05, **P < .01, ****P < .0001.
The OHI index performs better when assessed during routine surveillance and in treatment-naive patients. Kaplan-Meier curves of subgroup analyses of patients classified by using the OHI index. (A) Centers evaluating sCD25 and ferritin upon HLH suspicion only vs centers that have routine surveillance of patients with newly diagnosed lymphoma (Toyama Hospital in Japan and MD Anderson Cancer Center in the United States). (B) Treatment-naive patients vs pretreated patients. Although patients who received treatments that will undoubtedly influence their laboratory results (eg, cytoreductive therapy/high-dose steroids) were excluded from the study, patients who received minimal pretreatment (eg, lower dose steroids for only a few days) before assessment of relevant studies were included and defined in the pre-treatment group. The number at risk is presented for each group. Statistics were calculated with the log-rank (Mantel-Cox) test. *P < .05, **P < .01, ****P < .0001.
Discussion
In this study, we report results from the largest cohort to date of patients with HMs complicated by HLH, in which we evaluate the clinical utility of the commonly used HLH-2004 diagnostic criteria for adult patients with HMs. After identifying sCD25 and ferritin as the most potent diagnostic markers using CART and ROC analyses, we established optimized cutoff values for diagnosis and mortality prediction using ROC analyses. We showed that a combination of sCD25 >3900 U/mL and ferritin >1000 ng/mL provides a simplified and accurate diagnostic and prognostic tool that we term the OHI index. Moreover, the OHI index was highly predictive of mortality in a cohort of diverse malignancies as well as specific subgroups.
The relevance of current diagnostic indices in HM-HLH has been questioned, and there is a recognized need to develop specific criteria for HM-HLH.23 HM-HLH is distinct from other types of the HLH syndrome in its higher mortality rates.15 We showed that HLH-2004 recognizes a very high-risk HM-HLH population, although it misses some patients identified by the OHI index. Moreover, although the HScore clearly correlated with mortality, it failed to identify a large portion of high-risk patients, probably because sCD25 is not included in this score. Tamamyan et al18 proposed an extended set of 18 criteria for HM-HLH to recognize patients soon after presentation and to prevent early mortality. Our data show that this score may be overly sensitive for prognostic use because it recognized a large population not at high risk of dying (n = 48) (supplemental Figure 13A). Previous reports have suggested that the ratio of sCD25/ferritin is helpful for the diagnosis of lymphoma-associated hemophagocytic syndrome in adult patients with suspected HLH.24,25 Our data show that this ratio (>2) is not predictive of mortality in patients with a known malignancy (supplemental Figure 13B).
After showing the diagnostic and prognostic utility of the HLH-2004, we examined the effect of improving its performance by using optimized thresholds for sCD25 and ferritin (Figures 3C and 5B). We found that this approach was inferior to using the more streamlined and simplified OHI index. Moreover, although the OHI index correlated with all other HLH features (supplemental Figure 8), only sCD25 and ferritin contributed individually to the prognostic estimation of the HLH-2004 criteria (supplemental Figure 9). HLH occurs in distinct contexts, such as juvenile idiopathic arthritis, which may alter its clinical profile but it is still best conceptualized as a single syndrome. However, as with juvenile idiopathic arthritis–associated macrophage activation syndrome, in which a consensus effort has derived unique (non–HLH-2004) diagnostic criteria,26 we found that distinctive, context-specific criteria are optimal for diagnosis. Our data clearly show that HMs have overlapping features with HLH, as previously suggested.20 Thus, conventional definitions of HLH are less indicative of severe disease than in other HLH subtypes/contexts. The utility of the OHI index suggests that it more accurately (and simply) identifies patients with harmful inflammation and that HLH diagnosis/definition should be more sharply focused on inflammatory features. These are more distinct than those features of tissue injury (eg, cytopenias) or hemophagocytosis included in the HLH-2004 and HScore criteria.
sCD25 and ferritin both have value as diagnostic and prognostic predictors in HM-HLH. However, sCD25 is performed only at specialized centers. We show that sCD25 is essential for diagnosis and prognostic estimation (Figure 5; supplemental Figures 7 and 9), suggesting that it should be used more widely. Ferritin measurement is widely available, and our data indicate that serial ferritin measurements are likely to improve its diagnostic yield (supplemental Figures 3 and 4). In our study, both of these inflammatory markers had the best discriminatory power of all HLH-2004–related diagnostic parameters. Both parameters were very sensitive but not specific at their original cutoff levels, as previously reported.27,28 sCD25 is commonly elevated in patients with lymphoma,29 and elevated ferritin levels may be related to the underlying HM, blood transfusions, or other medical conditions.30 Similar to others, we showed that optimizing the cutoff levels for each parameter improved their specificity.28,31 Our novel discovery is that their combination has synergistic diagnostic and prognostic power (Figure 3A), whereas other features believed to be relevant to HLH are not informative in the context of HMs. The synergy reflected in the OHI index is consistent with the pathogenesis of HLH, which involves activation of both adaptive and innate immune cells, with sCD25 being a marker of activated T cells32 and ferritin being produced by activated macrophages in many contexts.33 Although immunologic or nonimmunologic processes may drive elevations in either parameter, we conclude that concurrent elevation most likely reflects an immunologic etiology.
Our study has immediate diagnostic implications. We found that the OHI index identifies high-risk patients irrespective of HLH diagnosis (Figure 5). This finding suggests that the OHI index more accurately identifies a pathologic state that is now recognized as “HLH,” and we should move beyond conventional definitions of HLH in the context of HMs. Thus, we propose that simply measuring sCD25 and ferritin routinely at diagnosis of diverse HMs will improve prognostic predictions. This idea requires further study in a prospective manner. Further studies grounded in our novel OHI index may enhance clinical awareness and diagnosis, provide insights into the syndrome’s pathophysiology, and ultimately improve therapies.
The current study is limited by its retrospective nature, and the risks/benefits of intensifying or altering therapy based on the OHI index are still unknown and warrant further study. Nevertheless, it is the largest cohort of patients with HM- and HLH-defining features reported to date and includes patients from multiple centers in international collaboration. To avoid potential bias related to the underlying diagnoses, we gathered data from patients with various HMs. We also validated that patients from the different centers reported similar results when analyzed separately. Although some selection bias is unavoidable when studying patients with HM evaluated because of clinical suspicion of HLH, a substantial fraction of the patients had these data (including sCD25) collected routinely at diagnosis. In addition, this scoring system was not validated in a separate cohort, and other possible triggers were not assessed in most patients (eg, Epstein-Barr virus status). To overcome these limitations, we have initiated a prospective study of patients with HMs to validate the diagnostic and prognostic power of the OHI index.
We hypothesize that this unique inflammatory process affects a much more significant portion of patients with HMs than is currently recognized. However, it is not yet clear whether the high mortality of HM-HLH is due to a harmful immunologic process or whether immune activation is merely symptomatic of other processes affecting survival. We propose that HM-HLH may be best viewed as a novel paraneoplastic immune syndrome involving T-cell and innate immune cell derangements. A recent report suggests that clonal hematopoiesis may be a predisposing factor for aberrant immune responses in adults with HLH.34 The OHI index also offers novel areas for research into the pathophysiology and treatment of HM-HLH. These areas include investigating cytokines in OHI+ patients and a carefully planned prospective study looking at whether HLH-specific/targeted therapies improve their outcomes.
In summary, we show that the OHI index can simplify the diagnosis of HLH in most patients with HM and is the most potent predictor of mortality in a diverse population of patients with HMs. Furthermore, a positive OHI index in patients with HMs and clinically suspected HLH may allow early confirmation of the diagnosis and timely treatment initiation that might alter this disorder’s poor natural history.
Acknowledgments
This work was supported by a National Institutes of Health/National Cancer Institute grant (R21CA256390 [M.B.J.]). Additional relevant grant support includes the American Society of Hematology (P.G.M.) and the Edward E. Ford Foundation (P.G.M.). The authors also thank Amnon Liberman for fellowship support (A.-Z.L.). This work is a part of a PhD at Tel Aviv University (A.-Z.L.).
Authorship
Contribution: A.-Z.L., M.B.J., and M.E initiated the project, designed the research, and wrote the paper with input from other authors; A.-Z.L. and M.B.J. analyzed the data; A.-Z.L. J.M., L.H., S.I., A.S.A., S.F.M., P.G.M., E.G., and S.W. collected the data; O.P., S.I., N.D., P.G.M., S.N., and N.B. edited the paper and provided essential inputs; A.L. helped in designing the statistical plan and edited the paper; and J.Y., A.N., B.L.E., and P.R. edited the paper and provided the data.
Conflict-of-interest disclosure: A.-Z.L. and M.B.J. have received consulting fees from Sobi. P.G.M. has received consulting fees from Foundation Medicine Inc. B.L.E. has received research funding from Celgene, Deerfield, Novartis, and Calico; has received consulting fees from GRAIL; and is a member of the scientific advisory board and shareholder for Neomorph Therapeutics, Skyhawk Therapeutics, and Exo Therapeutics, none of which are directly related to the content of this paper. The remaining authors declare no competing financial interests.
Correspondence: Michael B. Jordan, Cincinnati Children’s Hospital Medical Center/University of Cincinnati, 3333 Burnet Ave, ML7038, Cincinnati, OH 45229; e-mail: michael.jordan@cchmc.org; and Adi Zoref-Lorenz, Cincinnati Children’s Hospital Medical Center/University of Cincinnati, 3333 Burnet Ave, ML7038, Cincinnati, OH 45229; e-mail: adi.zoref.lorenz@cchmc.org.
Requests for original data may be submitted by contacting adilorenz@gmail.com.
The online version of this article contains a data supplement.
There is a Blood Commentary on this article in this issue.
The publication costs of this article were defrayed in part by page charge payment. Therefore, and solely to indicate this fact, this article is hereby marked “advertisement” in accordance with 18 USC section 1734.

This feature is available to Subscribers Only
Sign In or Create an Account Close Modal