

Key Points
AML harboring mutant RUNX1 exhibit impaired ribosomal biogenesis and increased sensitivity to homoharringtonine, venetoclax, or BET inhibitor.
HHT treatment represses c-Myc, MCL1, and Bcl-xL, exerting superior preclinical efficacy with venetoclax or BET inhibitor against mtRUNX1 AML.

Abstract
The majority of RUNX1 mutations in acute myeloid leukemia (AML) are missense or deletion-truncation and behave as loss-of-function mutations. Following standard therapy, AML patients expressing mtRUNX1 exhibit inferior clinical outcome than those without mutant RUNX1. Studies presented here demonstrate that as compared with AML cells lacking mtRUNX1, their isogenic counterparts harboring mtRUNX1 display impaired ribosomal biogenesis and differentiation, as well as exhibit reduced levels of wild-type RUNX1, PU.1, and c-Myc. Compared with AML cells with only wild-type RUNX1, AML cells expressing mtRUNX1 were also more sensitive to the protein translation inhibitor homoharringtonine (omacetaxine) and BCL2 inhibitor venetoclax. Homoharringtonine treatment repressed enhancers and their BRD4 occupancy and was associated with reduced levels of c-Myc, c-Myb, MCL1, and Bcl-xL. Consistent with this, cotreatment with omacetaxine and venetoclax or BET inhibitor induced synergistic in vitro lethality in AML expressing mtRUNX1. Compared with each agent alone, cotreatment with omacetaxine and venetoclax or BET inhibitor also displayed improved in vivo anti-AML efficacy, associated with improved survival of immune-depleted mice engrafted with AML cells harboring mtRUNX1. These findings highlight superior efficacy of omacetaxine-based combination therapies for AML harboring mtRUNX1.
Introduction
RUNX1 is a master-regulator transcription factor involved in normal and malignant hematopoiesis.1-3 Besides chromosomal translocations involving RUNX1 in acute myeloid leukemia (AML), somatic, heterozygous RUNX1 mutations occur in up to 10% of myelodysplastic syndrome (MDS) and secondary (s) or de novo AML.1,2,4 The majority of RUNX1 mutations in AML are missense or deletion-truncation in the Runt homology domain or in transactivation domain, behaving mostly as loss-of-function mutations.1,2,4 Notably, mutant RUNX1 (mtRUNX1) may promote leukemia transformation in MDS and myeloproliferative neoplasms.5,6 AML patients expressing mtRUNX1 have inferior clinical outcome, exhibiting poorer relapse-free, median, and overall survival than those without mtRUNX1.7-10 Lack of a specific targeted therapy and resistance to standard chemotherapy likely accounts for the poorer outcome observed in AML expressing somatic or germline mtRUNX1.2,8,11 Presence of RUNX1 mutations is associated with expansion of hematopoietic progenitor cells (HPCs) and myeloid progenitors, which exhibit impaired differentiation and resistance to genotoxic stress, attenuated unfolded protein response, and decreased ribosome biogenesis.1,2,4,12,13 This suggests that in HPCs the presence of mtRUNX1 increases susceptibility to ribosomal stress and inhibition of protein translation.
Previous studies demonstrated that treatment with short hairpin RNA to RUNX1 induced significantly more in vitro lethality in AML cells expressing mtRUNX1 vs wild-type RUNX1 (wtRUNX1).7 An RNA-sequencing (RNA-Seq) signature due to RUNX1 knockdown in AML cells expressing mtRUNX1 was used to query the LINCS1000-CMap datasets of >1 000 000 signatures to discover Food and Drug Administration Investigational New Drug–approved drugs or agents (ie, expression mimickers [EMs]) that induced perturbations in messenger RNA (mRNA) expressions and cell lethality similar to treatment with short hairpin RNA to RUNX1.14 In a rank-ordered list, homoharringtonine (HHT), or its semisynthetic analog, omacetaxine mepesuccinate (OM), was among the top EMs.7 HHT or OM binds to the A-site cleft in the peptidyl transferase center of the large ribosomal subunit, which blocks access to the charged transfer RNA (tRNA) and inhibits protein synthesis.15-17 This depletes short-lived proteins, including MCL1, cyclin D1, β-catenin, and c-Myc, that regulate AML cell growth and survival.17-19 HHT treatment has been shown to repress HOXA9 and MEIS1 in leukemia-initiating stem/progenitor cells.20 HHT was shown to bind SP1 and inhibit its DNA binding, resulting in repression of TET1 and 5hmC, which caused reduced expression of FLT3, HOXA9, MEIS1 and MYC targets.20,21 Through binding and retaining NKRF and its binding partner RELA in the cytosol, HHT treatment was also shown to downregulate nuclear localization of RELA and was associated with reduced MYC expression.22 However, an unbiased interrogation of the effect of HHT or OM treatment on active enhancers and associated gene expressions had not been conducted.
Since RUNX1 deficiency impairs ribosome biogenesis (RiBi),13,23 we hypothesized that RUNX1-deficient AML cells would be particularly sensitive to agents discovered through LINCS1000-CMap analysis, such as HHT or OM, that perturb RiBi and activate the impaired ribosomal biogenesis checkpoint.16,18,19,23 Therefore, in present studies, we tested the efficacy of HHT and its mechanism against AML cell lines (mtRUNX1: OCI-AML5 and wtRUNX1: OCI-AML2) and patient-derived AML cells expressing mtRUNX1. Furthermore, we also tested whether HHT or OM treatment would induce more apoptosis in AML cells in which mtRUNX1 was knocked in via a clustered regularly interspaced short palindromic repeats (CRISPR)–CRISPR-associated protein 9 (Cas9) approach, compared with AML cells possessing an isogenic background but with 2 copies of wtRUNX1. Because HHT treatment has been shown to attenuate MCL1 and induce NOXA,17,18,24 we also determined whether cotreatment with HHT and the BCL2 inhibitor venetoclax would exert synergistic lethality and improve in vivo efficacy against AML cells.25 A previous report had highlighted that treatment with BET inhibitor OTX015 represses RUNX1, c-Myc, and c-Myb and induces apoptosis of mtRUNX1-expressing AML cells.7 Studies presented here elucidate the mechanistic basis of lethality induced by HHT (or OM), OTX015, and venetoclax in AML cells harboring mtRUNX1. They also establish that cotreatment with OM and venetoclax or OTX015 induce superior in vitro and in vivo preclinical efficacy and may be promising therapy against AML harboring mtRUNX1.
Methods
Cell lines and cell culture
OCI-AML5 [DSMZ Cat# ACC-247, RRID:CVCL_1620], OCI-AML2 [DSMZ Cat# ACC-99, RRID:CVCL_1619], and Mono-Mac-1 [DSMZ Cat# ACC-252, RRID:CVCL_1425] cells were obtained from the Deutsche Sammlung von Mikroorganismen und Zellkulturen (DSMZ). HEK-293T cells were obtained from the Characterized Cell Line Core Facility at MD Anderson Cancer Center, Houston TX. All experiments with cell lines were performed within 6 months after thawing or obtaining from DSMZ.
Assessment of apoptosis by annexin V staining
Untreated or drug-treated cells were stained with annexin V (Pharmingen, San Diego, CA) and TO-PRO-3 iodide (Life Technologies, Carlsbad, CA), and the percentages of apoptotic cells were determined by flow cytometry. To analyze synergism, cells were treated with combinations for 8, 16, 24, or 48 hours, and the percentages of annexin V–positive, apoptotic cells or the percentages of propidium iodide–positive, nonviable cells were determined by flow cytometry. We used matrix dosing of agents in combinations to allow synergy assessment by Bliss scoring utilizing the SynergyFinder V2 online web application tool (http://synergyfinder.fimm.fi/).
Assessment of percentage of nonviable cells
Following designated treatments, patient-derived AML cells were stained with TO-PRO-3 iodide (Life Technologies) and analyzed by flow cytometry on a BD Accuri CFlow-6 flow cytometer (BD Biosciences, San Jose, CA).
Statistical analysis
Significant differences between values obtained in AML cells treated with different experimental conditions compared with untreated control cells were determined using the Student t-test in GraphPad V8. For the in vivo mouse models, a 2-tailed, unpaired t-test was used for comparing total bioluminescent flux. For survival analysis, a Kaplan-Meier plot and a Mantel–Cox log-rank test were used for comparisons of different cohorts. P values of < .05 were assigned significance.
Detailed methods for reagents/antibodies, generation of mtRunx1 knock-in cell line, epigenome analysis, transcriptome analysis, protein translation assay, single-cell RNA-Seq, single-cell next-generation mass cytometry, and the in vivo models are provided in supplemental Materials and methods available on the Blood Web site.
Results
Impaired differentiation potential of AML cells following CRISPR knock-in of mtRUNX1
We first developed isogenic AML cellular models with or without the presence of mtRUNX1. For this, we created a pair of isogenic HL60 and OCI-AML2 cells with homozygous and heterozygous RUNX1 R174* mutation knocked in via CRISPR-Cas9, respectively (supplemental Figure 1A-B). As compared with the nonedited HL60 cells, the HL60R174*/R174* cells with homozygous nonsense RUNX1-R174* mutation expressed mtRUNX1 protein at a level higher than those observed in OCI-AML2R174*/wt cells with heterozygous mutation of RUNX1-R174* (Figure 1A). Concomitantly, wtRUNX1 levels declined accordingly more in HL60R174*/R174* compared with OCI-AML2R174*/wt cells (supplemental Figure 1C-D). As compared with their isogenic counterparts without RUNX1-R174* mutation, HL60R174*/R174* cells exhibited higher levels of RUNX2 but lower levels of RUNX3. Levels of RUNX2 and RUNX3 were unaltered in OCI-AML2R174*/wt cells (Figure 1A). Levels of CBFβ, the non-DNA binding heterodimeric partner of RUNX1 that stabilizes and increases DNA binding of RUNX1,1,2,7 were unaltered in both isogenic cell types despite the presence of RUNX1-R174* mutation. Compared with their isogenic counterparts without RUNX1-R174*, OCI-AML2R174*/wt and HL60R174*/R174* exhibited decline in PU.1 and c-Myc but not of GATA2, C/EBPα, and MPL levels, all myeloid lineage transcription factors except MPL, which is the receptor for thrombopoietin1,7,26,27 (Figure 1B; supplemental Figure 1E). Since somatic mutations in RUNX1 in AML are predominantly heterozygous,1,2,4,7 we focused more on determining the impact of RUNX1-R174* expression in OCI-AML2 cells. RUNX1 was previously shown to promote G1 to S phase cell-cycle transition, and RUNX1-deficient normal hematopoietic cells contained a higher percentage of S-phase cells.13,28 Consistent with this, Figure 1C shows that, compared with OCI-AML2, a lower percentage of OCI-AML2R174*/wt cells were in the S phase of cell cycle. This was associated with significantly reduced expression of differentiation-associated surface proteins CD86 and CD14 but higher expression of CD117 (c-KIT) (Figure 1D).29 To further probe the significance of this, we determined effects of 1.2% dimethyl sulfoxide (DMSO)-induced differentiation in OCI-AML2R174*/wt vs OCI-AML2 cells.30 As shown in Figure 1E-G, treatment with DMSO induced less CD11b expression and morphologic features of differentiation (percentage increase in metamyelocytes and myelocytes), suggesting a lower propensity for differentiation induction of OCI-AML2R174*/wt compared with OCI-AML2 cells. However, a similar level of DMSO-induced differentiation was observed in HL-60 cells with or without homozygous RUNX1-R174* (supplemental Figure 1F).
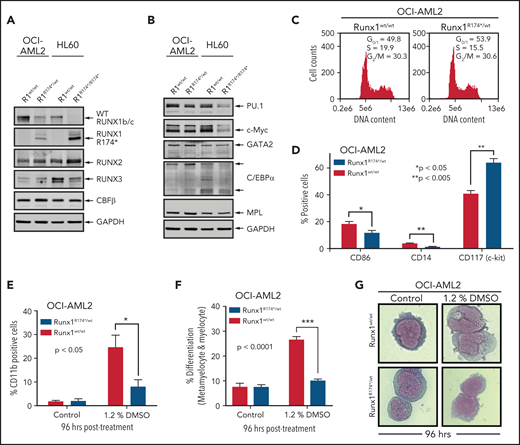
RUNX1R174* mutation in OCI-AML2 cells alters expression of CD86, CD14, and CD117 (c-Kit) and reduces DMSO-induced morphologic differentiation. (A-B) Representative immunoblot analysis of OCI-AML2, OCI-AML2 RUNX1R174*/wt, HL-60, and HL-60 RUNX1R174*/R174*. The expression levels of glyceraldehyde-3-phosphate dehydrogenase (GAPDH) in the cell lysates served as the loading control. (C) Cell cycle status of OCI-AML2 and OCI-AML2 RUNX1R174*/wt cells as determined by flow cytometry. Mean of 3 independent experiments. (D) Expression of CD86, CD14, and CD117 (c-Kit) in OCI-AML2 and OCI-AML2 RUNX1R174*/wt cells as determined by flow cytometry. Columns; mean of 3 experiments + standard error of the mean (SEM). * = expression values significantly different (*P < .05; **P < .005, by 2-tailed, unpaired t-test) in OCI-AML2 RUNX1R174*/wt compared with OCI-AML2 control cells. (E-G) Percent CD11b-positive and percent differentiated (metamyelocytes and myelocytes) OCI-AML2 and OCI-AML2 RUNX1R174*/wt cells following 96 hours treatment with 1.2% DMSO. In panels E and F, columns; mean of 3 experiments + (SEM). * = values significantly less (*P < .05; ***P < .0001, by 2-tailed, unpaired t-test) in OCI-AML2 RUNX1R174*/wt compared with OCI-AML2 cells. Representative cells shown in panel G.
RUNX1R174* mutation in OCI-AML2 cells alters expression of CD86, CD14, and CD117 (c-Kit) and reduces DMSO-induced morphologic differentiation. (A-B) Representative immunoblot analysis of OCI-AML2, OCI-AML2 RUNX1R174*/wt, HL-60, and HL-60 RUNX1R174*/R174*. The expression levels of glyceraldehyde-3-phosphate dehydrogenase (GAPDH) in the cell lysates served as the loading control. (C) Cell cycle status of OCI-AML2 and OCI-AML2 RUNX1R174*/wt cells as determined by flow cytometry. Mean of 3 independent experiments. (D) Expression of CD86, CD14, and CD117 (c-Kit) in OCI-AML2 and OCI-AML2 RUNX1R174*/wt cells as determined by flow cytometry. Columns; mean of 3 experiments + standard error of the mean (SEM). * = expression values significantly different (*P < .05; **P < .005, by 2-tailed, unpaired t-test) in OCI-AML2 RUNX1R174*/wt compared with OCI-AML2 control cells. (E-G) Percent CD11b-positive and percent differentiated (metamyelocytes and myelocytes) OCI-AML2 and OCI-AML2 RUNX1R174*/wt cells following 96 hours treatment with 1.2% DMSO. In panels E and F, columns; mean of 3 experiments + (SEM). * = values significantly less (*P < .05; ***P < .0001, by 2-tailed, unpaired t-test) in OCI-AML2 RUNX1R174*/wt compared with OCI-AML2 cells. Representative cells shown in panel G.
mtRUNX1 expression impairs ribosome biogenesis and protein translation in AML cells expressing mtRUNX1
We next interrogated the effect of RUNX1-R174* expression on the transcriptome in OCI-AML2R174*/wt vs OCI-AML2 cells. Supplemental Figure 2A-B demonstrates that OCI-AML2R174*/wtcells, compared with OCI-AML2 cells, show reduced total RNA levels (mRNA plus ribosomal RNA [rRNA]), with significant reduction in 60S ribosome subunit-associated 5S rRNA, which is transcribed by RNA pol III but not in the levels of 18S or 28S rRNA (supplemental Figure 2A-B).31,32 RNA-Seq analysis demonstrated that expression of RUNX1-R174* caused up- and downregulation of large numbers of mRNA, including repression of MYC targets and reduction in mRNA expression of genes encoding ribosomal proteins in mtRUNX1-expressing OCI-AML2 cells (Figure 2A-C). Gene-set enrichment analysis (GSEA) demonstrated negative normalized enrichment scores (NES) for MYC targets but positive NES for genes involved in TNFα signaling via NFkB, as well as for genes in the Reactome of stem cell factor and KIT signaling in OCI-AML2R174*/wt compared with OCI-AML2 cells (supplemental Figure 2C-F). Previous reports have highlighted that hematopoietic stem progenitor cells with a monoallelic loss of function of RUNX1 exhibit decreased RiBi, and that c-Myc regulates RiBi in hematopoietic stem-progenitor cells.13,28 Consistent with these reports, GSEA of the RNA-Seq data presented here also identified negative NES for gene sets belonging to the ribosome/tRNA pathways and RiBi (Figure 2D-E). Transcribed tRNA is recruited to the 40S ribosome to form the 43S preinitiation complex involved in scanning of the 5' cap structure in the mRNA during translation initiation.33 Therefore, we next conducted sucrose density gradients to compare the polysome profile in OCI-AML2R174*/wt vs OCI-AML2 cells.13,34 Although there was no change in total amount of polysomes or their 80S fraction, the 40S and 60S ribosome fractions were reduced in OCI-AML2R174*/wt cells (Figure 2F; supplemental Figure 2G). We next conducted RiboLace analysis to copurify and profile active ribosomes with their nuclease-protected intact mRNA footprint in OCI-AML2R174*/wt compared with OCI-AML2 cells.35 Heat map of up- or downregulated mRNAs in the RiboLace captured active ribosomes is shown in supplemental Figure 2H. GSEA of these mRNAs demonstrated negative NES for mRNAs of genes encoding ribosomal proteins (supplemental Figure 2I), as well as for mRNAs involved in RNA capping, ribosomal biogenesis, translation elongation, and termination, among others (Figure 2G). RiboLace analysis also revealed log2 fold-reduction in the mRNAs of genes in the active ribosomes (Figure 2H). Taken together, these findings underscore that the presence of a monoallelic mutation in RUNX1 represses c-Myc and markedly impairs RiBi, potentially conferring ribosomal stress in OCI-AML2 cells.
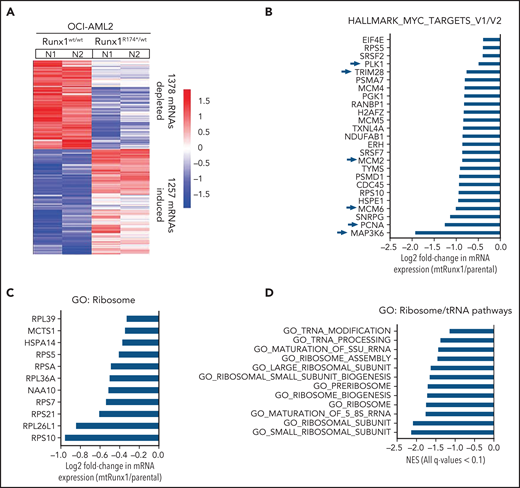
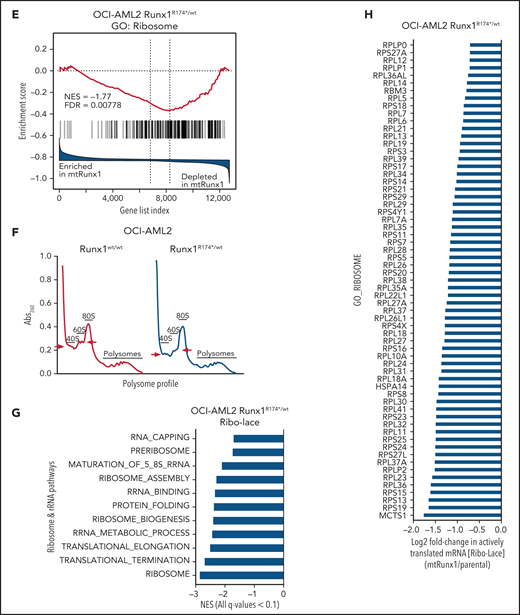
Heterozygous RUNX1 R174* mutation in OCI-AML2 depletes mRNA expressions of Myc target genes, gene sets involved in ribosome and tRNA pathways, and alters the polysome profile compared with parental OCI-AML2 cells. (A) RNA-Seq analysis was performed on OCI-AML2 and OCI-AML2 RUNX1R174*/wt (biologic duplicates). Heat map shows the number of mRNAs depleted or induced >1.25-fold and P value < .05 in the OCI-AML2 RUNX1R174*/wt compared with OCI-AML2 cells. (B-C) Log2 fold-change in mRNA expression levels of HALLMARK_MYC_TARGETS (V1 and V2) and GO: Ribosome gene sets in OCI-AML2 RUNX1R174*/wt compared with OCI-AML2 cells. (D) GSEA analysis and NES of OCI-AML2 RUNX1R174*/wt cell mRNA expressions compared with other ribosomal/tRNA-associated pathways. All false discovery rate (FDR) q-values <0.1. (E) Representative GSEA plots for OCI-AML2 RUNX1R174*/wt cell mRNA expressions compared with GO: Ribosome pathway. FDR q-value <0.1. (F) Polysome profiling of OCI-AML2 and OCI-AML2 RUNX1R174*/wt cells. The positions of the 40S, 60S, 80S, and polysomes in OCI-AML2 RUNX1R174*/wt relative to OCI-AML2 cells are noted. (G) RiboLace analysis was performed on OCI-AML2 and OCI-AML2 RUNX1R174*/wt cells. GSEA was performed against GO pathways utilizing the differentially translated mRNA signature in OCI-AML2 RUNX1R174*/wt vs OCI-AML2. Normalized enrichment scores are shown. All q-values are <0.1. (H) Log2 fold-change in actively translated mRNA (RiboLace) in OCI-AML2 RUNX1R174*/wt over OCI-AML2 cells compared with GO_Ribosome gene set.
Heterozygous RUNX1 R174* mutation in OCI-AML2 depletes mRNA expressions of Myc target genes, gene sets involved in ribosome and tRNA pathways, and alters the polysome profile compared with parental OCI-AML2 cells. (A) RNA-Seq analysis was performed on OCI-AML2 and OCI-AML2 RUNX1R174*/wt (biologic duplicates). Heat map shows the number of mRNAs depleted or induced >1.25-fold and P value < .05 in the OCI-AML2 RUNX1R174*/wt compared with OCI-AML2 cells. (B-C) Log2 fold-change in mRNA expression levels of HALLMARK_MYC_TARGETS (V1 and V2) and GO: Ribosome gene sets in OCI-AML2 RUNX1R174*/wt compared with OCI-AML2 cells. (D) GSEA analysis and NES of OCI-AML2 RUNX1R174*/wt cell mRNA expressions compared with other ribosomal/tRNA-associated pathways. All false discovery rate (FDR) q-values <0.1. (E) Representative GSEA plots for OCI-AML2 RUNX1R174*/wt cell mRNA expressions compared with GO: Ribosome pathway. FDR q-value <0.1. (F) Polysome profiling of OCI-AML2 and OCI-AML2 RUNX1R174*/wt cells. The positions of the 40S, 60S, 80S, and polysomes in OCI-AML2 RUNX1R174*/wt relative to OCI-AML2 cells are noted. (G) RiboLace analysis was performed on OCI-AML2 and OCI-AML2 RUNX1R174*/wt cells. GSEA was performed against GO pathways utilizing the differentially translated mRNA signature in OCI-AML2 RUNX1R174*/wt vs OCI-AML2. Normalized enrichment scores are shown. All q-values are <0.1. (H) Log2 fold-change in actively translated mRNA (RiboLace) in OCI-AML2 RUNX1R174*/wt over OCI-AML2 cells compared with GO_Ribosome gene set.
Collateral sensitivity of mtRUNX1-expressing AML cells to protein translation inhibitor OM and venetoclax
To determine whether impaired RiBi and ensuing accentuated ribosomal stress would confer collateral sensitivity to agents that inhibit protein translation, we compared activity of HHT (omacetaxine, OM) in AML cells harboring mtRUNX1 vs wtRUNX1. HHT was also one of the top EMs discovered through LINCS1000 CMap analysis, utilizing the RNA-Seq signature of RUNX1 knockdown in AML cells expressing mtRUNX1.7,14 Exposure to HHT for 8, 16, or 48 hours dose-dependently induced significantly more apoptosis in OCI-AML2R174*/wt vs OCI-AML2 cells (Figure 3A; supplemental Figure 3A-B). This was associated with reduction in protein levels of mtRUNX1 and the residual wtRUNX1, as well as depletion of c-Myc, c-Myb, MCL1, and Bcl-xL, without alterations in Bak and Bax levels (Figure 3B-C; supplemental Figure 3C-D). In contrast, p-JNK levels were increased in OCI-AML2R174*/wt cells (Figure 3B; supplemental Figure 3C-E).36 However, these protein perturbations were observed even after exposure to HHT for 2 hours (supplemental Figure 3E). HHT also dose-dependently induced apoptosis in OCI-AML5 and Mono-Mac-1 cells that endogenously harbor heterozygous mtRUNX1 (Figure 3D; supplemental Figure 3F).7 Notably, exposure to HHT dose-dependently caused greater loss of viability in patient-derived (PD) AML cells expressing mtRUNX1 as compared with those expressing wtRUNX1 or in normal CD34+ HPCs (Figure 3E; supplemental Figure 3G). Also, HHT treatment markedly reduced mRNA expression of genes transcribing tRNA (supplemental Figure 3H). Exposure of cells to relatively low levels of HHT significantly reduced nascent polypeptide elongation in the ribosomes, also observed following treatment with cycloheximide (supplemental Figure 3I). Consistent with impaired RiBi and protein translation in OCI-AML2R174*/wt cells, treatment with relatively low concentrations of the eIF4A inhibitor rocaglamide also induced more apoptosis in OCI-AML2R174*/wt vs OCI-AML2 cells, as well as in OCI-AML5 cells (supplemental Figure 3J-K).37 Notably, treatment with BCL2 inhibitor venetoclax also exerted more lethality in OCI-AML2R174*/wt compared with OCI-AML2 cells (Figure 3F). Although venetoclax treatment was associated with increased MCL1 levels, which is known to reduce sensitivity to venetoclax, it was also associated with slightly increased levels of proapoptotic Bim and Bak, which would promote venetoclax-induced apoptosis in OCI-AML2R174*/wt cells (Figure 3G; supplemental Figure 3L).38,39 We also assessed Bak conformation change following treatment with venetoclax. As shown in supplemental Figure 3M, compared with OCI-AML2 cells, following venetoclax treatment, OCI-AML2R174*/wt exhibit significantly more conformationally changed Bak levels.
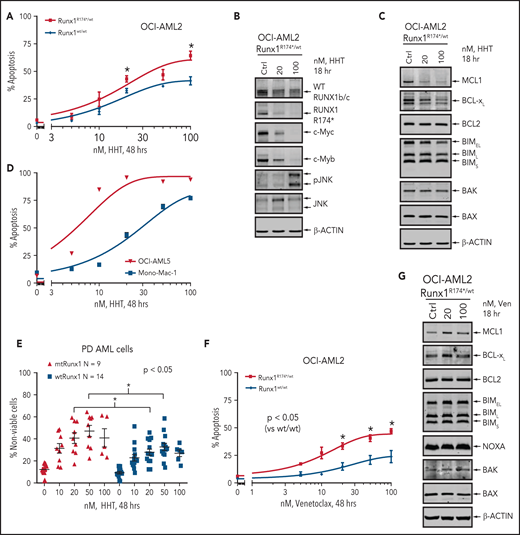
Treatment with HHT or venetoclax causes greater apoptosis in OCI-AML2 RUNX1R174*/wt compared with OCI-AML2 cells. (A) OCI-AML2 and OCI-AML2 RUNX1R174*/wt cells were treated with the indicated concentrations of HHT for 48 hours. Following this, the percentages of annexin V–positive, apoptotic cells were determined by flow cytometry. Mean of 3 independent experiments + SEM. *P < .05 as determined by a 2-tailed, unpaired t-test. (B-C) Representative immunoblot analysis of OCI-AML2 RUNX1R174*/wt cells treated with HHT as indicated for 18 hours. (D) OCI-AML5 and Mono-Mac-1 cells were treated with the indicated concentrations of HHT for 48 hours. Following this, the percentages of annexin V–positive, apoptotic cells were determined by flow cytometry. Mean of 3 independent experiments ± SEM. (E) Patient-derived mtRUNX1 and wtRUNX1-expressing AML cells were treated with the indicated concentrations of HHT for 48 hours. The cells were stained with To-Pro-3 iodide and the percentage of nonviable cells was determined by flow cytometry. *P < .05 as determined by a 2-tailed, unpaired t-test utilizing GraphPad V8. (F) OCI-AML2 and OCI-AML2 RUNX1R174*/wt cells were treated with the indicated concentrations of venetoclax for 48 hours. Following this, the percentages of annexin V–positive, apoptotic cells were determined by flow cytometry. Mean of 4 independent experiments + SEM. *P < .05 as determined by a 2-tailed, unpaired t-test. (G) Representative immunoblot analysis of OCI-AML2 RUNX1R174*/wt cells treated with venetoclax as indicated for 18 hours.
Treatment with HHT or venetoclax causes greater apoptosis in OCI-AML2 RUNX1R174*/wt compared with OCI-AML2 cells. (A) OCI-AML2 and OCI-AML2 RUNX1R174*/wt cells were treated with the indicated concentrations of HHT for 48 hours. Following this, the percentages of annexin V–positive, apoptotic cells were determined by flow cytometry. Mean of 3 independent experiments + SEM. *P < .05 as determined by a 2-tailed, unpaired t-test. (B-C) Representative immunoblot analysis of OCI-AML2 RUNX1R174*/wt cells treated with HHT as indicated for 18 hours. (D) OCI-AML5 and Mono-Mac-1 cells were treated with the indicated concentrations of HHT for 48 hours. Following this, the percentages of annexin V–positive, apoptotic cells were determined by flow cytometry. Mean of 3 independent experiments ± SEM. (E) Patient-derived mtRUNX1 and wtRUNX1-expressing AML cells were treated with the indicated concentrations of HHT for 48 hours. The cells were stained with To-Pro-3 iodide and the percentage of nonviable cells was determined by flow cytometry. *P < .05 as determined by a 2-tailed, unpaired t-test utilizing GraphPad V8. (F) OCI-AML2 and OCI-AML2 RUNX1R174*/wt cells were treated with the indicated concentrations of venetoclax for 48 hours. Following this, the percentages of annexin V–positive, apoptotic cells were determined by flow cytometry. Mean of 4 independent experiments + SEM. *P < .05 as determined by a 2-tailed, unpaired t-test. (G) Representative immunoblot analysis of OCI-AML2 RUNX1R174*/wt cells treated with venetoclax as indicated for 18 hours.
Effect of HHT on chromatin accessibility, active enhancers, and gene expressions in AML cells harboring mtRUNX1
Recent reports demonstrated that HHT inhibits binding of the transcription factor SP1 to its cognate DNA sequences, reduces TET1 and global 5-hydroxymethylcytosine (5hmC) levels, and increases DNA methylation with reduced transcription of active genes, including MYC.20,21 To extend these observations, we examined effects of HHT on active epigenome and gene-expressions in OCI-AML2R174*/wt compared with OCI-AML2 cells. Following treatment with HHT, ATAC-Seq analysis demonstrated lower chromatin accessibility, with reduced ATAC-Seq peaks across the genome as well as reduced transcription factor (TF) motifs of PU.1, IRF8, c-Myb, and c-Myc in the open chromatin, more so in OCI-AML2R174*/wt compared with OCI-AML2 cells (supplemental Figure 4A-C). Following exposure to HHT (100 nM for 16 hours), anti-H3K27Ac chromatin immunoprecipitation (ChIP)-Seq analysis showed decline in H3K27Ac signal intensity in the active super-enhancers (SEs) of RUNX1, MYC, MYB, and BCL2, with rank ordering of super enhancers (ROSE) plots highlighting reduced number of SEs in OCI-AML2R174*/wt cells (Figure 4A-B).40,41 ChIP-Seq analyses with anti-BRD4 antibody also showed that HHT treatment reduced BRD4 signal density at the SEs for RUNX1, BCL2, MYB, and MYC genes (Figure 4C). Following exposure to HHT, ATAC-Seq and ChIP-Seq (with anti-H3K27Ac, anti-BRD4, and anti-p300 antibodies) documented significant declines in H3K27Ac, p300, and BRD4 occupancy, as well as reduced ATAC-Seq peaks at MYC, RUNX1, and BCL2 SEs in OCI-AML2R174*/wt cells (Figure 4D; supplemental Figure 4D-E). RNA-Seq analysis showed that HHT treatment up- and downregulated a large number of mRNA expressions in OCI-AML2R174*/wt and OCI-AML2 cells (supplemental Figure 5A). The Venn diagram in Figure 5A also demonstrates that, whereas a number of gene expressions were commonly, and similarly, perturbed following HHT treatment, considerably more nonoverlapping mRNA gene expressions were upregulated than downregulated in OCI-AML2R174*/wt compared with OCI-AML2 cells. GSEA of the RNA-Seq–determined mRNA expression signatures demonstrated negative NES for gene sets of MYC targets and mTORC1 signaling, as well as the Reactomes of tRNA aminoacylation, protein translation, and peptide chain elongation in OCI-AML2R174*/wt compared with OCI-AML2 cells (Figure 5B; supplemental Figure 5B-C). Following treatment with HHT, log2 fold-change in mRNA expressions of MYC targets and of the Reactome for protein translation in OCI-AML2R174*/wt cells are shown in supplemental Figure 5D-E. We also conducted single-cell RNA (scRNA)-Seq to determine effects of HHT treatment on mRNA expressions in PD AML cells harboring mtRUNX1 (AML#11 in the oncoplot shown in supplemental Figure 6I). As shown in the Uniform Manifold Approximation and Projection plot in Figure 5C, treatment with HHT dramatically diminished the common myeloid progenitor and megakaryocyte-erythroid progenitor clusters as defined by gene expression patterns, utilizing the SingleR algorithm.42 Gene set variation analysis (GSVA) of mRNA expressions in HHT-treated cells showed positive correlations with genes involved in inflammatory response, p53, and apoptosis pathway but negative correlations with MYC targets and MTORC1 signaling (Figure 5D).43 Compared with untreated cells, treatment with HHT significantly depleted (fold-change >1.25 down and a FDR <0.05) in the HSC cluster the mRNA expressions of MYC, EIF4A, PIM1, multiple elongation factors, and ribosomal subunit genes (Figure 5E). The violin plots in Figure 5F highlight this with respect to the expression levels of MYC, EIF4A1, and PIM1 in untreated and HHT-treated HSC cells (P < .05). Previous reports have highlighted the role of PIM1 kinase in protein translation due to its activity in phosphorylating 4E-BP1 and S6 proteins.44,45 We next determined the effect of HHT or OTX015 on protein levels in the PD AML cells, utilizing CyTOF analyses.46,47Figure 5G demonstrates that treatment with HHT depleted protein expression of RUNX1, c-Myc, MCL1, and Bcl-xL but increased myeloperoxidase levels in phenotypically characterized AML stem/progenitor cells defined by expression of CD34 and high expressions of CD117, CD123, and CD244 but low expression of CD86 and CD11b.46,47 Treatment of these AML cells with OTX015 also depleted expression of c-Myc, PU.1, and Bcl-xL while increasing levels of myeloperoxidase (Figure 5H). Notably, treatment with HHT, OTX015 or venetoclax markedly reduced the percentage of CD34+ AML stem cells that were phenotypically characterized by the markers noted above (Figure 5I).48
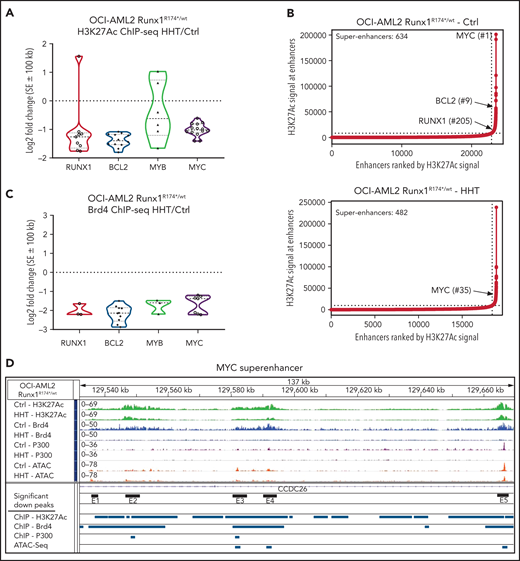
Treatment with HHT alters the epigenome in mtRUNX1-expressing AML cells. (A) Log2 fold-change in H3K27Ac peaks (determined by ChIP-Seq analysis) at super enhancer +/− 100 kb in HHT-treated vs control OCI-AML2 RUNX1R174*/wt cells. Fold changes were calculated utilizing DiffReps. (B) OCI-AML2 RUNX1R174*/wt cells were treated with 100 nM of HHT for 16 hours and cross-linked for H3K27Ac ChIP analysis. Ranked ordering of super enhancers determined by H3K27Ac ChIP-Seq and ROSE analysis. (C) Log2 fold-change in BRD4 peaks (determined by ChIP-Seq analysis) at super enhancer +/− 100 kb in HHT-treated vs control OCI-AML2 RUNX1R174*/wt cells. Fold changes were calculated utilizing DiffReps. (D) IGV plot of sequence tag densities for H3K27Ac, BRD4 ChIP-Seq, P300 ChIP-Seq, and ATAC-Seq peaks at the MYC super-enhancer locus in HHT-treated vs control OCI-AML2 RUNX1R174*/wt cells. Fold changes were calculated utilizing DiffReps. Log2 fold-changes in peak densities for H3K27Ac, BRD4, P300, and ATAC are denoted by blue bars.
Treatment with HHT alters the epigenome in mtRUNX1-expressing AML cells. (A) Log2 fold-change in H3K27Ac peaks (determined by ChIP-Seq analysis) at super enhancer +/− 100 kb in HHT-treated vs control OCI-AML2 RUNX1R174*/wt cells. Fold changes were calculated utilizing DiffReps. (B) OCI-AML2 RUNX1R174*/wt cells were treated with 100 nM of HHT for 16 hours and cross-linked for H3K27Ac ChIP analysis. Ranked ordering of super enhancers determined by H3K27Ac ChIP-Seq and ROSE analysis. (C) Log2 fold-change in BRD4 peaks (determined by ChIP-Seq analysis) at super enhancer +/− 100 kb in HHT-treated vs control OCI-AML2 RUNX1R174*/wt cells. Fold changes were calculated utilizing DiffReps. (D) IGV plot of sequence tag densities for H3K27Ac, BRD4 ChIP-Seq, P300 ChIP-Seq, and ATAC-Seq peaks at the MYC super-enhancer locus in HHT-treated vs control OCI-AML2 RUNX1R174*/wt cells. Fold changes were calculated utilizing DiffReps. Log2 fold-changes in peak densities for H3K27Ac, BRD4, P300, and ATAC are denoted by blue bars.
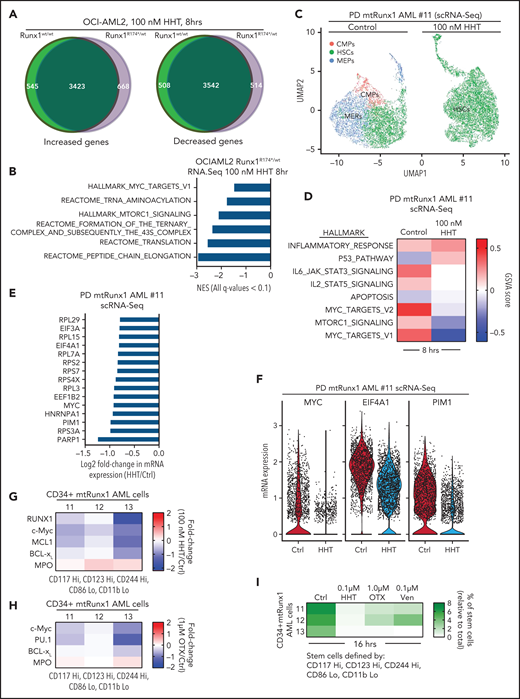
Treatment with HHT alters the transcriptome in mtRUNX1-expressing AML cells. (A) OCI-AML2 and OCI-AML2 RUNX1R174*/wt cells were treated with 100 nM of HHT for 8 hours in biologic triplicates and RNA-Seq analysis was performed. The Venn diagram shows the overlap of up- and downregulated genes in the HHT-treated OCI-AML2 and OCI-AML2 RUNX1R174*/wt cells. (B) GSEA of HHT-treated OCI-AML2 RUNX1R174*/wt cells against HALLMARK and Reactome pathways. (C) PD mtRUNX1 AML #11 cells were treated with 100 nM of HHT for 8 hours and single-cell RNA-Seq analysis was conducted. Aggregated Uniform Manifold Approximation and Projection plots showing cluster composition of control and HHT-treated PD mtRUNX1 AML #11 cells as determined by SingleR. (D) GSVA analysis of mRNA expression changes due to HHT treatment compared with HALLMARK pathways. (E) Log2 fold-change in MYC, PIM, elongation factor and ribosomal protein genes in the HSC cluster of PD mtRUNX1 AML #11 cells treated with 100 nM of HHT for 8 hours and analyzed by single-cell RNA-Seq analysis. (F) Violin plot of per-cell mRNA expression of MYC, EIF4A1 and PIM1 in the HSC cluster of control and HHT-treated PD, mtRUNX1 AML #11 cells. (G-H) PD mtRUNX1 AML samples 11, 12, and 13 were treated with the indicated concentrations of HHT or OTX015 for 16 hours. Cells were fixed, permeabilized and incubated with rare-metal-tagged antibodies for CyTOF analysis. Data were analyzed by Astrolabe. Fold-change in protein expressions in the stem cell population of PD mtRUNX1 AML samples 11, 12, and 13 following treatment with 100 nM of HHT or 1 µM of OTX015 for 16 hours is shown. (I) PD mtRUNX1 AML samples 11, 12, and 13 were treated with the indicated concentrations of HHT, OTX015, or venetoclax for 16 hours. Cells were fixed, permeabilized and incubated with rare metal tagged antibodies for CyTOF analysis. Data were analyzed by Astrolabe. Graphic shows the percentage of stem cells (relative to the total) in each AML sample pre- and posttreatment.
Treatment with HHT alters the transcriptome in mtRUNX1-expressing AML cells. (A) OCI-AML2 and OCI-AML2 RUNX1R174*/wt cells were treated with 100 nM of HHT for 8 hours in biologic triplicates and RNA-Seq analysis was performed. The Venn diagram shows the overlap of up- and downregulated genes in the HHT-treated OCI-AML2 and OCI-AML2 RUNX1R174*/wt cells. (B) GSEA of HHT-treated OCI-AML2 RUNX1R174*/wt cells against HALLMARK and Reactome pathways. (C) PD mtRUNX1 AML #11 cells were treated with 100 nM of HHT for 8 hours and single-cell RNA-Seq analysis was conducted. Aggregated Uniform Manifold Approximation and Projection plots showing cluster composition of control and HHT-treated PD mtRUNX1 AML #11 cells as determined by SingleR. (D) GSVA analysis of mRNA expression changes due to HHT treatment compared with HALLMARK pathways. (E) Log2 fold-change in MYC, PIM, elongation factor and ribosomal protein genes in the HSC cluster of PD mtRUNX1 AML #11 cells treated with 100 nM of HHT for 8 hours and analyzed by single-cell RNA-Seq analysis. (F) Violin plot of per-cell mRNA expression of MYC, EIF4A1 and PIM1 in the HSC cluster of control and HHT-treated PD, mtRUNX1 AML #11 cells. (G-H) PD mtRUNX1 AML samples 11, 12, and 13 were treated with the indicated concentrations of HHT or OTX015 for 16 hours. Cells were fixed, permeabilized and incubated with rare-metal-tagged antibodies for CyTOF analysis. Data were analyzed by Astrolabe. Fold-change in protein expressions in the stem cell population of PD mtRUNX1 AML samples 11, 12, and 13 following treatment with 100 nM of HHT or 1 µM of OTX015 for 16 hours is shown. (I) PD mtRUNX1 AML samples 11, 12, and 13 were treated with the indicated concentrations of HHT, OTX015, or venetoclax for 16 hours. Cells were fixed, permeabilized and incubated with rare metal tagged antibodies for CyTOF analysis. Data were analyzed by Astrolabe. Graphic shows the percentage of stem cells (relative to the total) in each AML sample pre- and posttreatment.
Synergistic lethal activity of omacetaxine and venetoclax or BET inhibitor (BETi) against mtRUNX1-expressing AML cells
In OCI-AML2R174*/wt cells, because venetoclax exerted greater lethal activity and HHT treatment reduced MCL1 and Bcl-xL levels, we next determined whether cotreatment with HHT and venetoclax would exert synergistic lethality against AML cells expressing mtRUNX1. As shown in Figure 6A,C and supplemental Figure 6A-C, cotreatment with relatively low concentrations of HHT and venetoclax for 24 or 48 hours induced more apoptosis and also exerted synergistic lethality not only against OCI-AML2R174*/wt, OCI-AML5 and Mono-Mac-1 cells but also against five samples of PD, primary AML cells expressing mtRUNX1 (Bliss synergy score >4). Whereas cotreatment with HHT and venetoclax also induced synergistic apoptosis in OCI-AML2 cells, the Bliss synergy scores were less than those observed in OCI-AML2R174*/wt cells (Figure 6A; supplemental Figure 6D). HHT and venetoclax cotreatment was also relatively less lethal in normal CD34+ progenitor cells (supplemental Figure 6E). Cotreatment with HHT and venetoclax was associated with marked depletion of protein levels of RUNX1, c-Myc, c-Myb, MCL1, and Bcl-xL in OCI-AML2R174*/wt and OCI-AML5 cells (Figure 6B; supplemental Figure 6F-G). Decline in Bcl-xL levels occurred with marked increase in levels of deamidated Bcl-xL, which has been previously reported to be associated with degradation of Bcl-xL (Figure 6B; supplemental Figure 6F-G).49-51 Deamidated Bcl-xL protein was confirmed by showing that treatment with etoposide also yielded a similar protein band as previously reported (supplemental Figure 6H).51 Collectively, these alterations in prodeath and prosurvival proteins induced by cotreatment with HHT and venetoclax could explain the superior lethal activity of this combination against AML cells expressing mtRUNX1. Oncoplot demonstrating mutations in RUNX1 and comutations present in the PD AML cells, used in these studies, is shown in supplemental Figure 6I. Supplemental Table 1 shows the Runx1 nucleic acid alteration and the associated protein change in the PD mtRunx1 AML samples. We also determined lethal activity of combined therapy with HHT and OTX015, which had been previously shown to exert lethal activity in AML cells expressing mtRUNX1.7 First, we confirmed that treatment with OTX015 dose-dependently induced greater loss of cell viability in PD AML cells harboring mtRUNX1 vs only wtRUNX1 (Figure 6D). Additionally, as shown in Figure 6E and supplemental Figure 6J-L, cotreatment with relatively low concentration of HHT and OTX015 induced more apoptosis than treatment with each agent alone, causing synergistic lethality with Bliss synergy scores >8.0 in OCI-AML2R174*/wt, OCI-AML5 and Mono-Mac-1 cells. This synergy was associated with decline in protein levels of wtRUNX1, c-Myc, c-Myb, and PU.1 but not of BRD4 and HEXIM1, following cotreatment of OCI-AML2R174*/wt and OCI-AML5 cells with HHT and OTX015 (Figure 6F; supplemental Figure 6M-N). Additionally, cotreatment with HHT and OTX015 was synergistically lethal against PD primary AML cells with mtRUNX1, with Bliss scores of >5 (Figure 6G). Whereas cotreatment with HHT and OTX015 also induced synergistic apoptosis in PD primary AML cells with wtRUNX1 (supplemental Figure 6O), the Bliss synergy scores were less than those observed in PD primary AML cells expressing mtRUNX1 (Figure 6G; supplemental Figure 6O). HHT and OTX015 combination was also relatively less lethal in normal CD34+ progenitor cells (supplemental Figure 6P).
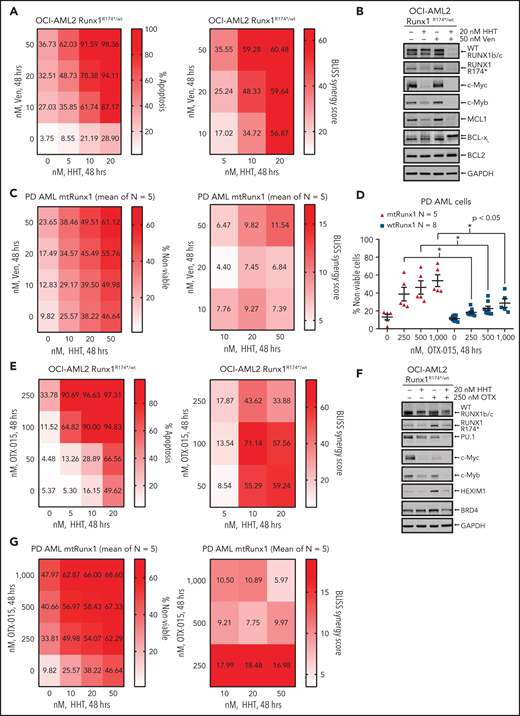
Cotreatment with HHT and venetoclax or OTX015 exerts synergistic in vitro lethal activity against mtRUNX1-expressing AML cells. (A) OCI-AML2 RUNX1R174*/wt cells were treated with the indicated concentrations of HHT and/or venetoclax for 48 hours. Cells were stained with annexin V and To-Pro-3 iodide, and the percentages of annexin V–positive, apoptotic cells were determined by flow cytometry. Bliss synergy scores were calculated utilizing SynergyFinder and graphed with GraphPad V8. (B) Representative immunoblot analyses of OCI-AML2 RUNX1R174*/wt cells treated with HHT and/or venetoclax for 18 hours. The expression of GAPDH served as the loading control. (C) Patient-derived mtRUNX1 AML blasts (n = 5) were treated with the indicated concentrations of HHT and/or venetoclax for 48 hours. The percentages of To-Pro-3 iodide positive, nonviable cells were determined by flow cytometry. Bliss synergy scores were calculated utilizing SynergyFinder and graphed with GraphPad V8. (D) Patient-derived wtRUNX1 (n = 8) and mtRUNX1 (n = 5) AML blasts were treated with the indicated concentrations of OTX015 for 48 hours. The percentages of To-Pro-3 iodide positive, nonviable cells were determined by flow cytometry. *P < .05 as determined by a 2-tailed, unpaired t-test. (E) OCI-AML2 RUNX1R174*/wt cells were treated with the indicated concentrations of HHT and/or OTX015 for 48 hours. Cells were stained with annexin V and To-Pro-3 iodide, and the percentages of annexin V–positive, apoptotic cells were determined by flow cytometry. Bliss synergy scores were calculated utilizing SynergyFinder and graphed with GraphPad V8. (F) Representative immunoblot analyses of OCI-AML2 RUNX1R174*/wt cells treated with HHT and/or OTX015 for 18 hours. The expression of GAPDH served as the loading control. (G) Patient-derived mtRUNX1 AML blasts (n = 5) were treated with the indicated concentrations of HHT and/or OTX015 for 48 hours. The percentages of To-Pro-3 iodide positive, nonviable cells were determined by flow cytometry. Bliss synergy scores were calculated utilizing SynergyFinder and graphed with GraphPad V8.
Cotreatment with HHT and venetoclax or OTX015 exerts synergistic in vitro lethal activity against mtRUNX1-expressing AML cells. (A) OCI-AML2 RUNX1R174*/wt cells were treated with the indicated concentrations of HHT and/or venetoclax for 48 hours. Cells were stained with annexin V and To-Pro-3 iodide, and the percentages of annexin V–positive, apoptotic cells were determined by flow cytometry. Bliss synergy scores were calculated utilizing SynergyFinder and graphed with GraphPad V8. (B) Representative immunoblot analyses of OCI-AML2 RUNX1R174*/wt cells treated with HHT and/or venetoclax for 18 hours. The expression of GAPDH served as the loading control. (C) Patient-derived mtRUNX1 AML blasts (n = 5) were treated with the indicated concentrations of HHT and/or venetoclax for 48 hours. The percentages of To-Pro-3 iodide positive, nonviable cells were determined by flow cytometry. Bliss synergy scores were calculated utilizing SynergyFinder and graphed with GraphPad V8. (D) Patient-derived wtRUNX1 (n = 8) and mtRUNX1 (n = 5) AML blasts were treated with the indicated concentrations of OTX015 for 48 hours. The percentages of To-Pro-3 iodide positive, nonviable cells were determined by flow cytometry. *P < .05 as determined by a 2-tailed, unpaired t-test. (E) OCI-AML2 RUNX1R174*/wt cells were treated with the indicated concentrations of HHT and/or OTX015 for 48 hours. Cells were stained with annexin V and To-Pro-3 iodide, and the percentages of annexin V–positive, apoptotic cells were determined by flow cytometry. Bliss synergy scores were calculated utilizing SynergyFinder and graphed with GraphPad V8. (F) Representative immunoblot analyses of OCI-AML2 RUNX1R174*/wt cells treated with HHT and/or OTX015 for 18 hours. The expression of GAPDH served as the loading control. (G) Patient-derived mtRUNX1 AML blasts (n = 5) were treated with the indicated concentrations of HHT and/or OTX015 for 48 hours. The percentages of To-Pro-3 iodide positive, nonviable cells were determined by flow cytometry. Bliss synergy scores were calculated utilizing SynergyFinder and graphed with GraphPad V8.
In vivo efficacy of combination of omacetaxine (OM) with venetoclax or BETi against AML cells expressing mtRUNX1
Given the marked in vitro synergy of HHT-based combination with venetoclax or OTX015 against cell lines and PD AML cells harboring mtRUNX1 noted above, we next determined in vivo antileukemia efficacy of OM alone or its cotreatment with venetoclax or OTX015 in NOD SCID gamma (NSG) mice engrafted with OCI-AML2R174*/wt or PD AML cells harboring mtRUNX1. Cotreatment with OM and venetoclax for 2 weeks caused significantly greater reduction in AML burden of OCI-AML2R174*/wt cells than treatment with each agent alone (Figure 7A; supplemental Figure 7A). The dose of each drug employed here was relatively low and previously determined to be safe.7,52,53 Monotherapy with OM or venetoclax at these dosages for a relatively short treatment interval of 3 weeks did not improve median or overall survival compared with treatment with vehicle control. However, combined treatment with OM and venetoclax for 3 weeks significantly improved median and overall survival of NSG mice engrafted with OCI-AML2R174*/wt cells compared with each agent alone (P < .0001) (Figure 7B). Next, we determined in vivo efficacy of treatment with OM and/or venetoclax or OTX015 against a PDX model in NSG mice engrafted with AML harboring RUNX1 mutation (E61*), ASXL1, EZH2, JAK2, and CEBPα (supplemental Figure 6I, AML #8). Although monotherapy with OTX015 and venetoclax reduced the AML burden, cotreatment with OM and venetoclax or OTX015 reduced AML burden significantly more than treatment with each agent alone (Figure 7C-D). Here, treatment with 1.0 vs 0.5 mg/kg of OM for 6 weeks was also more effective in improving the median and overall survival of the mice (Figure 7E; supplemental Figure 7B-C). Notably, cotreatment with OM (1.0 mg/kg) and venetoclax significantly improved median and overall survival as compared with treatment with each agent alone (P < .01) (Figure 7E; supplemental Figure 7B-C). Additionally, combined therapy with OM and OTX015 also improved median and overall survival significantly more than treatment with each agent alone (Figure 7F; supplemental Figure 7B-C). Neither monotherapy with the agents nor treatment with the combinations was associated with weight loss or other toxicities as compared with mice treated with vehicle alone. These findings indicate that combined therapy with OM and venetoclax or a BETi is effective as in vivo therapy for AML harboring mtRUNX1.
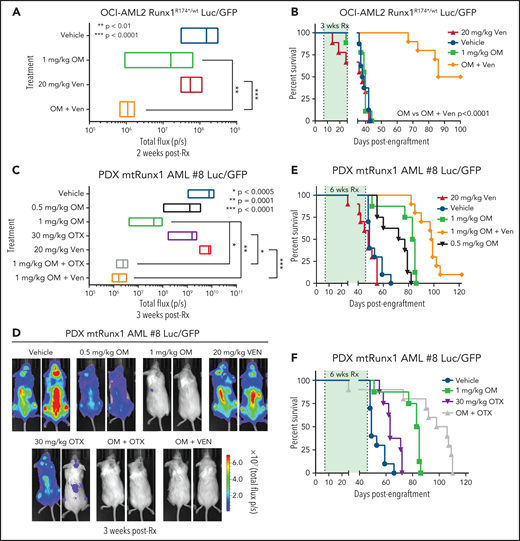
Cotreatment with HHT and venetoclax or OTX015 reduces in vivo leukemia burden and significantly improves survival of mice bearing mtRUNX1 AML xenografts. (A) Total bioluminescent flux in NSG mice (n = 10) bearing OCI-AML2 RUNX1R174*/wt GFP/Luc xenografts treated for 2 weeks with OM (1 mg/kg, s.c., daily × 5 days), venetoclax (Ven) (20 mg/kg, P.O., daily × 5 days) or combination of omacetaxine with venetoclax. (B) Kaplan-Meier survival curve of NSG mice (n = 8) bearing OCI-AML2 RUNX1R174*/wt GFP/Luc xenografts treated for 3 weeks with OM, venetoclax (Ven or combination of omacetaxine with venetoclax. (C) Total bioluminescent flux in NSG mice (n = 10) bearing PDX mtRUNX1 AML#8-GFP/Luc xenografts treated for 3 weeks with OM (0.5 or 1 mg/kg s.c., daily × 5 days per week), BET inhibitor OTX015 (OTX) (30 mg/kg, P.O., daily × 5 days per week), venetoclax, (20 mg/kg, P.O., daily × 5 days per week) or combinations of 1 mg/kg omacetaxine with OTX015 or venetoclax. (D) Representative images of mice treated for 3 weeks as in panel C. (E-F) Kaplan-Meier survival curve of NSG mice (n = 8) bearing PDX mtRUNX1 AML#8-GFP/Luc xenografts treated for 6 weeks with omacetaxine OM, venetoclax, OTX015, or combinations of omacetaxine with venetoclax or omacetaxine with OTX015.
Cotreatment with HHT and venetoclax or OTX015 reduces in vivo leukemia burden and significantly improves survival of mice bearing mtRUNX1 AML xenografts. (A) Total bioluminescent flux in NSG mice (n = 10) bearing OCI-AML2 RUNX1R174*/wt GFP/Luc xenografts treated for 2 weeks with OM (1 mg/kg, s.c., daily × 5 days), venetoclax (Ven) (20 mg/kg, P.O., daily × 5 days) or combination of omacetaxine with venetoclax. (B) Kaplan-Meier survival curve of NSG mice (n = 8) bearing OCI-AML2 RUNX1R174*/wt GFP/Luc xenografts treated for 3 weeks with OM, venetoclax (Ven or combination of omacetaxine with venetoclax. (C) Total bioluminescent flux in NSG mice (n = 10) bearing PDX mtRUNX1 AML#8-GFP/Luc xenografts treated for 3 weeks with OM (0.5 or 1 mg/kg s.c., daily × 5 days per week), BET inhibitor OTX015 (OTX) (30 mg/kg, P.O., daily × 5 days per week), venetoclax, (20 mg/kg, P.O., daily × 5 days per week) or combinations of 1 mg/kg omacetaxine with OTX015 or venetoclax. (D) Representative images of mice treated for 3 weeks as in panel C. (E-F) Kaplan-Meier survival curve of NSG mice (n = 8) bearing PDX mtRUNX1 AML#8-GFP/Luc xenografts treated for 6 weeks with omacetaxine OM, venetoclax, OTX015, or combinations of omacetaxine with venetoclax or omacetaxine with OTX015.
Discussion
In present studies, by CRISPR editing and knock-in of a single copy of mtRUNX1 into AML OCI-AML2 cells that otherwise have 2 WT copies of RUNX1, we created OCI-AML2R174*/wt cells. Notably, these cells displayed reduced differentiation potential and decline in levels of myeloid lineage transcriptional regulators, including wtRUNX1, PU.1, and c-Myc.1,26 Consistent with this, OCI-AML2R174*/wt cells also displayed positive enrichment of gene sets involved in stem cell factor or c-KIT signaling.48 Additionally, knock-in of mtRUNX1 in OCI-AML2R174*/wt cells negatively enriched for mRNA gene sets of MYC targets as well as small and large ribosome subunits, ribosomal RNA maturation, ribosomal assembly, ribosome biogenesis, and tRNA processing.13,54 Collectively, reduced mRNA expressions of MYC targets and ribosomal proteins, as well as attenuated 5S rRNA and mRNA encoding RNA Pol III isoforms that transcribe tRNA, lead to impaired RiBi in human AML cells harboring mtRUNX1.13,23 Overall, these findings also explain the observed polysome profile in OCI-AML2R174*/wt cells showing reduced levels of 40S and 60S ribosome fractions. These findings in human AML cells are also consistent with previous reports documenting that presence of mtRUNX1 in mouse hematopoietic stem/progenitor cells also impairs RiBi.13,23,28 Interrogation by RiboLace analysis further highlighted the impact of impaired RiBi on ribosomal dysfunction in mtRUNX1-expressing AML cells. RiboLace-captured active ribosomes from OCI-AML2R174*/wt cells showed decreased levels of nuclease-protected mRNAs encoding ribosomal proteins.35 This mRNA profile negatively enriched for gene sets involved in RNA capping, maturation of ribosomal RNA, translation elongation, and RiBi. Taken together, these findings highlight the extent to which presence of mtRUNX1 and attenuated wtRUNX1 undermine ribosome function and potentially induce ribosome stress, and whether it can be exploited to achieve preferential cytotoxicity in AML cell harboring mtRUNX1.
Consistent with the evidence discussed above, findings here indeed demonstrate that AML cells harboring mtRUNX1 are preferentially sensitized to lethal activity of protein translation inhibitors, including omacetaxine (HHT) and the eIF4A inhibitor rocaglamide.37 ATAC-Seq, ChIP-Seq, and RNA-Seq findings with respect to the effects of HHT in mtRUNX1-expressing AML cells highlighted HHT-induced perturbations on active enhancers and mRNA expression profiles of RUNX1, c-Myc, and its targets, as well as on the mRNA of genes involved in mTORC1 signaling, RiBi, and ribosomal function. Similar impact of HHT treatment on gene sets of MYC targets and MTORC1 signaling was confirmed by scRNA-Seq evaluation of mRNA expressions in freshly procured, patient-derived AML cells harboring mtRUNX1. HHT treatment also positively enriched for gene sets involved in inflammatory response, p53 signaling, and apoptosis pathways in AML cells harboring mtRUNX1.31 These findings also explain why HHT treatment led to marked decline in common myeloid progenitor and megakaryocyte-erythroid progenitor cell clusters.55,56 Further support for the anti-AML activity of HHT in mtRUNX1-expressing AML cells is provided by the observation that treatment with HHT attenuated wtRUNX1, c-Myc, c-Myb, MCL1, and Bcl-xL while inducing levels of p-JNK.57,58 They also provided an explanation for the previously reported discovery that HHT is among the top EMs of the RNA-Seq signature of RUNX1 knockdown causing loss of survival of mtRUNX1-expressing AML cells.7 Collectively, HHT-mediated specific effects on the epigenome, transcriptome, and proteome provide an insight into why HHT treatment is able to reduce numbers of phenotypically characterized, leukemia-initiating AML stem cells harboring mtRUNX1.
It is noteworthy that cotreatment with venetoclax and cytarabine or azacytidine have yielded superior antileukemia activity, and these combinations are now routinely employed for therapy in patients with AML.59,60 Present findings for the first time demonstrate that cotreatment with venetoclax and HHT also exerts synergistic in vitro lethality in cultured AML cell lines and PD primary AML cells that harbor mtRUNX1, as well as in OCI-AML2R174*/wt compared with OCI-AML2 cells. Treatment with HHT reduced levels of antiapoptotic MCL1 and Bcl-xL, which likely created greater dependency on BCL2 for reducing the threshold for apoptosis and supporting survival of OCI-AML2R174*/wt cells.25,39,57 Notably, compared with OCI-AML2, OCI-AML2R174*/wt cells were more sensitive to not only HHT but also venetoclax-induced apoptosis. This likely also explains why cotreatment with HHT and venetoclax exerts synergistic lethality in OCI-AML2R174*/wt cells. Cotreatment with HHT and venetoclax not only attenuated Bcl-xL but also increased deamidated Bcl-xL levels, which are known to be associated with degradation of Bcl-xL.51 This observation also explains the in vitro synergy due to cotreatment with HHT and venetoclax. Importantly, the observed in vitro synergy translated into superior in vivo anti-AML efficacy of the combination of OM and venetoclax. Compared with each agent alone, combined therapy with OM and venetoclax not only significantly reduced leukemia burden but also improved median and overall survival without causing any toxicity in mice engrafted with human AML cells harboring mtRUNX1. Taken together, findings presented here strongly support testing combined therapy with OM and venetoclax in patients with myeloid malignancies with somatic and/or germline mtRUNX1.
Previous reports have highlighted that BET inhibitors reduce BRD4 occupancy on SEs, attenuate not only RUNX1 but also c-Myc, PU.1, and c-Myb levels, as well as induce greater loss of viability of AML cells harboring mtRUNX1 compared with those with only wtRUNX1.7,40,41 Findings presented here extend these observations by demonstrating that the BET inhibitor OTX015 also induced more lethality in PD AML cells expressing mtRUNX1 compared with wtRUNX1. It is noteworthy that HHT treatment also decreased BRD4 occupancy on the SEs and attenuated expression of Runx1, c-Myc, and c-Myb in AML expressing mtRUNX1. Coupled with this, our observations that HHT treatment also depleted MCL1 and Bcl-xL levels explain why cotreatment with HHT and BETi exerts synergistic lethality in AML cell lines and PD AML cells harboring mtRUNX1. This in vitro synergy also translated into superior in vivo anti-AML efficacy of the combination of OM and OTX015. Treatment with this combination markedly reduced AML burden and improved survival of immune-depleted mice engrafted with AML harboring mtRUNX1. Currently, the ELN classification of prognostic subtypes of AML designates AML with mtRUNX1 as a provisional entity associated with poor prognosis.11 As noted above, venetoclax-based combination therapies in AML have exhibited improved clinical outcomes. Therefore, supported by our preclinical findings discussed here, if diligently designed, future clinical trials of OM-based combinations with venetoclax and/or BET inhibitor are conducted and yield improved clinical outcomes, it may then be necessary to reconsider the separate designation for AML with mtRUNX1 as an entity associated with poor prognosis.
Acknowledgments
The authors thank the Sequencing and Microarray Core Facility and the Flow Cytometry and Cellular Imaging (FCCI) Core Facility, which are supported by the Anderson Cancer Center Support Grant 5 P30 CA016672-40. K.N.B. was supported by a grant from the N.I.H (R01 CA255721). This research is supported in part by the Anderson Cancer Center Leukemia SPORE (P50 CA100632).
Authorship
Contribution: K.N.B. designed the study, analyzed data, and wrote the manuscript; Y.Q. and X.S. performed bioinformatics analyses; C.P.M., W.F., C.B., J.A.D., M.R.G., and J.D.K. performed research and analyzed the data; C.D.D., T.M.K., K.T., N.S., N.D., M.O., G.B., and S.M.K. contributed critical reagents; W.F. also wrote the manuscript.
Conflict-of-interest disclosure: The authors declare no competing financial interests.
Correspondence: Kapil N. Bhalla, Department of Leukemia, The University of Texas MD Anderson Cancer Center, 1400 Holcombe Blvd, Unit 428, Houston, TX 77030; e-mail: kbhalla@mdanderson.org.
ATAC-Seq, ChIP-Seq, bulk RNASeq, and single-cell RNA-Seq datasets have been deposited in GEO and assigned accession IDs: GSE181977 (ATAC-seq), GSE182006 (ChIP-seq), GSE182018 (RNA-seq), and GSE182020 (scRNA-seq). These data are also included within a Super Series assigned accession ID: GSE182023. The datasets generated during and/or analyzed during the current study are also available from the corresponding author on reasonable request.
The online version of this article contains a data supplement.
There is a Blood Commentary on this article in this issue.
The publication costs of this article were defrayed in part by page charge payment. Therefore, and solely to indicate this fact, this article is hereby marked “advertisement” in accordance with 18 USC section 1734.

This feature is available to Subscribers Only
Sign In or Create an Account Close Modal