

Key Points
In the absence of HBO1, H3K14ac is lost, and hematopoietic stem cells differentiate into progenitors at the expense of self-renewal.
HBO1 governs stem cell quiescence and self-renewal by promoting gene transcription, including Gata2, Mpl, Erg, Pbx1, Meis1, and Hoxa9.

Abstract
The histone acetyltransferase HBO1 (MYST2, KAT7) is indispensable for postgastrulation development, histone H3 lysine 14 acetylation (H3K14Ac), and the expression of embryonic patterning genes. In this study, we report the role of HBO1 in regulating hematopoietic stem cell function in adult hematopoiesis. We used 2 complementary cre-recombinase transgenes to conditionally delete Hbo1 (Mx1-Cre and Rosa26-CreERT2). Hbo1-null mice became moribund due to hematopoietic failure with pancytopenia in the blood and bone marrow 2 to 6 weeks after Hbo1 deletion. Hbo1-deleted bone marrow cells failed to repopulate hemoablated recipients in competitive transplantation experiments. Hbo1 deletion caused a rapid loss of hematopoietic progenitors. The numbers of lineage-restricted progenitors for the erythroid, myeloid, B-, and T-cell lineages were reduced. Loss of HBO1 resulted in an abnormally high rate of recruitment of quiescent hematopoietic stem cells (HSCs) into the cell cycle. Cycling HSCs produced progenitors at the expense of self-renewal, which led to the exhaustion of the HSC pool. Mechanistically, genes important for HSC functions were downregulated in HSC-enriched cell populations after Hbo1 deletion, including genes essential for HSC quiescence and self-renewal, such as Mpl, Tek(Tie-2), Gfi1b, Egr1, Tal1(Scl), Gata2, Erg, Pbx1, Meis1, and Hox9, as well as genes important for multipotent progenitor cells and lineage-specific progenitor cells, such as Gata1. HBO1 was required for H3K14Ac through the genome and particularly at gene loci required for HSC quiescence and self-renewal. Our data indicate that HBO1 promotes the expression of a transcription factor network essential for HSC maintenance and self-renewal in adult hematopoiesis.
Introduction
Adult hematopoiesis is a coordinated process in which hematopoietic stem cells (HSCs) differentiate via cell lineage decision steps into mature blood cells while at the same time maintaining the HSC pool through self-renewal.1 In order to keep a stable HSC pool and prevent HSC exhaustion, HSCs capable of long-term reconstitution of an irradiated host (LT-HSCs) enter the cell cycle, divide, and then return 1 or 2 daughter cells to quiescence (G0) until the next self-renewing cycle is required.1,2 In mice, LT-HSCs divide infrequently3 and only occasionally contribute to adult steady-state hematopoiesis.4,5 Both extrinsic signals originating from the HSC niche and cell-intrinsic factors play important roles in maintaining HSC quiescence and regulating self-renewal.1,2
HSCs are heterogeneous and can display distinct lineage bias after transplantation.3,6,7 Epigenetic mechanisms, at least in part, underlie this phenomenon8,9 and epigenetic regulators have profound effects on HSC function.10 For example, the DNA methyltransferase DNMT3a is required for HSC differentiation but not HSC self-renewal.11 Posttranslational modifications of histones, in particular histone methylation and acetylation, are required for regulation of gene expression12 and have critical roles in HSC function. For example, the methyltransferase mixed lineage leukemia 1 protein (MLL1) is required for definitive hematopoiesis, but interestingly its enzymatic activity appears to be dispensable.13-15 Conversely, the MYST family lysine acetyltransferase 6A (KAT6A/MOZ/MYST3) is essential for HSC formation during embryogenesis and maintenance of adult HSCs,16-18 which requires its acetylation activity.19 Similarly, another MYST protein, MOF (KAT8), is required for HSC maintenance and engraftment.20 A complete understanding of HSC function therefore necessitates detailed knowledge of the role of chromatin regulators in hematopoiesis.
HBO1 (MYST2/KAT7) is a member of the MYST family of histone acetyltransferases that includes KAT6A, KAT6B (MYST4/MORF/QKF), MOF (MYST1/KAT8), and TIP60 (KAT5/HTATIP).21 HBO1 was first identified as a protein binding to the origin of ORC122 and proposed to be essential for cell proliferation.23 However, embryonic tissues,24 embryonic fibroblasts,24 and adult thymocytes25 can proliferate without HBO1.26 Instead, loss of HBO1 affects gene expression and cell viability during embryogenesis24 and T-cell development.25Hbo1 germline deletion impairs embryonic patterning gene expression and results in developmental arrest at embryonic day 8.5 (E8.5).24Hbo1 deletion during T-cell development results in reduced numbers of peripheral CD4+ or CD8+ cells but does not alter the T-cell receptor repertoire or block thymocyte maturation.25Hbo1 has been shown to be essential for the progression of leukemic stem cells, suggesting that HBO1, like KAT6A and KAT6B, might be a clinically relevant therapeutic target.27-29
HBO1 is the enzymatic component of a chromatin modifying protein complex together with a variety of alternative adaptor proteins that may include JADE or BRPF and ING family proteins together with MEAF6.23,30-33 HBO1, depending on the presence of JADE or BRPF proteins, specifically acetylates histone H4 or histone H3, respectively.30,33 Furthermore, the levels of HBO1 occupancy on gene loci have been shown to be correlated positively with the level of gene expression.31,34 HBO1 is crucial for H3K14 acetylation (H3K14ac) in fetal liver erythroblasts,31 mouse embryonic development,24 and T-cell development25 and promotes gene transcription.
In this study, we have used inducible and tissue-specific genetic deletion to investigate the function of HBO1 in the hematopoietic system. Our data indicate that HBO1 promotes expression of multiple genes encoding a hematopoietic transcription factor network essential for HSC quiescence and self-renewal in adult hematopoiesis.
Material and methods
Mice
Experiments were approved by the Walter and Eliza Hall Institute Animal Ethics Committee and conformed to the Australian Code of Practice. Mice (C57BL/6 background) were used between 9 to 14 weeks of age and kept in a 12-hour light and 12-hour dark cycle at 22°C. The ethical endpoint was determined as >15% weight loss and anemia. Mice that had reached the ethical endpoint were euthanized.
Flow cytometry and competitive transplantation assays
Flow cytometry was performed as described in supplemental Methods, available on the Blood Web site; cells were identified using cell surface markers (supplemental Table 1). One million to 5 million viable bone marrow cells at test-competitor ratios of 4:1 to 1:1 were injected into the lateral tail veins of lethally irradiated (2 doses: 5.5 Gy separated by 3 hours) CD45.1 C57BL/6 congenic recipients as previously described.18
Assays of committed progenitors
2.5 × 10⁴ control bone marrow cells or cells lacking HBO1 were cultured in 1 mL of 0.3% agar and stimulated using purified growth factors: stem cell factor (SCF, 100 ng/mL), erythropoietin (2 U/mL), and/or interleukin-3 (IL-3, 10 ng/mL). Cultures were incubated at 37°C for 7 days, then fixed, stained, and counted as described.35
In vitro HSC culture and NUMB staining
Lineage−, cKIT+, SCA1+ (LSK)CD150+ fluorescence-activated cell sorter (FACS)-sorted cells were plated on 8-well chamber slides coated with green fluorescent protein (GFP)-labeled OP9 feeder cells. Cells were cultured in StemSpan serum-free medium (Stem Cell Technologies) with SCF (30 ng/mL) and FLT-3 ligand (30 ng/mL) overnight. Nocodazole (20 nM) was added after ∼16 hours. Cells were cultured for a further 24 hours and stained for NUMB (Cell Signaling; 1:100) and GFP (Invitrogen; 1:400) as described.36,37 Cells were counterstained with 4′,6-diamidino-2-phenylindole (DAPI). Images were taken with Zeiss Axioplan2 or Zeiss LSM 780 confocal microscope.
RNA-seq and analysis
RNA (50 ng) isolated from FACS-sorted LSK or progenitor cells was used to generate barcoded sequencing libraries. Paired-end 80 bp RNA-sequencing (RNA-seq) short reads were generated using NextSeq500 (Illumina), between 20 million and 48 million read pairs for each sample. Reads were aligned to the Mus musculus genome (mm10) using Rsubread.38 The number of read pairs overlapping mouse Entrez genes was summarized using featureCounts and Rsubread’s built-in National Center for Biotechnology Information gene annotation.
CUT&Tag sequencing
CUT&Tag sequencing was performed to detect H3K14ac levels in Hbo1fl/fl;Mx1-Cre vs Hbo1fl/+;Mx1-Cre control mouse LSK cells as described39 with Drosophilamelanogaster Schneider cell spike-in. The distribution of HBO1 genome occupancy was assessed in control cells.
Statistical analyses
Statistical analyses, other than the RNA-seq analysis, were carried out using SigmaStat 3.5 (Systat Software Inc, USA). Data were analyzed using 2-tailed Student t tests.
Further experimental details are provided in supplemental Materials.
Results
To determine HBO1 functions in adult hematopoiesis, we examined mice in which Hbo1 exon 1 (flanked by loxP sites24) was deleted using 2 different cre-recombinase transgenes, Mx1-Cre40 (Hbo1Mx1Cre hereafter) or Rosa26-CreERT241 (Hbo1CreER hereafter). Two different cre-recombinases were used to control for the specific effects of induction of each cre-recombinase, as well as for the induction treatments (poly[I:C], tamoxifen). Excision of exon 1 generates a null allele.24
Hbo1 deletion causes lethality and a loss of hematopoietic stem cells in adult mice
In order to determine the long-term effect of Hbo1 deletion on hematopoiesis and survival, Hbo1 deletion was induced with tamoxifen in Hbo1CreER mice (Figure 1A). Hbo1fl/+;CreER control mice did not show obvious signs of illness during the 6-week study period. In contrast, Hbo1fl/fl;CreER mice showed pale foot pads, hunched posture, inactivity, and loss of appetite. They reached the ethical endpoint between 2 and 6 weeks after the first tamoxifen treatment (Figure 1B). Histology of the sternums showed fewer bone marrow cells and increased adipose infiltration in Hbo1fl/fl;CreER mice (Figure 1C). The number of peripheral, lymphocytes, and monocytes were significantly reduced by 29%, 32%, and 83%, respectively, in Hbo1fl/fl;CreER mice compared with Hbo1fl/+;CreER mice (Figure 1D). Hbo1fl/fl;CreER mice had a ∼56% to ∼67% reduction in hematocrit, red blood cell number, hemoglobin, and platelets (Figure 1D). These results indicated that loss of HBO1 caused a multilineage defect. FACS analyses showed a ∼87% reduction in CD150+CD48− HSCs in Hbo1fl/fl;CreER mice compared with Hbo1fl/+;CreER mice (0.005 ± 0.001% vs 0.03 ± 0.003% of live cells, P = .00002; Figure 1E), supporting the notion that Hbo1 deletion leads to HSCs exhaustion.
![Hbo1 deletion causes hematopoietic failure and death. (A) PCR genotyping (wild-type [WT] Hbo1 allele product 190 bases; floxed Hbo1 allele 283 bases; deleted Hbo1 allele 358 bases24) showing Rosa26-CreERT2 (CreER)-mediated Hbo1 deletion in bone marrow from Hbo1fl/+;CreER and Hbo1fl/fl;CreER mice (n = 7 animals per genotype) treated 3× with tamoxifen (150 mg/kg body weight [BW] per dose, doses 48 hours apart). Samples were collected from 1 pair of age- and gender-matched Hbo1fl/+;CreER and Hbo1fl/fl;CreER mice when each Hbo1fl/fl;CreER mouse reached the ethical endpoint. (B) Kaplan-Meier survival curve after CreER-mediated Hbo1 deletion; representative sections from n = 7 animals per genotype examined. (C) Hematoxylin- and eosin-stained sternum sections displaying the bone marrow (n = 7 animals per genotype). (D) Peripheral blood analysis results (n = 7 animals per genotype). (E) Representative FACS plots of LSK cells and HSCSLAM, MPPSLAM, and progenitor cells in the bone marrow of Hbo1fl/+;CreER and Hbo1fl/fl;CreER mice (n = 7 animals per genotype); percentage of viable cells indicated. Data are displayed as mean ± standard error of the mean (SEM) and were analyzed using a 2-tailed Student t test. Detailed flow cytometry gating strategies are displayed in supplemental Figure 1. HCT, hematocrit; HGB, hemoglobin; RBC, red blood cell count; WBC, white blood cell count.](https://ash.silverchair-cdn.com/ash/content_public/journal/blood/139/6/10.1182_blood.2021013954/3/m_bloodbld2021013954f1.png?Expires=1767726827&Signature=ylOJjqEreyqA5U9pITh-iE7iT0LgjKgnfxwV~AMbCii9L-xrd8nbGps1gQNyrlHXgTbubrJbRM6Q0KuLyG9rveqf2iOGflRoaJN4UDlOwHTeBOKKt8JYAM8vHfvWdumdo0bj9jC7hIhTNbkQnFcgLPXdIqC0coROfZZb-evz5ssYNdB6FuPO9HeIsxNkXMb-1BIX1LmZTa~F4vU9YrH9HYtcibkkX2Bw-ppWpHxQiCZcDNXsc0MYZFKWlErsGLHHhAMIOLoRV-cD1-S2oYusFlD3TC8V4qSEg2yoj3ZNU0cyzfsDl1Sh11pnXFgsUM7iIXe4zVm95OrxA~itUgU7CQ__&Key-Pair-Id=APKAIE5G5CRDK6RD3PGA)
Hbo1 deletion causes hematopoietic failure and death. (A) PCR genotyping (wild-type [WT] Hbo1 allele product 190 bases; floxed Hbo1 allele 283 bases; deleted Hbo1 allele 358 bases24) showing Rosa26-CreERT2 (CreER)-mediated Hbo1 deletion in bone marrow from Hbo1fl/+;CreER and Hbo1fl/fl;CreER mice (n = 7 animals per genotype) treated 3× with tamoxifen (150 mg/kg body weight [BW] per dose, doses 48 hours apart). Samples were collected from 1 pair of age- and gender-matched Hbo1fl/+;CreER and Hbo1fl/fl;CreER mice when each Hbo1fl/fl;CreER mouse reached the ethical endpoint. (B) Kaplan-Meier survival curve after CreER-mediated Hbo1 deletion; representative sections from n = 7 animals per genotype examined. (C) Hematoxylin- and eosin-stained sternum sections displaying the bone marrow (n = 7 animals per genotype). (D) Peripheral blood analysis results (n = 7 animals per genotype). (E) Representative FACS plots of LSK cells and HSCSLAM, MPPSLAM, and progenitor cells in the bone marrow of Hbo1fl/+;CreER and Hbo1fl/fl;CreER mice (n = 7 animals per genotype); percentage of viable cells indicated. Data are displayed as mean ± standard error of the mean (SEM) and were analyzed using a 2-tailed Student t test. Detailed flow cytometry gating strategies are displayed in supplemental Figure 1. HCT, hematocrit; HGB, hemoglobin; RBC, red blood cell count; WBC, white blood cell count.
Hbo1 deletion causes hematopoietic failure and death. (A) PCR genotyping (wild-type [WT] Hbo1 allele product 190 bases; floxed Hbo1 allele 283 bases; deleted Hbo1 allele 358 bases24) showing Rosa26-CreERT2 (CreER)-mediated Hbo1 deletion in bone marrow from Hbo1fl/+;CreER and Hbo1fl/fl;CreER mice (n = 7 animals per genotype) treated 3× with tamoxifen (150 mg/kg body weight [BW] per dose, doses 48 hours apart). Samples were collected from 1 pair of age- and gender-matched Hbo1fl/+;CreER and Hbo1fl/fl;CreER mice when each Hbo1fl/fl;CreER mouse reached the ethical endpoint. (B) Kaplan-Meier survival curve after CreER-mediated Hbo1 deletion; representative sections from n = 7 animals per genotype examined. (C) Hematoxylin- and eosin-stained sternum sections displaying the bone marrow (n = 7 animals per genotype). (D) Peripheral blood analysis results (n = 7 animals per genotype). (E) Representative FACS plots of LSK cells and HSCSLAM, MPPSLAM, and progenitor cells in the bone marrow of Hbo1fl/+;CreER and Hbo1fl/fl;CreER mice (n = 7 animals per genotype); percentage of viable cells indicated. Data are displayed as mean ± standard error of the mean (SEM) and were analyzed using a 2-tailed Student t test. Detailed flow cytometry gating strategies are displayed in supplemental Figure 1. HCT, hematocrit; HGB, hemoglobin; RBC, red blood cell count; WBC, white blood cell count.
Loss of HBO1 causes a rapid decline in hematopoietic stem and progenitor cells (HSPCs) before defects are observed in the peripheral blood
We used 2 methods to assess HSCs in detail: the HSCSLAM population42 (lineage−, cKIT+, SCA1+, CD150+, CD48− = LSK.CD150+CD48−) and the double-negative HSC population (HSCDN = LSK.CD34−FLT3−43,,-46 ; detailed gating strategy in supplemental Figure 1).
Three days after commencing the induction of Hbo1 deletion with tamoxifen, CD34 and FLT3 double-negative HSCDN, short-term repopulating HSC (ST-HSCs: LSK.CD34+FLT3−), hematopoietic progenitor cells 1 and 2 (HPC1: LSK.CD150−CD48+; HPC2: LSK.CD150+CD48+), and cKIT+SCA1− progenitor cells were significantly reduced in the Hbo1fl/fl;CreER bone marrow compared with Hbo1fl/+;CreER controls (eg, threefold HSCDN and twofold reduced progenitor cell number; Figure 2A). In contrast, bone marrow cellularity and numbers of CD150+CD48− HSCSLAM and multipotent progenitors (MPP: LSK.CD34+FLT3+; MPPSLAM: LSK.CD150−CD48−) were not affected at this early time point (Figure 2A). Likewise, none of the peripheral blood parameters measured were different between genotypes (Figure 2B).
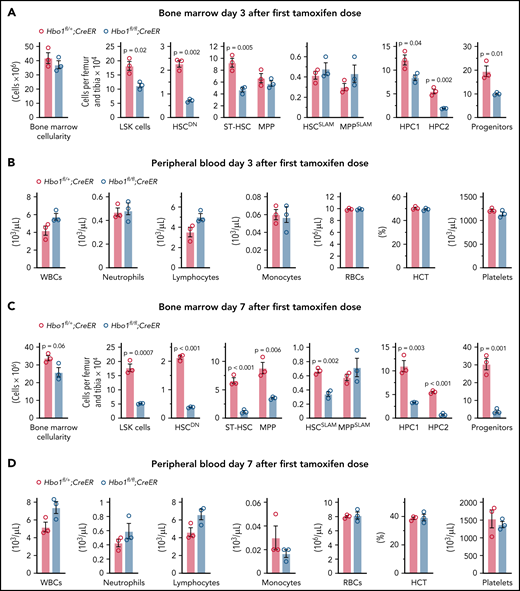
Hbo1 deletion causes a marked reduction in HSCs and progenitor cells, whereas peripheral white blood cell counts are still normal.Hbo1fl/+;CreER and Hbo1fl/fl;CreER mice (n = 3 animals per genotype) were gavaged 3× with tamoxifen (150 mg/kg BW per dose, doses 24 hours apart for the 3 day collection or 48 hours apart for the 7 day collection). Bone marrow was collected 3 days (A-B) or 7 days (C-D) after the first tamoxifen treatment. (A,C) Bone marrow stem cell and progenitor subtypes as indicated and assessed by flow cytometry. (B,D) Peripheral blood analysis (Advia). Data are displayed as mean ± SEM and were analyzed using a 2-tailed Student t test. Detailed flow cytometry gating strategies are displayed in supplemental Figure 1. Results using a different cre-recombinase transgene, Mx1-Cre, are displayed in supplemental Figure 3.
Hbo1 deletion causes a marked reduction in HSCs and progenitor cells, whereas peripheral white blood cell counts are still normal.Hbo1fl/+;CreER and Hbo1fl/fl;CreER mice (n = 3 animals per genotype) were gavaged 3× with tamoxifen (150 mg/kg BW per dose, doses 24 hours apart for the 3 day collection or 48 hours apart for the 7 day collection). Bone marrow was collected 3 days (A-B) or 7 days (C-D) after the first tamoxifen treatment. (A,C) Bone marrow stem cell and progenitor subtypes as indicated and assessed by flow cytometry. (B,D) Peripheral blood analysis (Advia). Data are displayed as mean ± SEM and were analyzed using a 2-tailed Student t test. Detailed flow cytometry gating strategies are displayed in supplemental Figure 1. Results using a different cre-recombinase transgene, Mx1-Cre, are displayed in supplemental Figure 3.
Seven days after induction of Hbo1 deletion with tamoxifen, all stem and progenitor cell populations (excepting the MPPSLAM cells) were significantly reduced between two- and sixfold; HSCDN and HSCSLAM numbers were reduced by 82% and 49%, respectively (Figure 2C). In contrast, peripheral blood parameters remained similar between genotypes (Figure 2D). Poly(I:C)/Mx1Cre-mediated deletion of Hbo1 also resulted in a reduction in HSCDN, HSCSLAM, HPC2, and cKIT+SCA1− progenitor cells 7 days after treatment (supplemental Figure 2). Apart from overlapping effects on these cell populations, differences were observed in the effects of Mx1Cre-mediated deletion of Hbo1 compared with CreER-mediated deletion, including a reduction in peripheral white blood cell count. The differences may be due to an interaction between Hbo1 deletion and an interferon response induced by poly(I:C) (supplemental Figure 2).
HBO1 is required for the repopulation capacity of HSCs
We performed competitive transplantation experiments to test the repopulating ability of HSCs lacking HBO1. Hbo1fl/+;CreER and Hbo1fl/fl;CreER mice were injected with 3 doses of tamoxifen, and their bone marrow was transplanted 7 days after the first injection (Figure 3A). Donor cells (2 × 10⁶, CD45.2+) together with WT competitor cells (5 × 10⁵, CD45.1+) were injected into lethally irradiated recipient mice (CD45.1+). Peripheral blood was analyzed at 4, 8, 12, and 16 weeks after transplantation. As expected, Hbo1fl/+;CreER donor cells competed effectively and contributed 56% to 86% of peripheral blood cells in bone marrow chimeras 12 to 16 weeks after bone marrow transplantation (Figure 3B-C). In contrast, no contribution above background levels of Hbo1fl/fl;CreER donor cells was detected in peripheral blood 4 to 16 weeks after transplantation (0.3 ± 0.1% at 16 weeks, Figure 3B-C). There was no contribution of Hbo1fl/fl;CreER donor cells to HSPC compartments (HSCSLAM, 0.01 ± 0.01%; progenitors, 0.05 ± 0.01%, Figure 3D-E). Similar results were obtained after Mx1Cre-mediated deletion of Hbo1 (supplemental Figure 3). Heterozygous deletion of Hbo1 in Hbo1fl/+ mice using CreER did not affect the main acetylation target of HBO1, H3K14ac levels, and had no effect on the repopulation activity in competitive bone marrow transplantation assays (Figure 3B; supplemental Figure 4).
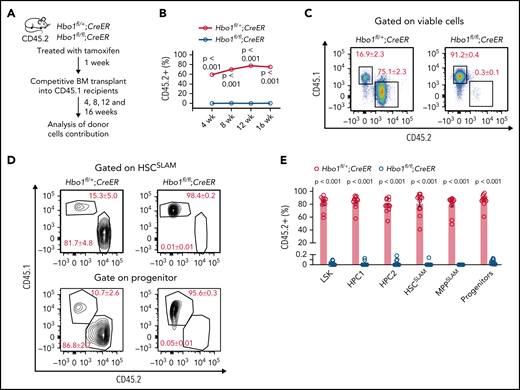
HBO1 is required for the repopulating ability of HSCs. (A-E) Two million bone marrow donor cells from Hbo1fl/+;CreER or Hbo1fl/fl;CreER mice (CD45.2+; n = 4 animals per genotype) were collected 1 week after the first dose of tamoxifen and transplanted with 0.5 million WT competitor cells (CD45.1+) into 3 lethally irradiated C57BL/6 congenic recipients (CD45.1+, 2 doses of 5.5 Gy separated by 3 hours). (A) Experimental design and timeline. (B) Percentage contribution of CD45.2+ donor cells to peripheral white blood cells over time after transplantation assessed by flow cytometry. (C) Representative FACS plots indicating contribution of competitor cells (CD45.1+) and donor cells (CD45.2+) in peripheral blood 16 weeks after bone marrow transplantation. (D-E) Representative FACS plots and enumeration of the contributions of competitor and donor cells in the HSPC compartments of the bone marrow. Percentages of parental gate are indicated on the FACS plots. Data are displayed as mean ± SEM and were analyzed using a 2-tailed Student t test. The same experiment but using the Mx1-Cre to delete Hbo1 is displayed in supplemental Figure 4.
HBO1 is required for the repopulating ability of HSCs. (A-E) Two million bone marrow donor cells from Hbo1fl/+;CreER or Hbo1fl/fl;CreER mice (CD45.2+; n = 4 animals per genotype) were collected 1 week after the first dose of tamoxifen and transplanted with 0.5 million WT competitor cells (CD45.1+) into 3 lethally irradiated C57BL/6 congenic recipients (CD45.1+, 2 doses of 5.5 Gy separated by 3 hours). (A) Experimental design and timeline. (B) Percentage contribution of CD45.2+ donor cells to peripheral white blood cells over time after transplantation assessed by flow cytometry. (C) Representative FACS plots indicating contribution of competitor cells (CD45.1+) and donor cells (CD45.2+) in peripheral blood 16 weeks after bone marrow transplantation. (D-E) Representative FACS plots and enumeration of the contributions of competitor and donor cells in the HSPC compartments of the bone marrow. Percentages of parental gate are indicated on the FACS plots. Data are displayed as mean ± SEM and were analyzed using a 2-tailed Student t test. The same experiment but using the Mx1-Cre to delete Hbo1 is displayed in supplemental Figure 4.
HBO1 is essential for the maintenance of the HSC pool
CreER or Mx1Cre transgene activation in bone marrow donor mice prior to transplantation causes Hbo1 deletion in stromal cells, which might contribute to the hematopoietic defects. To exclude this possibility, we transplanted Hbo1fl/+;CreER or Hbo1fl/fl;CreER donor cells and WT competitor cells into lethally irradiated recipients (CD45.1+; Figure 4A). Four months later, recipient mice were treated with 3 doses of tamoxifen 48 hours apart, and peripheral blood was examined at 4, 8, 12, and 16 weeks after tamoxifen treatment. Before tamoxifen-induced deletion, both Hbo1fl/+;CreER and Hbo1fl/fl;CreER donor cells (CD45.2+) reconstituted successfully and contributed ∼35% of peripheral blood cells (“Before,” Figure 4B). After tamoxifen treatment, the contribution of Hbo1fl/+;CreER cells remained at 37% to 47% (indicating heterozygous loss of Hbo1 conferred no disadvantage), whereas the contribution of Hbo1fl/fl;CreER cells in peripheral blood gradually declined to only 2.3 ± 0.3% at 16 weeks after tamoxifen treatment (Figure 4B-C). Hbo1fl/fl;CreER cells displayed a significantly reduced contribution to the HSPC compartments 16 weeks after tamoxifen treatment (HSCSLAM, 1.7 ± 0.8%; progenitors, 0.3 ± 0.2%, Figure 4D-E), showing that the role of HBO1 in the maintenance of HSC function is stem cell intrinsic, and the reduction in contribution by HBO1-deficient cells after transplantation is not due to defects in homing.

Hbo1 deletion in bone marrow chimeras causes a gradual loss of Hbo1-deleted blood cells. (A-E) One million viable bone marrow donor cells from Hbo1fl/+;CreER or Hbo1fl/fl;CreER mice (CD45.2+; n = 3 animals per genotype) were transplanted with 0.5 million WT competitor cells (CD45.1+) into lethally irradiated C57BL/6 congenic recipients (CD45.1+). Sixteen weeks later, when the bone marrow was reconstituted, mice were treated 3× with tamoxifen (150 mg/kg BW per dose, doses 48 hours apart). (A) Experimental design and timeline. (B) Percentage contributions of CD45.2+ donor cells to peripheral white blood cells over time. (C) Representative FACS plots of contribution of competitor cells (CD45.1+) and donor cells (CD45.2+) to peripheral white blood cells 16 weeks after bone marrow transplantation. (D-E) Representative FACS plots and enumeration of the contributions of competitor and donor cells in the HSPC compartments. Percentages of parental gate are indicated on the FACS plots. Data are displayed as mean ± SEM and were analyzed using a 2-tailed Student t test.
Hbo1 deletion in bone marrow chimeras causes a gradual loss of Hbo1-deleted blood cells. (A-E) One million viable bone marrow donor cells from Hbo1fl/+;CreER or Hbo1fl/fl;CreER mice (CD45.2+; n = 3 animals per genotype) were transplanted with 0.5 million WT competitor cells (CD45.1+) into lethally irradiated C57BL/6 congenic recipients (CD45.1+). Sixteen weeks later, when the bone marrow was reconstituted, mice were treated 3× with tamoxifen (150 mg/kg BW per dose, doses 48 hours apart). (A) Experimental design and timeline. (B) Percentage contributions of CD45.2+ donor cells to peripheral white blood cells over time. (C) Representative FACS plots of contribution of competitor cells (CD45.1+) and donor cells (CD45.2+) to peripheral white blood cells 16 weeks after bone marrow transplantation. (D-E) Representative FACS plots and enumeration of the contributions of competitor and donor cells in the HSPC compartments. Percentages of parental gate are indicated on the FACS plots. Data are displayed as mean ± SEM and were analyzed using a 2-tailed Student t test.
Progenitors of multiple lineages are affected by Hbo1 deletion
Poly(I:C) treated Hbo1fl/fl;Mx1Cre bone marrow cells cultured with SCF (IL-3 and erythropoietin) or with IL-3 alone formed fewer colonies than similarly treated Hbo1+/+ control cells (supplemental Figure 5).
FACS analysis of oligo-potent progenitors in bone marrow at 7 and 14 days after poly(I:C)/Mx1Cre-mediated Hbo1 deletion showed substantial reduction in the number of myeloid, lymphoid, and erythroid progenitors (supplemental Figures 6 and 7). Similarly, erythroblasts were reduced in the liver of Hbo1fl/fl;Tie2Cre embryos (supplemental Figure 8), as was thymus cellularity and T-cell progenitors in Hbo1fl/fl;Mx1Cre mice (supplemental Figure 9).
HBO 1 is required for HSC quiescence and self-renewing cell divisions
A subset of long-term repopulating HSCs are quiescent in the G0 stage of the cell cycle.2 Flow cytometric analysis revealed that numbers of HSCSLAM or HSCDN, both with long-term repopulating ability, were reduced by 49% to 82%, respectively, in Hbo1-deleted bone marrow (Figure 2C). To determine whether Hbo1 deletion affected cell cycle status of HSCs, we analyzed LSK subsets and progenitors. A lower proportion of HSCs and MPPs was found in G0 and higher proportions, approximately twofold, in S and G2-M after Mx1Cre- and CreER-mediated deletion of Hbo1 compared with control cells (Figure 5A-D; supplemental Figures 10 and 11). No increase in cell death was observed in Hbo1-deleted HSCs cells compared with control cells (supplemental Figures 10 and 11).
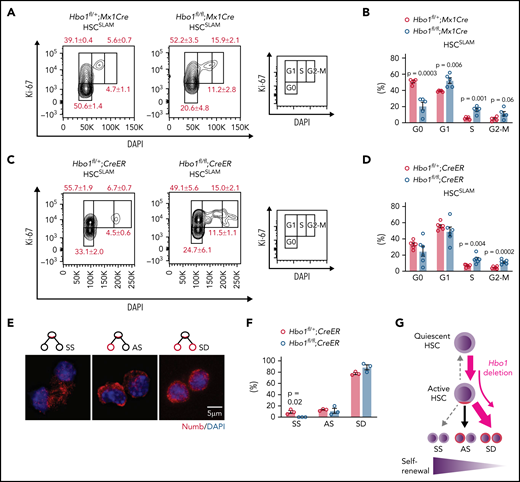
Hbo1 deleted HSCs exit quiescence and fail to undergo symmetric self-renewing divisions. (A-B) Hbo1fl/+;Mx1Cre and Hbo1fl/fl;Mx1Cre mice (n = 5 animals per genotype) were injected 3× with poly(I:C) (2.5 mg/kg BW per dose, doses 48 hours apart). Bone marrow was collected 7 days after the first poly(I:C) injection. Representative FACS plots and percentages of HSCSLAM at different stages of the cell cycle. Note the more than twofold increase in cells in S phase. (C-D) Hbo1fl/+;CreER and Hbo1fl/fl;CreER mice (n = 6 animals per genotype) were treated with tamoxifen (150 mg/kg BW per dose, doses 48 hours apart). Bone marrow was collected 7 days after the first tamoxifen dose. Representative FACS plots and percentages of HSCSLAM at different stages of the cell cycle. (E-F) Hbo1fl/+;CreER and Hbo1fl/fl;CreER mice (n = 3 animals per genotype) were treated 3× with tamoxifen (150 mg/kg BW per dose, doses 24 hours apart). LSKCD150+ cells were sorted by FACS 3 days after the first tamoxifen treatment and plated on an 8-well chamber slide coated with GFP-labeled OP9 feeder cells in StemSpan medium with SCF (30 ng/mL) and FLT3 ligand (30 ng/mL) overnight. Nocodazole (20 nM) was added after ∼16 hours. Cells were cultured for another 24 hours and then fixed and stained with antibodies to numb and GFP and counterstained with DAPI. (E) Representative of images of symmetric self-renewing (SS), asymmetric (AS), and symmetric differentiating divisions (SD) with numb (red) and DAPI (blue; GFP green, not shown). (F) Enumeration of cells with division patterns of SS, AS, or SD division in LSKCD150+ cells. (G) Model proposing HSCs lacking HBO1 exited the quiescent state through SD instead of SS division and consequently declined in numbers. Data are displayed as mean ± SEM and were analyzed using a 2-tailed Student t test.
Hbo1 deleted HSCs exit quiescence and fail to undergo symmetric self-renewing divisions. (A-B) Hbo1fl/+;Mx1Cre and Hbo1fl/fl;Mx1Cre mice (n = 5 animals per genotype) were injected 3× with poly(I:C) (2.5 mg/kg BW per dose, doses 48 hours apart). Bone marrow was collected 7 days after the first poly(I:C) injection. Representative FACS plots and percentages of HSCSLAM at different stages of the cell cycle. Note the more than twofold increase in cells in S phase. (C-D) Hbo1fl/+;CreER and Hbo1fl/fl;CreER mice (n = 6 animals per genotype) were treated with tamoxifen (150 mg/kg BW per dose, doses 48 hours apart). Bone marrow was collected 7 days after the first tamoxifen dose. Representative FACS plots and percentages of HSCSLAM at different stages of the cell cycle. (E-F) Hbo1fl/+;CreER and Hbo1fl/fl;CreER mice (n = 3 animals per genotype) were treated 3× with tamoxifen (150 mg/kg BW per dose, doses 24 hours apart). LSKCD150+ cells were sorted by FACS 3 days after the first tamoxifen treatment and plated on an 8-well chamber slide coated with GFP-labeled OP9 feeder cells in StemSpan medium with SCF (30 ng/mL) and FLT3 ligand (30 ng/mL) overnight. Nocodazole (20 nM) was added after ∼16 hours. Cells were cultured for another 24 hours and then fixed and stained with antibodies to numb and GFP and counterstained with DAPI. (E) Representative of images of symmetric self-renewing (SS), asymmetric (AS), and symmetric differentiating divisions (SD) with numb (red) and DAPI (blue; GFP green, not shown). (F) Enumeration of cells with division patterns of SS, AS, or SD division in LSKCD150+ cells. (G) Model proposing HSCs lacking HBO1 exited the quiescent state through SD instead of SS division and consequently declined in numbers. Data are displayed as mean ± SEM and were analyzed using a 2-tailed Student t test.
HSCs can undergo 3 modes of cell divisions: symmetric self-renewing yielding 2 HSC daughter cells, asymmetric yielding 1 HSC and 1 multipotent progenitor daughter cell, and symmetric differentiating yielding 2 multipotent progenitor daughter cells. The first 2 modes of cell division are crucial for the maintenance of HSCs. The 3 modes can be distinguished by the distribution and levels of the protein numb.36,47 We examined sorted Hbo1fl/+;CreER and Hbo1fl/fl;CreER LSK−CD150+ cells synchronized in mitosis using nocodazole for 24 hours and then stained for numb and scored the division patterns of cell doublets (107 control and 63 Hbo1 null, 3 mice per genotype) as symmetric self-renewal, asymmetric, or symmetric differentiating divisions (2 daughter cells; Figure 5E). We found that there was no difference in proportion of Hbo1fl/+;CreER and Hbo1fl/fl;CreER cells that underwent asymmetric division (∼12% in both groups). In contrast, although 9.4 ± 2.5% of Hbo1fl/+;CreER cells underwent symmetric self-renewal, no Hbo1fl/fl;CreER cells undergoing symmetric self-renewal were detected, suggesting that Hbo1fl/fl;CreER LSKCD150+ cells had lost the ability to undergo this mode of cell division and instead may have shifted toward symmetric differentiation (Figure 5F).
Our cell cycle analysis suggests that HBO1 is required for HSC quiescence and full self-renewal potential (Figure 5G).
HBO1 is required for the expression of HSC quiescence and self-renewal genes
HBO1 has been reported to regulate H3K14ac.24,25,31 Consistent with these previous findings, bone marrow as well as LSK cells isolated from tamoxifen-treated recipients of Hbo1fl/fl;CreER bone marrow showed a reduction in H3K14ac levels compared with control cells (Figure 6A-B; supplemental Figure 12).
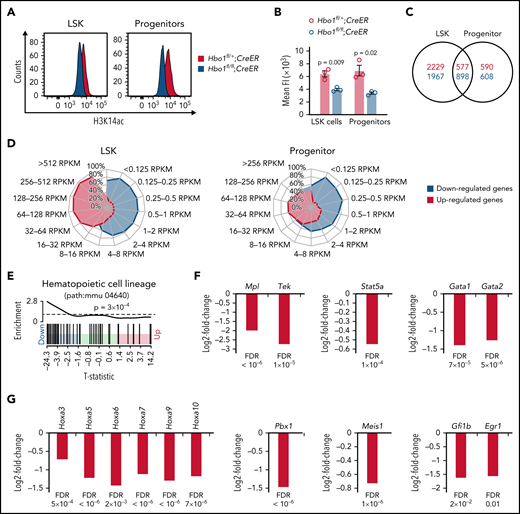
HBO1 activates genes involved in HSC quiescence and self-renewal. (A-B) H3K14ac levels in LSK and progenitor cells in Hbo1fl/+;CreER and Hbo1fl/fl;CreER mice. Mice (n = 3 per genotype) were treated 3× with tamoxifen (150 mg/kg BW per dose, doses 48 hours apart). Bone marrow was collected 7 days after the first tamoxifen treatment. LSK and progenitor cells were sorted by FACS and then fixed and stained with anti-H3K14ac antibodies detected with fluorescently coupled secondary antibodies. (A) Representative FACS plots of H3K14ac levels in LSKs and progenitor cells. Gray peak, control LSK and progenitor cells (Hbo1fl/+;CreER). Red peak, LSK and progenitor cells lacking HBO1 (Hbo1fl/fl;CreER). (B) Mean fluorescence intensity of H3K14ac levels in control and Hbo1fl/fl;CreER LSK and progenitor cells. Data are displayed as mean ± SEM and were analyzed using a Student t test. (C-G) RNA-seq results of LSK and progenitor cells. Hbo1fl/+;CreER and Hbo1fl/fl;CreER mice (n = 4 animals per genotype) were treated 3x with tamoxifen (150 mg/kg BW per dose, doses 24 hours apart). Hbo1fl/+;Mx1Cre and Hbo1fl/fl;Mx1Cre mice (n = 4 animals per genotype) were injected 3x with poly(I:C) (2.5 mg/kg BW per dose, doses 48 hours apart). To achieve a similar stage of HSCDN and progenitor reduction after Mx1Cre- and CreER-mediated Hbo1 deletion (compare Figure 2 and supplemental Figure 3), bone marrow was collected 3 days after the first tamoxifen treatment and 7 days after the first poly(I:C) injection. LSK and progenitor cells were FACS sorted. Barcoded RNA sequencing libraries were generated from RNA (50 ng) of sorted LSK cells or progenitor cells and sequenced on the Illumina HiSeq 2000 platform. Between 19 million and 43 million 80 bp paired-end reads for each sample were obtained. After individual assessment, which revealed similar results (supplemental Figure 12), sequencing data were pooled from Hbo1Mx1Cre and Hbo1CreER mice within cell type. (C) Venn diagram showing the numbers of up- (red) or downregulated genes (blue) in LSK and progenitor cells with significance corrected for multiple testing (FDR < 0.05). (D) Radar charts showing differentially expressed genes (FDR < 0.05) binned by expression levels as up- (red) or downregulated (blue) in LSK and progenitor cells. (E) Hematopoietic cell lineage signature genes (path:mmu 04640) were downregulated in Hbo1-deleted LSKs when compared with control cells (P = .0003). The horizontal axis shows t statistics for all genes in LSK cells. Black bars mark positions of genes annotated in the hematopoietic cell lineage signature. Worm shows relative enrichment of the hematopoietic cell lineage signature genes relative to uniform ordering of genes in LSK data set. (F-G) Genes encoding transcription factors and receptors crucial for HSC functions significantly reduced in Hbo1-deleted LSK cells. Data are displayed as mean ± SEM and were analyzed as stated under RNA-seq in the "Material and methods" section. FDR, false discovery rate; RPKM, reads per kilobase of transcript per million mapped reads.
HBO1 activates genes involved in HSC quiescence and self-renewal. (A-B) H3K14ac levels in LSK and progenitor cells in Hbo1fl/+;CreER and Hbo1fl/fl;CreER mice. Mice (n = 3 per genotype) were treated 3× with tamoxifen (150 mg/kg BW per dose, doses 48 hours apart). Bone marrow was collected 7 days after the first tamoxifen treatment. LSK and progenitor cells were sorted by FACS and then fixed and stained with anti-H3K14ac antibodies detected with fluorescently coupled secondary antibodies. (A) Representative FACS plots of H3K14ac levels in LSKs and progenitor cells. Gray peak, control LSK and progenitor cells (Hbo1fl/+;CreER). Red peak, LSK and progenitor cells lacking HBO1 (Hbo1fl/fl;CreER). (B) Mean fluorescence intensity of H3K14ac levels in control and Hbo1fl/fl;CreER LSK and progenitor cells. Data are displayed as mean ± SEM and were analyzed using a Student t test. (C-G) RNA-seq results of LSK and progenitor cells. Hbo1fl/+;CreER and Hbo1fl/fl;CreER mice (n = 4 animals per genotype) were treated 3x with tamoxifen (150 mg/kg BW per dose, doses 24 hours apart). Hbo1fl/+;Mx1Cre and Hbo1fl/fl;Mx1Cre mice (n = 4 animals per genotype) were injected 3x with poly(I:C) (2.5 mg/kg BW per dose, doses 48 hours apart). To achieve a similar stage of HSCDN and progenitor reduction after Mx1Cre- and CreER-mediated Hbo1 deletion (compare Figure 2 and supplemental Figure 3), bone marrow was collected 3 days after the first tamoxifen treatment and 7 days after the first poly(I:C) injection. LSK and progenitor cells were FACS sorted. Barcoded RNA sequencing libraries were generated from RNA (50 ng) of sorted LSK cells or progenitor cells and sequenced on the Illumina HiSeq 2000 platform. Between 19 million and 43 million 80 bp paired-end reads for each sample were obtained. After individual assessment, which revealed similar results (supplemental Figure 12), sequencing data were pooled from Hbo1Mx1Cre and Hbo1CreER mice within cell type. (C) Venn diagram showing the numbers of up- (red) or downregulated genes (blue) in LSK and progenitor cells with significance corrected for multiple testing (FDR < 0.05). (D) Radar charts showing differentially expressed genes (FDR < 0.05) binned by expression levels as up- (red) or downregulated (blue) in LSK and progenitor cells. (E) Hematopoietic cell lineage signature genes (path:mmu 04640) were downregulated in Hbo1-deleted LSKs when compared with control cells (P = .0003). The horizontal axis shows t statistics for all genes in LSK cells. Black bars mark positions of genes annotated in the hematopoietic cell lineage signature. Worm shows relative enrichment of the hematopoietic cell lineage signature genes relative to uniform ordering of genes in LSK data set. (F-G) Genes encoding transcription factors and receptors crucial for HSC functions significantly reduced in Hbo1-deleted LSK cells. Data are displayed as mean ± SEM and were analyzed as stated under RNA-seq in the "Material and methods" section. FDR, false discovery rate; RPKM, reads per kilobase of transcript per million mapped reads.
Because loss of a chromatin-modifying enzyme is expected to result in changes in gene expression, we performed an RNA-seq analysis to identify genes regulated by HBO1 in LSK and progenitor cells. LSK and progenitor cells were sorted by FACS from Hbo1fl/+;Mx1Cre and Hbo1fl/fl;Mx1Cre mice 7 days after poly(I:C) treatment or from Hbo1fl/+;CreER and Hbo1fl/fl;CreER 3 days after tamoxifen treatment of RNA isolation. Bar-coded sequencing libraries were generated and sequenced. The time points were chosen when animals first displayed complete or near complete Hbo1 gene deletion. Although the overall number of LSK cells was reduced at this stage after Hbo1 deletion, HSCSLAM as percentage of LSK cells had not declined (Figure 2).
Comparison of Hbo1 heterozygous controls and Hbo1 homozygous-deleted LSK or progenitor cells identified 301 to 3471 differentially expressed genes in the 4 individual data sets. Because both poly(I:C) treatment and nuclear CreER have been reported to influence gene profiles, possibly through inflammatory or DNA damage responses, respectively,48-50 we first compared the effects of HBO1 status on gene expression in LSK or progenitor cells between cells deleted using the 2 cre-recombinases (Mx1Cre and CreER) within cell types (LSK or progenitor cells; supplemental Figure 12). The gene expression changes after Mx1Cre- and CreER-mediated deletion were highly correlated (LSK cells, P < .0001; progenitors, P < .0001). Moreover, comparison of LSK profiles with previously published Gene Expression Omnibus data sets showed that the gene expression changes did not significantly correlate to an interferon or DNA damage response (data sets described in supplemental Methods section). To identify gene expression changes common to Hbo1 deletion using both cre-recombinases, we pooled the data derived from the Hbo1Mx1Cre and the Hbo1CreER samples within Hbo1 status and cell type. There were 2865 downregulated genes and 2806 upregulated genes in the LSK cell data set and 1506 downregulated genes and 1167 upregulated genes in the progenitor cell data set with transcriptome-wide significance (FDR <0.05; supplemental Figure 12). These genes included 898 downregulated genes and 577 upregulated genes that LSK and progenitor cells had in common (Figure 6C). Binning genes by absolute expression level revealed that the downregulated genes had lower expression levels than the upregulated genes in both LSK cells (down, 0.125-8 RPKM vs up, 16-512 RPKM; Figure 6D) and progenitor cells (down, ∼0.125-16 RPKM vs up, 8-256 RPKM, Figure 6D).
The top 100 genes differentially expressed in Hbo1 homozygous-deleted LSK or progenitor cells compared with controls included hematopoiesis genes such as Hoxa9, Pbx1, Mpl, Itga2b, Il11ra1, and Irf8 (top 100 differentially expressed genes, supplemental Tables 2 and 3). Analysis of the Kyoto Encyclopedia of Genes and Genomes pathways and the Molecular Signatures Database further revealed that “hematopoietic cell lineage” and “HSC signature” genes were significantly downregulated in Hbo1 homozygous-deleted LSKs (Figure 6E; supplemental Table 4). Consistent with results from these analyses, expression of the genes Gata2, Mpl, Pbx1, Meis1, and Hoxa9, as well as other HoxA cluster genes, were significantly downregulated in homozygous Hbo1-deleted LSKs when compared with control cells (Figure 6F-G, supplemental Table 5). In some cases, the effect size was substantial; for example, Tek/Tie-2 messenger RNA (mRNA) in Hbo1 homozygous-deleted LSK cells was reduced to 15% controls.
Genes moderately upregulated in homozygous Hbo1-deleted LSK included Spi1 (Pu.1), Cebpa, Gfi1, and Lyl1 (supplemental Table 5). These genes encode transcription factors that are crucial for lineage decisions and maturation.51-59 Therefore, these results reflect the tendency for more differentiating divisions in HSPCs that had lost HBO1. Consistent with this notion, pathways involved in erythroid, myeloid, and granulocyte differentiation were upregulated in Hbo1−/− progenitor cells when compared with control cells (supplemental Table 6).
To detect H3K14ac distribution, CUT&Tag was performed on Hbo1fl/fl;Mx1-Cre vs Hbo1fl/+;Mx1-Cre control LSK cells, as described,39 with D. melanogaster Schneider cell spike-in to enable detection of uniform, genome-wide changes in H3K14ac. Recovery of D. melanogaster spike-in H3K14ac CUT&Tag sequencing reads was 11-fold higher in Hbo1fl/fl;Mx1-Cre LSK cell samples than in Hbo1fl/+;Mx1-Cre control LSK cell samples, indicating a pronounced reduction in M. musculus H3K14ac CUT&Tag sequencing reads. H3K14ac read counts were moderately higher in gene bodies when compared with regions upstream of the transcription start site or downstream of the transcription end site (Figure 7A; supplemental Figure 13). Similarly, HBO1 occupancy was moderately elevated over gene bodies (supplemental Figure 13). H3K14ac level changes in Hbo1fl/fl;Mx1-Cre vs Hbo1fl/+;Mx1-Cre control LSK cells correlated positively with mRNA levels when the top 5% most strongly expressed genes and the bottom 5% lowest expressed genes are considered (Figure 7B). H3K14ac levels were reduced in Hbo1fl/fl;Mx1-Cre vs Hbo1fl/+;Mx1-Cre control LSK at almost all genes in the gene body, the promoter and post–transcription end site region (supplemental Figure 13; supplemental Table 7). Genes important for hematopoietic stem cell function that were downregulated in the absence of HBO1 (Figure 6F-G; supplemental Table 5) also showed a pronounced reduction in H3K14ac, including Mpl, Tek, Stat5, Gata1, and Gata2, Hox genes, Pbx1, Meis1, Gfb1b, and Egr1 (Figure 7C-D; supplemental Figure 14; supplemental Table 7). Conversely, house-keeping genes were relatively unaffected; interestingly, these genes had lower levels of H3K14ac initially (supplemental Figure 14). These data show that the near complete genome-wide loss of H3K14ac observed by western blot (supplemental Figure 12) reflects a loss of H3K14ac at most genes, including important hematopoietic stem cell genes.
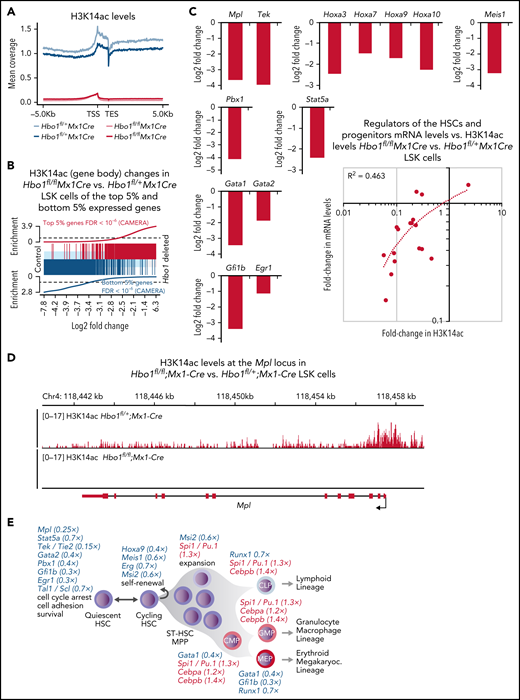
Loss of H3K14ac in the absence of HBO1 affects most genes, including important hematopoietic genes. (A-E) Levels of acetylated lysine 14 on histone H3 (H3K14ac) in Hbo1fl/fl;Mx1-Cre vs Hbo1fl/+;Mx1-Cre control LSK cells was assessed by CUT&Tag sequencing. This experiment was repeated twice. (A) H3K14ac sequencing read coverage plot of gene bodies plus or minus 5 kb in Hbo1fl/fl;Mx1-Cre vs Hbo1fl/+;Mx1-Cre control LSK cells. (B) Barcode plot depicting the correlation between the H3K14ac levels changes in the gene bodies in Hbo1fl/fl;Mx1-Cre vs Hbo1fl/+;Mx1-Cre control LSK cells (depicted by the light blue/gray/pink box) and the top 5% highest (red) and bottom 5% lowest (blue) expressed genes (depicted by the vertical lines). (C) H3K14ac levels in genes regulating hematopoietic stem cell function in Hbo1fl/fl;Mx1-Cre vs Hbo1fl/+;Mx1-Cre control LSK cells. A correlation between mRNA levels of genes depicted in panel F and the H3K14 acetylation changes at these genes. The downregulated gene expression changes shown graphically have a proportional lack of H3K14 acetylation, whereas the 3 upregulated genes are comparatively less affected. (D) Sequencing read depth plots over the Mpl gene of Hbo1fl/fl;Mx1-Cre vs Hbo1fl/+;Mx1-Cre control LSK cells corrected for D. melanogaster spike-in. One animal per genotype shown, illustrating the higher level of H3K14ac around the transcription start site and the coverage of the gene body in the control samples and the near absence of reads in the Hbo1-deleted samples. Black tracts represent control samples and gray tracts represent Hbo1-deleted samples. Supportive data shown in supplemental Figures 13 and 14 including replicate tracts of the Mpl locus and tracts of the Tek locus. (E) Consequences of loss of HBO1 on hematopoiesis. Insufficient expansion and premature differentiation of HSCs results in insufficient numbers of mature cell types. (F) Working model of HBO1 function in adult hematopoiesis. HBO1 is a major regulator for adult hematopoiesis through promoting the expression of multiple genes encoding transcription factors and receptors crucial for HSC quiescence and self-renewal. Important transcriptional and signaling regulators that are required for HSC functions are listed in a simplified schematic of adult hematopoiesis. Genes in blue are downregulated (fold-change in brackets) and genes in red are upregulated (fold-change in brackets) in Hbo1-deleted LSK cells compared with control cells. The specific functions indicated are based on published reports for Gata2,63-66Mpl,60,61Mpl, Stat5, Tek,62Hoxa9,68,69Pbx1,70Meis1,71-73Gfi1b,75Egr176 (see text for "Discussion"), as well as Tal1/Scl,77Erg,78,79Msi280; Runx1;81Spi1,51,52Gata1,82Cebpa,53 and Cebpb.83
Loss of H3K14ac in the absence of HBO1 affects most genes, including important hematopoietic genes. (A-E) Levels of acetylated lysine 14 on histone H3 (H3K14ac) in Hbo1fl/fl;Mx1-Cre vs Hbo1fl/+;Mx1-Cre control LSK cells was assessed by CUT&Tag sequencing. This experiment was repeated twice. (A) H3K14ac sequencing read coverage plot of gene bodies plus or minus 5 kb in Hbo1fl/fl;Mx1-Cre vs Hbo1fl/+;Mx1-Cre control LSK cells. (B) Barcode plot depicting the correlation between the H3K14ac levels changes in the gene bodies in Hbo1fl/fl;Mx1-Cre vs Hbo1fl/+;Mx1-Cre control LSK cells (depicted by the light blue/gray/pink box) and the top 5% highest (red) and bottom 5% lowest (blue) expressed genes (depicted by the vertical lines). (C) H3K14ac levels in genes regulating hematopoietic stem cell function in Hbo1fl/fl;Mx1-Cre vs Hbo1fl/+;Mx1-Cre control LSK cells. A correlation between mRNA levels of genes depicted in panel F and the H3K14 acetylation changes at these genes. The downregulated gene expression changes shown graphically have a proportional lack of H3K14 acetylation, whereas the 3 upregulated genes are comparatively less affected. (D) Sequencing read depth plots over the Mpl gene of Hbo1fl/fl;Mx1-Cre vs Hbo1fl/+;Mx1-Cre control LSK cells corrected for D. melanogaster spike-in. One animal per genotype shown, illustrating the higher level of H3K14ac around the transcription start site and the coverage of the gene body in the control samples and the near absence of reads in the Hbo1-deleted samples. Black tracts represent control samples and gray tracts represent Hbo1-deleted samples. Supportive data shown in supplemental Figures 13 and 14 including replicate tracts of the Mpl locus and tracts of the Tek locus. (E) Consequences of loss of HBO1 on hematopoiesis. Insufficient expansion and premature differentiation of HSCs results in insufficient numbers of mature cell types. (F) Working model of HBO1 function in adult hematopoiesis. HBO1 is a major regulator for adult hematopoiesis through promoting the expression of multiple genes encoding transcription factors and receptors crucial for HSC quiescence and self-renewal. Important transcriptional and signaling regulators that are required for HSC functions are listed in a simplified schematic of adult hematopoiesis. Genes in blue are downregulated (fold-change in brackets) and genes in red are upregulated (fold-change in brackets) in Hbo1-deleted LSK cells compared with control cells. The specific functions indicated are based on published reports for Gata2,63-66Mpl,60,61Mpl, Stat5, Tek,62Hoxa9,68,69Pbx1,70Meis1,71-73Gfi1b,75Egr176 (see text for "Discussion"), as well as Tal1/Scl,77Erg,78,79Msi280; Runx1;81Spi1,51,52Gata1,82Cebpa,53 and Cebpb.83
Discussion
In this study, we observed that the loss of HBO1 in adult mice results in hematopoietic failure due to HSC exhaustion and loss of progenitor cells. HSC loss was a result of increased recruitment into proliferation and differentiation at the expense of quiescence and self-renewal rather than cell death. The increase in HSC cycling and differentiation is possibly a response to the depletion of progenitor cells and an attempt to replenish them. Alternatively, or in addition, HBO1 may be essential for the maintenance of stem cell quiescence and self-renewal. This possibility is supported by the finding that HBO1 appears to be essential for normal levels of H3K14ac and mRNA expression of key regulatory genes that control HSC quiescence and self-renewal, including Gata2, Tal1 (Scl), Mpl, Stat5, Tek (Tie-2), and Hoxa9, Meis1, Erg, Gf1b, Msi1, respectively (Figure 7E). At the time when we recovered LSK cells after Hbo1 deletion, HSCs as percentage of LSK cells had not declined; the reduction in gene expression could not due to changes in cell composition. Our study establishes a novel and essential role for HBO1 in adult hematopoiesis, specifically in the maintenance of the stem cell state.
We found the expression of multiple genes regulating HSC function reduced after loss of HBO1. Of particular interest was the reduction in Mpl, Tek, Gata, Hox, and Hox cofactor genes. Mpl is expressed in HSCs, and MPL antibody depletion and treatment with exogenous thrombopoietin (TPO) have demonstrated their crucial role in HSC quiescence and proliferation.60,61 MPL/JAK2/STAT5/TEK signaling has been proposed to be important for maintaining HSC quiescence.62 We found mRNA levels of Mpl, Stat5, and Tek reduced in LSK cells lacking HBO1; in particular, Tek mRNA was reduced to only 15% of control levels. The transcription factor GATA2 is expressed mainly in HSPCs, and deletion of the Gata2 gene causes defects in HSPCs during development.63 Haploinsufficiency of Gata2 reduced number of LSKCD34− cells in the adult, and GATA2 is required for HSC survival,64,65 whereas overexpression of Gata2 increases HSC quiescence.66 Expression of Gata2 gene (and Gata1) was reduced 2.5-fold in LSK cells lacking HBO1, and LSKCD150+cells lacking HBO1 lost self-renewal potential. Hox genes were the only gene family that was markedly affected by loss of HBO1. We observed reduced expression of HoxA cluster genes, notably Hoxa9, but also Hoxa3, Hoxa5, Hoxa7, Hoxa10, and genes encoding the HOX co-factors, Pbx1 and Meis1. HOX proteins and their cofactors, PBX1 and MEIS1, are crucial for cell identity in embryogenesis and hematopoiesis in adult stage.67Hoxa9 deletion leads to decreased long-term repopulating ability of HSCs,68 and overexpression of Hoxa9 causes HSC expansion.69Pbx1 deletion results in progressive loss of LT-HSCs due to reduced HSC quiescence.70Meis1 deletion was reported to result in loss of HSC quiescence and repopulating ability71,72 or in a self-renewal defect.73 We speculate that the loss of expression of these key genes regulating HSC quiescence and self-renewal contributes to the stem cell failure we observe after loss of HBO1.
Our genomic analysis demonstrated that the loss of HBO1 results in loss of H3K14ac, particularly at genes required for stem cell function. Direct binding of HBO1 to Gata1, Tal1, Stat5a, and Stat5b genes has been reported in K562 human leukemia cells31 and are downregulated in our dataset. Our analysis suggests that the expression of genes required for stem cell function is dependent on raised levels of H3K14Ac at their respective loci. Relatively high levels of H3K14Ac were found at the transcription start sites of these genes, consistent with a role in promotor activity.74 Conversely, highly expressed genes (in particular, “house-keeping” genes) have lower levels of H3K14ac, possibly because the passage of RNA PolII maintains the locus in an open conformation through eviction of nucleosomes.
In conclusion, we hypothesize that HBO1, through H3K14 acetylation, functions as an activator of the network of genes that promotes HSC quiescence and self-renewal and limits differentiation. Although it is possible that the attrition of HSCs observed in the absence of HBO1 is solely due to downstream demands (progenitor depletion), the effects on the HSC transcription factor network indicate a more direct role in regulating HSC function. Our findings establish that HBO1 is essential for HSC quiescence and self-renewal during adult hematopoiesis.
Acknowledgments
The authors thank Faye Dabrowski and Leanne Johnson for expert animal care, Samantha Eccles for excellent technical assistance, Klaus Rajewsky, Pierre Chambon, and Masashi Yanagisawa for making the Mx1-Cre, Rosa26-CreERT2, and Tie2-Cre mice, respectively, available to the scientific community.
A.J.K. and Z.L.G. were supported by an Australian Government Postgraduate Award. This work was supported by the Australian National Health and Medical Research Council through Project Grant 1084248, Program Grant 1113577, and Research Fellowships 1081421 to A.K.V., 1003435 to T.T., 1058344 to W.S.A., and 1154970 to G.K.S.; by the Australian Research Council through Future Fellowship 110100891 to L.C.; through the Independent Research Institutes Infrastructure Support Scheme; and by the Victorian Government through and Operational Infrastructure Support Grant and the Walter Eliza Hall Institute.
Authorship
Contribution: Y.Y., A.J.K., Z.L.G., S.W., C.D.H., D.M., and L.D.R. conducted experiments and analyzed data; W.A. conducted the bioinformatics analysis supervised by G.K.S. and A.L.G.; S.W., D.M., W.S.A., and L.C. supervised aspects of the work; Y.Y., T.T., and A.K.V. wrote the manuscript; and T.T. and A.K.V. supervised the project.
Conflict-of-interest disclosure: The Thomas and Voss laboratories have received research funding from CTx CRC. The authors declare no competing financial interests.
Correspondence: Tim Thomas, Walter and Eliza Hall Institute of Medical Research, Melbourne, VIC 3052, Australia; e-mail: tthomas@wehi.edu.au; and Anne K. Voss, Walter and Eliza Hall Institute of Medical Research, Melbourne, VIC 3052, Australia; e-mail: avoss@wehi.edu.au.
All RNA-seq and CUT&Tag data sets have been submitted to the National Center for Biotechnology Information Gene Expression Omnibus database under accession numbers GSE185820 and GSE185820.
Requests for data sharing may be submitted to Tim Thomas (tthomas@wehi.edu.au).
The online version of this article contains a data supplement.
There is a Blood Commentary on this article in this issue.
The publication costs of this article were defrayed in part by page charge payment. Therefore, and solely to indicate this fact, this article is hereby marked “advertisement” in accordance with 18 USC section 1734.

This feature is available to Subscribers Only
Sign In or Create an Account Close Modal