

Key Points
Vecabrutinib is a novel noncovalent BTK/ITK inhibitor that is efficacious in ibrutinib-resistant C481S BTK mutants.
Single and combination treatment using vecabrutinib with venetoclax led to favorable T-cell immunomodulation.

Abstract
Covalent Bruton tyrosine kinase (BTK) inhibitors, such as ibrutinib, have proven to be highly beneficial in the treatment of chronic lymphocytic leukemia (CLL). Interestingly, the off-target inhibition of IL-2-inducible T-cell kinase (ITK) by ibrutinib may also play a role in modulating the tumor microenvironment, potentially enhancing the treatment benefit. However, resistance to covalently binding BTK inhibitors can develop as the result of a mutation in cysteine 481 of BTK (C481S), which prevents irreversible binding of the drugs. In the present study we performed preclinical characterization of vecabrutinib, a next-generation noncovalent BTK inhibitor that has ITK-inhibitory properties similar to those of ibrutinib. Unlike ibrutinib and other covalent BTK inhibitors, vecabrutinib showed retention of the inhibitory effect on C481S BTK mutants in vitro, similar to that of wild-type BTK. In the murine Eμ-TCL1 adoptive transfer model, vecabrutinib reduced tumor burden and significantly improved survival. Vecabrutinib treatment led to a decrease in CD8+ effector and memory T-cell populations, whereas the naive populations were increased. Of importance, vecabrutinib treatment significantly reduced the frequency of regulatory CD4+ T cells in vivo. Unlike ibrutinib, vecabrutinib treatment showed minimal adverse impact on the activation and proliferation of isolated T cells. Lastly, combination treatment with vecabrutinib and venetoclax augmented treatment efficacy, significantly improved survival, and led to favorable reprogramming of the microenvironment in the murine Eμ-TCL1 model. Thus, noncovalent BTK/ITK inhibitors, such as vecabrutinib, may be efficacious in C481S BTK mutant CLL while preserving the T-cell immunomodulatory function of ibrutinib.
Introduction
Treatment of chronic lymphocytic leukemia (CLL) has evolved from chemotherapy-based treatments to targeted therapy using small molecule inhibitors, achieving remarkable success, even in cases with poor-risk genetic features.1,2 Key molecular targets whose inhibition has proven clinically efficacious include Bruton tyrosine kinase (BTK) and phosphatidylinositol 3-kinase (PI3K) γ/δ isoforms in the B-cell receptor (BCR) signaling pathway and BCL2, an antiapoptotic protein that is indispensable for survival of CLL cells1,3.
BCR signaling in CLL cells drives tumor cell proliferation and survival.4,5 In CLL, BCRs undergo activation by antigen-dependent6-9 and antigen-independent (cell-autonomous)10 mechanisms. BTK plays a central role in linking BCR to downstream effectors like phospholipase C-γ2 (PLCγ2) and the NF-κB and MAPK pathways. In addition to these roles, BTK is involved in CXCR4 and Toll-like receptor signaling.1 BTK inhibitors have dramatically changed the treatment paradigms for treatment-naive11 and relapsed/refractory CLL, confirming the role of BTK in linking the BCR to different oncogenic pathways in this disease. Ibrutinib irreversibly inhibits IL-2-inducible T-cell kinase (ITK) in addition to inhibiting BTK.12 It has been reported that ITK inhibition by ibrutinib contributes to its modulation and reprogramming of the tumor microenvironment13-15 compared with non-ITK–targeting BTK inhibitors, such as acalabrutinib.16
Despite remarkable clinical success, resistance to BTK inhibitors has emerged over time in a subset of patients with CLL. Of importance, the C481S BTK mutation confers resistance by preventing the covalent binding of ibrutinib to its target cysteine 481 in BTK (C481S).17,18 Vecabrutinib (formerly known as SNS-062) is a novel highly specific next-generation noncovalent BTK inhibitor that demonstrated biochemical and cellular activity against C481S BTK mutant in vitro.19,20 In addition, vecabrutinib, like ibrutinib, is a potent ITK inhibitor. Therefore, it was of interest to determine whether it also had immunomodulatory effects similar to those of ibrutinib. Here, we report an extensive preclinical characterization of the in vitro inhibition of C481S BTK and the in vivo activity of vecabrutinib in the adoptive Eµ-TCL1 tumor transfer model. Unlike ibrutinib, vecabrutinib inhibited C481S BTK kinase, whereas, in vivo, vecabrutinib suppressed CLL in the lymphoid organs, improved survival, altered T-cell composition, and enhanced BCL2 dependency, similar to ibrutinib. Our findings indicate that noncovalent BTK/ITK inhibitors that elicit a similar microenvironmental response as ibrutinib may represent important alternative treatment options for CLL.
Materials and methods
Animal experiments
All animal experiments were performed with approval from the institutional animal welfare committee and according to regulations of the Government of Baden-Württemberg/Regional Council of Tübingen (Registration No. 1124 and 1128). Splenocytes derived from leukemic Eµ-TCL1 mice were propagated once in immunocompetent female C57BL6/J (Charles River) recipient mice by IV injection into the tail vein, as previously described.21 Splenic tumor cells isolated after a first round of transfer were retransplanted into syngeneic recipient mice. The cells were allowed to engraft for 14 days, after which the mice were randomized to treatment with the vehicle or the BTK inhibitors vecabrutinib or ibrutinib, the PI3K p110δ inhibitor PI-3065 or the BCL-2 inhibitor venetoclax, or the combination of vecabrutinib with venetoclax or PI-3065. Two different Eµ-TCL1 donor tumors were used for the single-treatment and combination-treatment experiments. To study drug efficacy and impact on the tumor microenvironment, 1 cohort from each treatment group was euthanized and analyzed after 10 days of treatment. For the survival experiments, the animals were euthanized at a humane end point approved by the institutional animal welfare committee based on disease severity, white blood cell count, changes in mobility, and signs of suffering. Nr4a1-GFP mice were housed under specific pathogen–free conditions at the central animal facility of the German Cancer Research Center.
In vivo drug treatments
Vecabrutinib was administered at 40 mg/kg by oral gavage, twice daily, in 0.5% weight-to-volume ratio (w/v) carboxymethylcellulose sodium salt and 0.1% volume-to-volume ratio (v/v) Tween 20. Ibrutinib was administered as a drinking water formulation in 1% w/v (2-hydroxypropyl)-β-cyclodextrin, at a concentration of 0.16 mg/mL, as previously described.22 Venetoclax was administered by oral gavage, at 50 mg/kg on the first day of treatment, followed by a ramp up to the full dose of 100 mg/kg once daily for subsequent treatments. Venetoclax was formulated in 10% v/v ethanol, 60% v/v Phosal 50 PG, and 30% v/v polyethylene glycol. PI-3065 was administered in 0.5% w/v methylcellulose and 0.2% v/v Tween 80, at 75 mg/kg, by oral gavage, once daily.
Flow cytometric analysis
All antibodies used for flow cytometry are listed in supplemental Table 1 (available on the Blood Web site). Surface staining was performed in phosphate-buffered saline containing 2% v/v fetal bovine serum for 30 minutes at 4°C. Intracellular staining for Ki67 was performed using an IC Fixation and Permeabilization Buffer set (eBioscience). For FOXP3 staining, FOXP3 Transcription Factor Fixation/Permeabilization buffers (eBioscience) were used as previously described.23 To analyze ERK phosphorylation following BCR stimulation, the cells were fixed with 4% v/v paraformaldehyde for 15 minutes at room temperature, followed by permeabilization with 100% methanol for 30 minutes on ice. The cells were washed and stained with ERK phosphorylation antibody. Samples were analyzed using a CytoFLEX (Beckman Coulter) or LSR Fortessa (BD) and CytExpert (version 2.2) and FlowJo v10 software. Gating strategies used for the flow cytometry analyses are outlined in supplemental Figures 1 and 2.
Further details about the materials and methods used are provided in supplemental Materials and methods.
Vecabrutinib is a potent BTK/ITK inhibitor similar to ibrutinib but also active on C481S mutant BTK
Vecabrutinib binds noncovalently in the ATP binding pocket of BTK, as demonstrated by X-ray crystallography and mass spectrometry (Figure 1A). Furthermore, vecabrutinib’s interaction with BTK is not dependent on the C481 residue of BTK for covalent bond formation, as with irreversible BTK inhibitors like ibrutinib (Figure 1B). In vitro kinase activity assays showed that the C481S mutation did not decrease sensitivity to vecabrutinib (Figure 1C), whereas sensitivity to ibrutinib (Figure 1D) and acalabrutinib (Figure 1E) was decreased by 66-fold and 168-fold, respectively (supplemental Table 5). Additional kinase activity assays showed that vecabrutinib is a highly selective BTK inhibitor (50% inhibitory concentration [IC50] = 3 nM) that also has activity against Tec family kinase members ITK (IC50 = 14 nM) and TEC (IC50 = 14 nM). Vecabrutinib inhibits only 4 other non-Tec kinases with IC50 values < 100 nM: Src family members LCK (IC50 = 8 nM), BLK (IC50 = 23 nM), SRC (IC50 = 84 nM), and NEK11 (IC50 = 90 nM). (Table 1; supplemental Table 6).
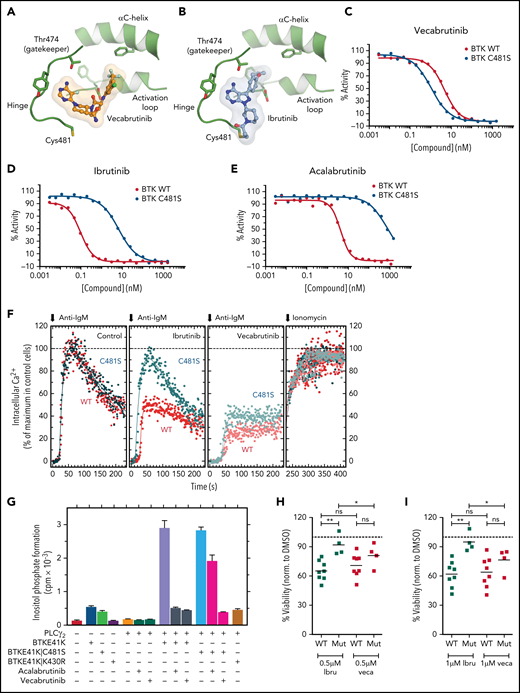
Vecabrutinib is a noncovalent BTK inhibitor that inhibits C481S mutant BTK. Crystal structure showing binding of vecabrutinib (A) and ibrutinib (B) to the active site of BTK. Inhibition of kinase activity of WT and C481S mutant BTK by vecabrutinib (C), ibrutinib (D), and acalabrutinib (E), as measured by a direct kinase assay. Data in (C) and (D) are averages of 3 biological replicates (supplemental Figure 3A-B). (F) Changes in BCR-mediated increases in cytosolic Ca2+ in BTK−/− DT40 cells reconstituted with WT or C481S mutant BTK treated with vecabrutinib or ibrutinib. (G) Changes in inositol phosphate formation in COS-7 cells coexpressing PLCγ2 and BTK E41K, its ibrutinib-resistant variant BTK E41K|C481S, or its kinase-dead variant BTK E41K|K430R, following treatment with vehicle, vecabrutinib, or acalabrutinib. Data in (F-G) are representative of 3 biological replicates. Analysis of changes in cell viability of WT BTK (n = 8) and C481S BTK mutant (n = 4) primary CLL cells, as measured by DiOC6/PI staining and flow cytometry, after 4 days of treatment with 0.5 µM (H) and 1 µM (I) ibrutinib (Ibru) or vecabrutinib (Veca). Dashed line in (H-I) indicates normalization to dimethyl sulfoxide. P values for WT BTK vs C481S BTK mutants were calculated using a Mann-Whitney U test, whereas P values for comparison of treatments between paired samples were calculated using a paired Student t test. *P ≤ .05, **P ≤ .01. Mut, mutant; ns, not significant (P > .05); WT, wild-type.
Vecabrutinib is a noncovalent BTK inhibitor that inhibits C481S mutant BTK. Crystal structure showing binding of vecabrutinib (A) and ibrutinib (B) to the active site of BTK. Inhibition of kinase activity of WT and C481S mutant BTK by vecabrutinib (C), ibrutinib (D), and acalabrutinib (E), as measured by a direct kinase assay. Data in (C) and (D) are averages of 3 biological replicates (supplemental Figure 3A-B). (F) Changes in BCR-mediated increases in cytosolic Ca2+ in BTK−/− DT40 cells reconstituted with WT or C481S mutant BTK treated with vecabrutinib or ibrutinib. (G) Changes in inositol phosphate formation in COS-7 cells coexpressing PLCγ2 and BTK E41K, its ibrutinib-resistant variant BTK E41K|C481S, or its kinase-dead variant BTK E41K|K430R, following treatment with vehicle, vecabrutinib, or acalabrutinib. Data in (F-G) are representative of 3 biological replicates. Analysis of changes in cell viability of WT BTK (n = 8) and C481S BTK mutant (n = 4) primary CLL cells, as measured by DiOC6/PI staining and flow cytometry, after 4 days of treatment with 0.5 µM (H) and 1 µM (I) ibrutinib (Ibru) or vecabrutinib (Veca). Dashed line in (H-I) indicates normalization to dimethyl sulfoxide. P values for WT BTK vs C481S BTK mutants were calculated using a Mann-Whitney U test, whereas P values for comparison of treatments between paired samples were calculated using a paired Student t test. *P ≤ .05, **P ≤ .01. Mut, mutant; ns, not significant (P > .05); WT, wild-type.
Results from kinase assay showing activity of vecabrutinib against TEC family and other kinases
| Kinases | IC50 (nM) |
|---|---|
| TEC family | |
| BTK | 3 |
| ITK | 14 |
| TEC (activated) | 14 |
| TXK | 474 |
| BMX | 224 |
| Other | |
| LCK (activated) | 8 |
| cSRC | 84 |
| BLK | 23 |
| NEK11 | 90 |
| EGFR | >6000 |
| Kinases | IC50 (nM) |
|---|---|
| TEC family | |
| BTK | 3 |
| ITK | 14 |
| TEC (activated) | 14 |
| TXK | 474 |
| BMX | 224 |
| Other | |
| LCK (activated) | 8 |
| cSRC | 84 |
| BLK | 23 |
| NEK11 | 90 |
| EGFR | >6000 |
Vecabrutinib inhibits BCR signaling mediated by C481S mutant BTK
Because vecabrutinib showed similar potency in inhibiting C481S mutant BTK and wild-type (WT) BTK in cell-free kinase assays, we characterized the activity of vecabrutinib in inhibiting BCR signaling in vitro in cells harboring the ibrutinib-resistant BTK mutation. Changes in calcium flux upon BCR stimulation resulting from treatment with BTK inhibitors were analyzed in BTK-deficient (BTK−/−) DT40 cells reconstituted with WT or C481S mutant BTK (supplemental Figure 3C). The cell surface densities of BCR in BTK−/− DT40 cells reconstituted with WT BTK or BTK C481S were very similar to the density observed for WT BTK+/+ cells (supplemental Figure 3D). Treatment with ibrutinib inhibited Ca2+ flux only in WT BTK–expressing cells, whereas vecabrutinib inhibited Ca2+ flux in WT and mutant BTK–overexpressing cells (Figure 1F).
Functional interaction between the membrane-targeted E41K variant of BTK and its immediate downstream target PLCγ2 can be directly monitored in cotransfected COS-7 cells (supplemental Figure 4A).20 In this system (Figure 1G), although expression of PLCγ2 alone had only minimal effects on inositol phosphate formation, coexpression of the enzyme with BTK E41K or the double-mutant BTK E41K|C481S led to marked enhancements of its activity (5.4-fold and 7.2-fold, respectively). This effect was strictly dependent on the tyrosine protein kinase activity of BTK E41K, because a kinase-dead variant, BTK E41K|K430R, was ineffective in this regard. Importantly, although acalabrutinib completely abrogated the increase in inositol phosphate formation caused by coexpression of PLCγ2 with BTK E41K, its inhibitory effect was much less pronounced upon its coexpression with BTK E41K|C481S. In striking contrast, vecabrutinib caused very similar and complete inhibition of increased PLCγ2 activity, regardless of whether BTK E41K or BTK E41K|C481S was used as a stimulus. Supplemental Figure 3D shows that the functional effects presented in Figure 1G are not caused by changes in mutant BTK and PLCγ2 protein expression. To validate the findings from BTK mutant cell lines, we analyzed the ex vivo response of WT BTK (n = 8) and C481S mutant BTK CLL cells (n = 4; supplemental Table 3) to vecabrutinib and ibrutinib using DiOC6/propidium iodide (PI) staining.24 Although the response of WT BTK cells was similar with both drugs, BTK mutant CLL cells showed a significantly enhanced sensitivity to vecabrutinib treatment compared with ibrutinib (Figure 1H-I). However, neither vecabrutinib nor ibrutinib inhibited BCR signaling in JEKO-1 cells overexpressing the R665W PLCγ2 mutation (supplemental Figure 5) that has been reported in patients with ibrutinib resistance.17 Thus, vecabrutinib treatment overcomes ibrutinib resistance mediated by mutation of BTK C481S but not the resistance driven by the R665W PLCγ2 mutation and, most likely, other activating PLCγ2-resistance mutations.
Vecabrutinib is efficacious in the murine Eμ-TCL1 model
To study the efficacy of vecabrutinib in vivo, syngeneic recipient mice (n = 18) were transplanted with Eµ-TCL1 tumor cells. After 14 days, mice were randomized to treatment with 40 mg/kg vecabrutinib, twice daily by oral gavage (n = 6), 30 mg/kg ibrutinib in drinking water (n = 6), or vehicle control (n = 6). Of importance, no reduction in body weight was observed in any of the groups, indicating that the treatment regimen used was not toxic (supplemental Figure 6). Differential blood count analysis after 10 days of treatment showed a significant decrease in granulocyte, lymphocyte, and monocyte counts in mice treated with vecabrutinib or ibrutinib compared with vehicle controls (Figure 2A). Of note, the platelet count was higher in mice treated with the BTK inhibitors (Figure 2B), whereas no differences in hemoglobin levels or red blood cell count were observed between the groups treated with vehicle or BTK inhibitors (Figure 2C).
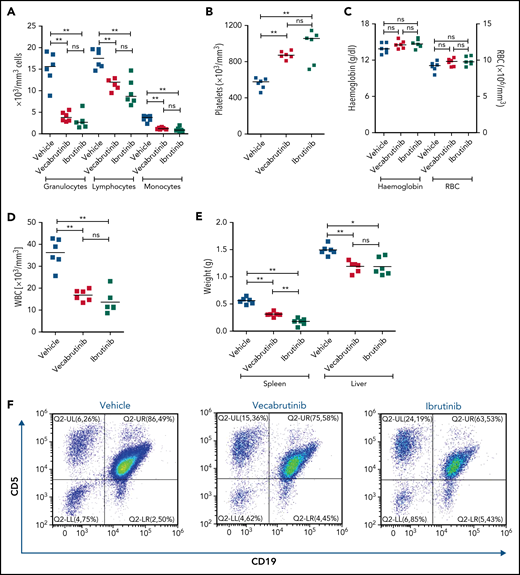
Assessments of activity relative to vehicle control following treatment with vecabrutinib or ibrutinib in the murine Eμ-TCL1 model. Differential cell counts for granulocytes, lymphocytes, and monocytes (A), platelet count (B), red blood cells (RBC) and hemoglobin levels (C), WBC count (D), and spleen and liver weights (E) upon BTK inhibitor treatment vs vehicle for 10 days. (F) Representative flow cytometry plots showing changes in the CD19+CD5+ population in spleen. (G) Change in tumor load (percentage of CD19+CD5+ cells) in blood, spleen, and bone marrow (G) and absolute number of CD19+CD5+ tumor cells per spleen (H). (I) Representative flow cytometry plots showing relative changes in Ki67-expressing tumor cells. (J) Tumor cell proliferation in blood, spleen, and bone marrow. *P ≤ .05, **P ≤ .01, Mann-Whitney U test. ns, not significant (P > .05).
Assessments of activity relative to vehicle control following treatment with vecabrutinib or ibrutinib in the murine Eμ-TCL1 model. Differential cell counts for granulocytes, lymphocytes, and monocytes (A), platelet count (B), red blood cells (RBC) and hemoglobin levels (C), WBC count (D), and spleen and liver weights (E) upon BTK inhibitor treatment vs vehicle for 10 days. (F) Representative flow cytometry plots showing changes in the CD19+CD5+ population in spleen. (G) Change in tumor load (percentage of CD19+CD5+ cells) in blood, spleen, and bone marrow (G) and absolute number of CD19+CD5+ tumor cells per spleen (H). (I) Representative flow cytometry plots showing relative changes in Ki67-expressing tumor cells. (J) Tumor cell proliferation in blood, spleen, and bone marrow. *P ≤ .05, **P ≤ .01, Mann-Whitney U test. ns, not significant (P > .05).
Treatment with vecabrutinib decreased tumor burden, as shown by a significant reduction in lymphocyte count (Figure 2A), white blood cell (WBC) count (Figure 2D), and spleen and liver weights (Figure 2E) compared with vehicle. Correspondingly, CD5+CD19+ tumor cells were decreased significantly in blood and spleen (Figure 2F-H); however, the decrease that was observed in bone marrow (Figure 2G) with vecabrutinib treatment was not statistically significant. Ki67 measurement using flow cytometry showed that, similar to ibrutinib, vecabrutinib significantly decreased tumor cell proliferation in blood and bone marrow, but the difference seen in the spleen was not statistically significant (Figure 2I-J).
Vecabrutinib treatment changes the composition of T-cell subsets in the murine Eμ-TCL1 model
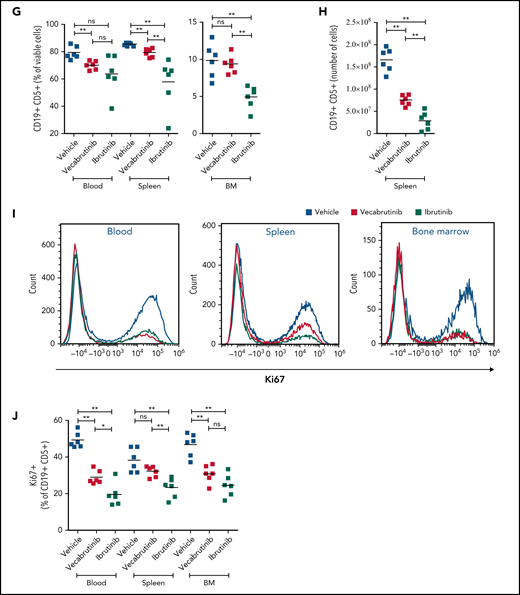
Because BTK inhibition is known to reshape the tumor microenvironment, we studied the impact of vecabrutinib on T-cell subsets in the murine Eµ-TCL1 model and compared these effects with those of ibrutinib. Data for T-cell populations in spleens are shown in Figure 3, and data for peripheral blood and bone marrow are presented in supplemental Figure 7. No difference in the percentage of CD4+ or CD8+ T cells of CD3+ T cells was observed in splenocytes from mice treated with vecabrutinib, whereas ibrutinib induced a small, but statistically significant, increase in the percentage of CD8+ cells (Figure 3A). An analysis of CD8+ T-cell subsets showed a higher frequency of CD127+CD44− naive CD8+ T cells in blood, bone marrow, and spleen (Figure 3B-C; supplemental Figure 7A-B) with vecabrutinib treatment, in bone marrow and spleen with ibrutinib treatment. CD127+CD44+ memory CD8+ T cells were decreased by both BTK inhibitors in spleen (statistically significant only with vecabrutinib treatment; Figure 3B-C) and bone marrow (supplemental Figure 7B). In addition, vecabrutinib and ibrutinib treatment resulted in significant decreases in the percentage of CD127lowCD44int-hi effector CD8+ T cells in blood, bone marrow, and spleen (Figure 3B-C; supplemental Figure 7A-B).
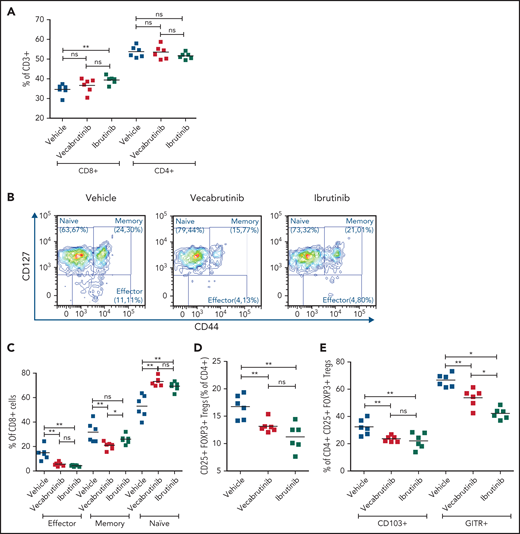
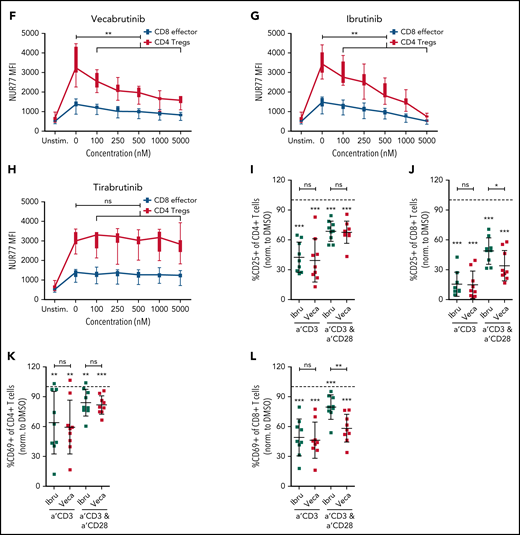
Vecabrutinib treatment alters T-cell subpopulations in the murine Eµ-TCL model. (A) Changes in relative frequencies of CD8+ and CD4+ T-cell subpopulations in spleen relative to vehicle control following 10 days of treatment with vecabrutinib or ibrutinib in the murine Eµ-TCL1 model. (B) Representative flow cytometry plots showing effector (CD8+CD127lowCD44int-hi), memory (CD8+CD44+CD127+), and naive (CD8+CD44−CD127+) T-cell populations. (C) Changes in effector, memory, and naive CD8+ T cells, (D) percentage of Tregs (CD4+CD25+FOXP3+) and (E) percentage of Tregs expressing the Treg activation markers CD103 and GITR in the different treatment groups. (F-H) Activation of the immediate early TCR gene Nur77 in effector cells (CD8+CD127lowCD44int-hi) and Tregs (CD4+CD25+FOXP3+) in splenocytes isolated from 8 recipient mice transplanted with Eµ-TCL1 tumor. The cells were treated ex vivo with increasing concentrations of vecabrutinib (F), ibrutinib (G), or tirabrutinib (H), in triplicates, followed by stimulation with anti-CD3 antibody. Changes in T-cell activation measured by relative expression of CD25 in CD4+ T cells (I) and CD8+ T cells (J) and by relative expression of CD69 in CD4+ T cells (K) and CD8+ T cells (L) upon treatment of peripheral blood mononuclear cells derived from patients with CLL with DMSO or 1 µM ibrutinib or vecabrutinib and stimulation for 6 hours using soluble anti-CD3 or anti-CD3/CD28 antibodies. Dashed lines in (I-L) denote normalization to DMSO. P values above individual columns represent comparison with DMSO. *P ≤ .05, **P ≤ .01, ***P ≤ .001, Mann-Whitney U test (A,C-H), paired Student t test (I-L). a′, anti; Ibru, ibrutinib; MFI, mean fluorescence intensity; ns, not significant (P > .05); Unstim., unstimulated; Veca, vecabrutinib.
Vecabrutinib treatment alters T-cell subpopulations in the murine Eµ-TCL model. (A) Changes in relative frequencies of CD8+ and CD4+ T-cell subpopulations in spleen relative to vehicle control following 10 days of treatment with vecabrutinib or ibrutinib in the murine Eµ-TCL1 model. (B) Representative flow cytometry plots showing effector (CD8+CD127lowCD44int-hi), memory (CD8+CD44+CD127+), and naive (CD8+CD44−CD127+) T-cell populations. (C) Changes in effector, memory, and naive CD8+ T cells, (D) percentage of Tregs (CD4+CD25+FOXP3+) and (E) percentage of Tregs expressing the Treg activation markers CD103 and GITR in the different treatment groups. (F-H) Activation of the immediate early TCR gene Nur77 in effector cells (CD8+CD127lowCD44int-hi) and Tregs (CD4+CD25+FOXP3+) in splenocytes isolated from 8 recipient mice transplanted with Eµ-TCL1 tumor. The cells were treated ex vivo with increasing concentrations of vecabrutinib (F), ibrutinib (G), or tirabrutinib (H), in triplicates, followed by stimulation with anti-CD3 antibody. Changes in T-cell activation measured by relative expression of CD25 in CD4+ T cells (I) and CD8+ T cells (J) and by relative expression of CD69 in CD4+ T cells (K) and CD8+ T cells (L) upon treatment of peripheral blood mononuclear cells derived from patients with CLL with DMSO or 1 µM ibrutinib or vecabrutinib and stimulation for 6 hours using soluble anti-CD3 or anti-CD3/CD28 antibodies. Dashed lines in (I-L) denote normalization to DMSO. P values above individual columns represent comparison with DMSO. *P ≤ .05, **P ≤ .01, ***P ≤ .001, Mann-Whitney U test (A,C-H), paired Student t test (I-L). a′, anti; Ibru, ibrutinib; MFI, mean fluorescence intensity; ns, not significant (P > .05); Unstim., unstimulated; Veca, vecabrutinib.
Analysis of CD4+ T cells showed that vecabrutinib and ibrutinib caused significant decreases in the percentage of CD4+ CD25+ FoxP3+ regulatory T cells (Tregs) in peripheral blood (supplemental Figure 7C) and spleen (Figure 3D). The decrease in Tregs was due to reduced proliferation of these cells upon exposure to the drugs, as measured by Ki67 staining (supplemental Figure 7D). Similarly to ibrutinib, vecabrutinib resulted in a significant decrease in the expression of markers associated with Treg maturation and activation, such as CD103 and GITR, in Tregs in blood and spleen compared with vehicle treatment (Figure 3E; supplemental Figure 7E). Thus, although vecabrutinib treatment did not alter the relative frequencies of CD4+ and CD8+ T cells in mice, significant changes in the subset composition of CD4+ and CD8+ T cells were observed.
Vecabrutinib inhibits T-cell activation upon stimulation with soluble anti-CD3 and anti-CD28 antibodies
Treatment of mice with vecabrutinib led to changes in the T-cell composition in the tumor microenvironment similar to ibrutinib in the Eµ-TCL1 adoptive transfer system. To determine the drug’s impact on T-cell receptor (TCR) signaling, splenocytes from 8 recipient mice, isolated 2 weeks after transplantation with Eµ-TCL1 tumors, were treated ex vivo with different doses of ibrutinib, vecabrutinib, or tirabrutinib (used as a non-ITK, BTK inhibitor), followed by TCR stimulation with soluble anti-CD3 antibody. Because TCR-β expression in splenocytes following anti-CD3 stimulation was similar in dimethyl sulfoxide (DMSO)-treated control T cells and across the different drug treatment groups, an impact of the drugs on TCR internalization was excluded (supplemental Figure 8). Intracellular flow cytometric analysis showed that a dose-dependent decrease in the expression of the immediate early gene Nur77 occurred in CD8+ effector T cells and CD4+ Tregs after treatment with vecabrutinib (Figure 3F) or ibrutinib (Figure 3G) but not tirabrutinib (Figure 3H). These findings suggest that vecabrutinib, similar to ibrutinib, impacted TCR signaling as a result of its ITK inhibitory properties.25
We further characterized the effect of vecabrutinib and ibrutinib on effector cytokine secretion upon ex vivo restimulation of T cells and observed decreased production of interleukin-2 by CD4+ T cells (supplemental Figure 9A) and interferon-γ (supplemental Figure 9B) and granzyme B (supplemental Figure 9C) by CD8+ T cells upon treatment with PMA/ionomycin. This indicates that vecabrutinib, similar to ibrutinib, limits T-cell effector function.
These findings with murine T cells were validated with samples from patients with CLL. Peripheral blood mononuclear cells from 9 patients (supplemental Table 4) were treated with 1 µM vecabrutinib, 1 µM ibrutinib, or DMSO, followed by 48 hours of stimulation with anti-CD3 antibody, alone or in combination with anti-CD28 antibody. Activation of CD4+ and CD8+ T cells, as measured by the relative expression of CD25 (Figure 3I-J) and CD69 (Figure 3K-L), was decreased significantly by treatment with ibrutinib or vecabrutinib compared with DMSO. Compared with ibrutinib, vecabrutinib resulted in a stronger inhibition of CD8+ T cells stimulated with anti-CD3 and anti-CD28 (Figure 3J,L). Thus T-cell activation by soluble anti-CD3 and anti-CD28, in the presence of tumor and antigen-presenting cells (APCs), was decreased by the BTK/ITK inhibitors ibrutinib and vecabrutinib.
Unlike ibrutinib, vecabrutinib has only minimal effects on isolated T cells
Although treatment of mononuclear cells with vecabrutinib and ibrutinib resulted in a decrease in soluble anti-CD3/CD28–mediated T-cell activation and function, we evaluated the direct impact of the inhibitors on isolated T cells. Because T cells, in the absence of APCs, cannot be activated by soluble anti-CD3/CD28, bead-bound anti-CD3/CD28 antibodies were used.26 First, T cells isolated from splenocytes of NR4A1-GFP mice27 were treated with 1 µM ibrutinib, 1 µM vecabrutinib, 1 µM tirabrutinib, or DMSO and stimulated using anti-CD3/CD28 beads. Although ibrutinib resulted in a strong decrease in TCR signaling, as measured by GFP expression, vecabrutinib and tirabrutinib had a minimal impact (Figure 4A). With regard to T-cell activation markers, ibrutinib led to a strong decrease in CD69 and CD25 expression, whereas vecabrutinib had an intermediate impact on CD25, and CD69 expression was minimally altered. Tirabrutinib, the non-ITK inhibitor, did not have any effect on T-cell activation (Figure 4B-C).
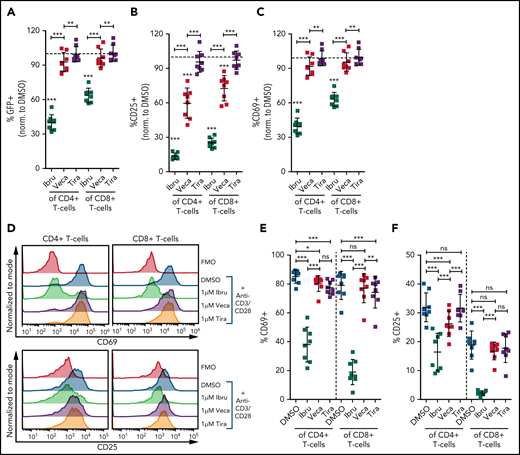
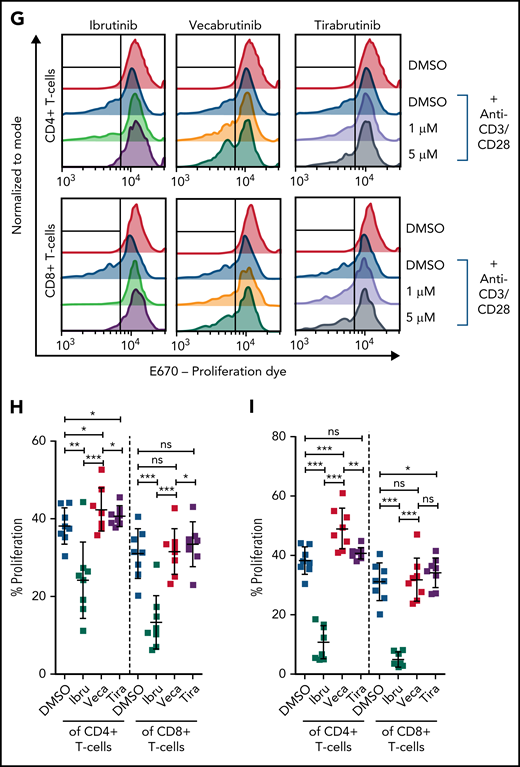
Vecabrutinib exhibits a minor impact on activation and proliferation of isolated T cells stimulated with anti-CD3 beads. Changes in TCR signaling, as measured by relative expression of GFP (A) and changes in T-cell activation, as measured by relative expression of CD25 (B) or CD69 (C) on T cells isolated from NR4A1-GFP mice treated ex vivo with DMSO or 1 µM ibrutinib, vecabrutinib, or tirabrutinib and stimulated with anti-CD3/CD28 beads for 6 hours. Dashed lines denote normalization to DMSO. P values above individual columns represent comparison with DMSO. (D) Representative flow cytometry plots for changes in T-cell activation measured by relative expression of CD69 (E) and CD25 (F) on human T cells isolated from healthy individuals treated ex vivo with DMSO or 1 µM ibrutinib, vecabrutinib, or tirabrutinib and stimulated with anti-CD3/CD28 beads for 6 hours. (G) Representative flow cytometry plot for changes in proliferation of human T cells from healthy individuals upon treatment with DMSO or 1 µM (H) or 5 µM (I) ibrutinib, vecabrutinib, or tirabrutinib and stimulation with anti-CD3/CD28 beads for 72 hours. *P ≤ .05, **P ≤ .01, ***P ≤ .001, paired Student t test. Ibru, ibrutinib; ns, not significant (P > .05); Tira, tirabrutinib; Veca, vecabrutinib.
Vecabrutinib exhibits a minor impact on activation and proliferation of isolated T cells stimulated with anti-CD3 beads. Changes in TCR signaling, as measured by relative expression of GFP (A) and changes in T-cell activation, as measured by relative expression of CD25 (B) or CD69 (C) on T cells isolated from NR4A1-GFP mice treated ex vivo with DMSO or 1 µM ibrutinib, vecabrutinib, or tirabrutinib and stimulated with anti-CD3/CD28 beads for 6 hours. Dashed lines denote normalization to DMSO. P values above individual columns represent comparison with DMSO. (D) Representative flow cytometry plots for changes in T-cell activation measured by relative expression of CD69 (E) and CD25 (F) on human T cells isolated from healthy individuals treated ex vivo with DMSO or 1 µM ibrutinib, vecabrutinib, or tirabrutinib and stimulated with anti-CD3/CD28 beads for 6 hours. (G) Representative flow cytometry plot for changes in proliferation of human T cells from healthy individuals upon treatment with DMSO or 1 µM (H) or 5 µM (I) ibrutinib, vecabrutinib, or tirabrutinib and stimulation with anti-CD3/CD28 beads for 72 hours. *P ≤ .05, **P ≤ .01, ***P ≤ .001, paired Student t test. Ibru, ibrutinib; ns, not significant (P > .05); Tira, tirabrutinib; Veca, vecabrutinib.
The findings in the murine system were validated with human T cells isolated from healthy individuals. Similar to murine T cells, ibrutinib treatment strongly reduced activation of CD4+ and CD8+ T cells, as measured by CD69 and CD25 expression. Vecabrutinib treatment at 1 and 5 µM, similar to tirabrutinib, had only a minor impact on T-cell activation (Figure 4D-F; supplemental Figure 10). Analysis of the effect of the BTK inhibitors on T-cell proliferation upon anti-CD3/CD28 stimulation for 72 hours showed a strong suppression of CD4+ and CD8+ by ibrutinib, whereas vecabrutinib and tirabrutinib treatment resulted in a significantly increased proliferation of CD4+ T cells; CD8+ T-cell proliferation remained unchanged compared with DMSO (Figure 4G-I). Thus, despite showing similar T-cell changes to ibrutinib in the tumor microenvironment, vecabrutinib showed a minimal adverse impact on activation and proliferation of T cells that may translate to a benefit in patients.
Vecabrutinib significantly increases survival in the Eμ-TCL1 adoptive transfer model and increases BCL2 dependency in human CLL cells
The impact of vecabrutinib on survival was studied in the Eµ-TCL1 adoptive transfer model. A surrogate humane end point, as defined in “Materials and methods,” was used for the experiment. Of note, a significant increase in survival was observed in mice treated with vecabrutinib (median survival, 35 days) or ibrutinib (median survival, 40 days) compared with vehicle (median survival, 28 days) (Figure 5A). No difference in tumor burden, as measured by spleen weight, liver weight (supplemental Figure 11A), or WBC count (supplemental Figure 11B), was observed in mice treated with vecabrutinib or ibrutinib vs vehicle.
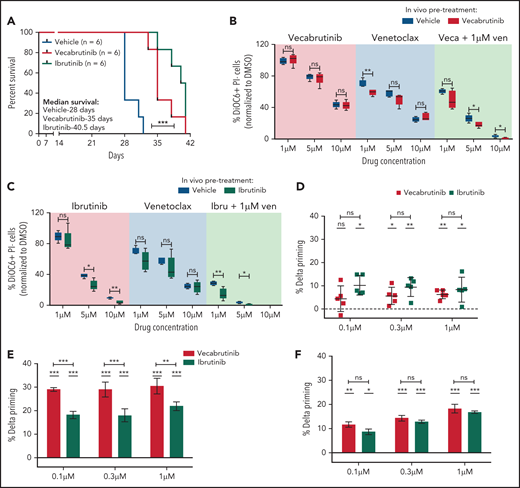
Vecabrutinib treatment prolongs survival in the Eμ-TCL1 adoptive transfer model. (A) Syngeneic recipient mice were transplanted with 5 million Eµ-TCL1 tumor cells through tail vein injection and monitored for engraftment. Treatment with vehicle (n = 6), vecabrutinib (n = 6) or ibrutinib (n = 6) was initiated on day 14 upon reaching >10% tumor load (CD19+CD5+) in peripheral blood and continued until reaching a humane end point for euthanization (described in “Materials and methods”). Comparison of responses of tumor cells isolated from vecabrutinib (Veca)-treated mice (B), ibrutinib (Ibru)-treated mice (C), or vehicle-treated mice (n = 5 per group) to treatment with venetoclax (Ven) as a single agent or in combination with the corresponding BTK inhibitors. The ex vivo treatments were performed in triplicates and analyzed using DiOC6/PI staining and flow cytometry on day 4. Dynamic BH3 profiling of WT BTK primary CLL cells (D), BTK mutant patient sample #1 (E), and BTK mutant patient sample #2 (F) (supplemental Table 3) subjected to treatment with ibrutinib (1 µM) or vecabrutinib (1 µM) for 16 hours. % Delta Priming indicates the difference in the percentage of mitochondrial cytochrome c release between the treatment and control condition in response to BAD peptide, indicating BCL-2 dependence. Each data point in (D) represents a single patient sample, whereas each data point in (E-F) represents technical replicates within individual patient samples. The dashed lines at 0 in (D-F) represent normalization to DMSO control. P values in individual columns in (D-F) represent comparison with DMSO control. *P ≤ .05, **P ≤ .01, ***P < .001, log-rank (Mantel-Cox) test (A), Mann-Whitney U test (B-C), paired Student t test (D), unpaired Student t test (E-F). ns, not significant (P > .05).
Vecabrutinib treatment prolongs survival in the Eμ-TCL1 adoptive transfer model. (A) Syngeneic recipient mice were transplanted with 5 million Eµ-TCL1 tumor cells through tail vein injection and monitored for engraftment. Treatment with vehicle (n = 6), vecabrutinib (n = 6) or ibrutinib (n = 6) was initiated on day 14 upon reaching >10% tumor load (CD19+CD5+) in peripheral blood and continued until reaching a humane end point for euthanization (described in “Materials and methods”). Comparison of responses of tumor cells isolated from vecabrutinib (Veca)-treated mice (B), ibrutinib (Ibru)-treated mice (C), or vehicle-treated mice (n = 5 per group) to treatment with venetoclax (Ven) as a single agent or in combination with the corresponding BTK inhibitors. The ex vivo treatments were performed in triplicates and analyzed using DiOC6/PI staining and flow cytometry on day 4. Dynamic BH3 profiling of WT BTK primary CLL cells (D), BTK mutant patient sample #1 (E), and BTK mutant patient sample #2 (F) (supplemental Table 3) subjected to treatment with ibrutinib (1 µM) or vecabrutinib (1 µM) for 16 hours. % Delta Priming indicates the difference in the percentage of mitochondrial cytochrome c release between the treatment and control condition in response to BAD peptide, indicating BCL-2 dependence. Each data point in (D) represents a single patient sample, whereas each data point in (E-F) represents technical replicates within individual patient samples. The dashed lines at 0 in (D-F) represent normalization to DMSO control. P values in individual columns in (D-F) represent comparison with DMSO control. *P ≤ .05, **P ≤ .01, ***P < .001, log-rank (Mantel-Cox) test (A), Mann-Whitney U test (B-C), paired Student t test (D), unpaired Student t test (E-F). ns, not significant (P > .05).
Next, we verified the susceptibility of the tumors isolated from the survival experiment to sequential treatment with the BCL2 inhibitor venetoclax. The tumors were analyzed for changes in messenger RNA expression of the pro- and antiapoptotic genes. A significant increase in Bcl2 expression was observed with BTK inhibitor treatment compared with vehicle (supplemental Figure 12A). However, protein expression did not correlate with messenger RNA expression of the different BCL2 family members analyzed (supplemental Figure 12B). Further, BH3 profiling to study apoptotic priming of the BTK inhibitor–treated murine tumors to BAD (BCL2 dependence), HRK (BCL-xl dependence), and MS1 (MCL1 dependence) peptides28 did not show any differences compared with vehicle (supplemental Figure 13A).
Although a benefit of sequential BTK inhibitor treatment with BH3 mimetics was not suggested by BH3 profiling in Eµ-TCL1 murine cells, we verified the impact of combination treatment using vecabrutinib or ibrutinib with venetoclax ex vivo in Eµ-TCL1 tumors isolated from the survival experiment. In contrast to human CLL, the murine tumor cells showed a lower response to venetoclax as a result of high MCL1 expression29 (supplemental Figure 12B). However, viability analysis by DiOC6/PI staining after 4 days of treatment showed that the activity of single-agent vecabrutinib or ibrutinib was significantly enhanced by combination treatment with venetoclax (Figure 5B-C; supplemental Figure 13B). Interestingly, the efficacy of the combination of venetoclax with a BTK inhibitor was greater in tumors isolated from vecabrutinib- or ibrutinib-treated mice (Figure 5B-C).
Because ibrutinib was shown to prime CLL cells to BCL2 dependency,30 we verified in a subset of BTK WT (n = 5) and C481S mutant BTK (n = 2) primary patient samples (supplemental Table 3) whether vecabrutinib treatment alters priming toward BCL2. Treatment with vecabrutinib for 16 hours ex vivo significantly enhanced BCL2 dependency similar to ibrutinib, as observed by exposure to 0.3 µM and 1 µM concentrations of BAD peptide (Figure 5D). Of note, vecabrutinib treatment showed a significantly increased priming to BAD, indicating BCL2 dependence in 1 C481S mutant BTK sample (Figure 5E), whereas the other sample showed similar priming as ibrutinib treatment (Figure 5F). The findings indicated that exposure to vecabrutinib may improve the response of WT BTK and mutant CLL to venetoclax in sequential and combination treatments and encouraged testing of this drug combination in vivo.
Combination treatment using vecabrutinib with venetoclax or a PI3K-δ inhibitor (PI-3065) is efficacious in vivo
In CLL therapy, combination treatments of ibrutinib with venetoclax or with a PI3K-δ inhibitor are gaining importance in patient care.31,32 Here, we examined the activity of vecabrutinib combined with venetoclax or with the PI3K-δ inhibitor PI-3065 in vivo. Because of the variable degree of sensitivity to venetoclax, a Eµ-TCL1 tumor, which is known to have the best in vivo response to venetoclax, was used. After 10 days of treatment, analysis showed that the combination of vecabrutinib with venetoclax led to a drastic reduction in spleen weight and tumor cell count in spleen compared with that of single-agent vecabrutinib or venetoclax (Figure 6A-C). In contrast, the PI3K-δ inhibitor showed high efficacy as a single agent, and no synergy was observed when combined with vecabrutinib under these experimental conditions.
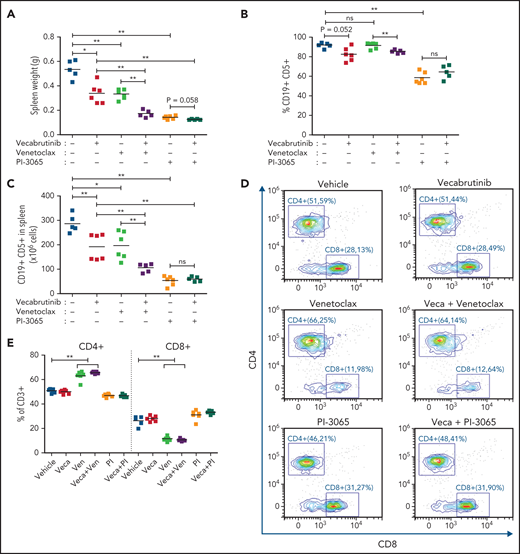
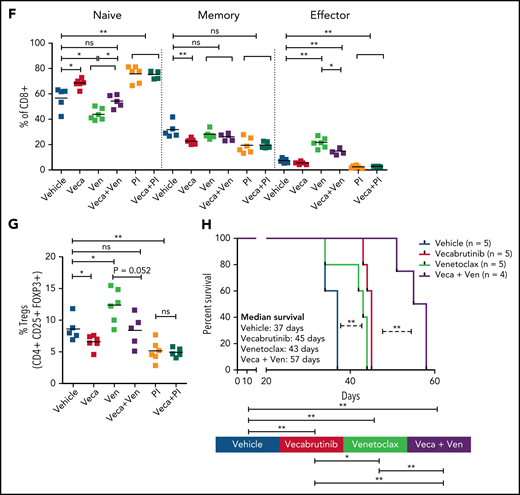
Efficacy of combination treatment with vecabrutinib and PI3K-δ inhibitor (PI-3065) or venetoclax in vivo. Syngeneic recipient mice were transplanted with 10 million Eµ-TCL1 tumor cells through tail vein injection. After engraftment for 14 days, mice were randomized to treatment with vehicle (n = 5), vecabrutinib (n = 6), PI-3065 (n = 6), venetoclax (n = 6), vecabrutinib with venetoclax (n = 5), or vecabrutinib with PI-3065 (n = 5) for 10 days. Comparison of tumor burden, as measured by spleen weights (A), percentage of CD19+CD5+ tumor cells in spleen (B), and absolute CD19+CD5+ cell count per spleen (C). (D) Representative flow cytometry plots for CD8+ and CD4+ T cells in the different treatment groups. (E) Comparison of percentage of CD4+ and CD8+ T-cell populations between the single and combination treatment subgroups. Changes in percentage of effector (CD8+CD127lowCD44int-hi), memory (CD8+CD44+CD127+), naive (CD8+CD44−CD127+) T-cell populations (F) and Tregs (CD4+ CD25+ FOXP3+) (G) upon single and combination treatment using vecabrutinib with PI3K-δ and BCL2 inhibitors. One animal each from the vehicle and the 2 combination treatment groups was excluded from the study because of low tumor engraftment resulting from technical error in IV injection. (H) Syngeneic recipient mice were transplanted with 7 million Eµ-TCL1 tumor cells through tail vein injection and monitored for engraftment. Treatment with vehicle (n = 5), vecabrutinib (n = 5), venetoclax (n = 5) or the combination of vecabrutinib and venetoclax (n = 4) was initiated on day 14 after reaching 10% tumor load (CD19+CD5+) in peripheral blood and continued until reaching a humane end point for euthanization (described in “Materials and methods”). One animal that died during the treatment procedure in the combination treatment group on day 31 with a very small spleen (0.17 g) was excluded from analysis. *P ≤ .05, **P ≤ .01, Mann-Whitney U test (A-C,E-G), log-rank (Mantel-Cox) test (H). ns, not significant (P > .05); Veca, vecabrutinib; Ven, venetoclax.
Efficacy of combination treatment with vecabrutinib and PI3K-δ inhibitor (PI-3065) or venetoclax in vivo. Syngeneic recipient mice were transplanted with 10 million Eµ-TCL1 tumor cells through tail vein injection. After engraftment for 14 days, mice were randomized to treatment with vehicle (n = 5), vecabrutinib (n = 6), PI-3065 (n = 6), venetoclax (n = 6), vecabrutinib with venetoclax (n = 5), or vecabrutinib with PI-3065 (n = 5) for 10 days. Comparison of tumor burden, as measured by spleen weights (A), percentage of CD19+CD5+ tumor cells in spleen (B), and absolute CD19+CD5+ cell count per spleen (C). (D) Representative flow cytometry plots for CD8+ and CD4+ T cells in the different treatment groups. (E) Comparison of percentage of CD4+ and CD8+ T-cell populations between the single and combination treatment subgroups. Changes in percentage of effector (CD8+CD127lowCD44int-hi), memory (CD8+CD44+CD127+), naive (CD8+CD44−CD127+) T-cell populations (F) and Tregs (CD4+ CD25+ FOXP3+) (G) upon single and combination treatment using vecabrutinib with PI3K-δ and BCL2 inhibitors. One animal each from the vehicle and the 2 combination treatment groups was excluded from the study because of low tumor engraftment resulting from technical error in IV injection. (H) Syngeneic recipient mice were transplanted with 7 million Eµ-TCL1 tumor cells through tail vein injection and monitored for engraftment. Treatment with vehicle (n = 5), vecabrutinib (n = 5), venetoclax (n = 5) or the combination of vecabrutinib and venetoclax (n = 4) was initiated on day 14 after reaching 10% tumor load (CD19+CD5+) in peripheral blood and continued until reaching a humane end point for euthanization (described in “Materials and methods”). One animal that died during the treatment procedure in the combination treatment group on day 31 with a very small spleen (0.17 g) was excluded from analysis. *P ≤ .05, **P ≤ .01, Mann-Whitney U test (A-C,E-G), log-rank (Mantel-Cox) test (H). ns, not significant (P > .05); Veca, vecabrutinib; Ven, venetoclax.
Analysis revealed a significant decrease in CD8+ T cells in mice treated with a venetoclax-containing regimen (Figure 6D-E). Analysis of the CD8+ subpopulations indicated a significant decrease in the percentage of naive CD8+ T cells in mice treated with venetoclax, which was normalized by the addition of vecabrutinib (Figure 6F). Vecabrutinib, as a single agent and in combination with PI-3065, resulted in a significant relative increase in naive CD8+ T cells. There were significant relative increases in effector CD8+ T cells with venetoclax treatment alone and in combination with vecabrutinib, in contrast to vehicle, single vecabrutinib, or PI-3065–containing treatments, suggesting that venetoclax favors antigen-experienced CD8+ T cells over naive CD8+ T cells. Interestingly, venetoclax treatment also led to a relative increase in immunosuppressive CD4+ Tregs that was normalized by the addition of vecabrutinib (Figure 6G).
To analyze the impact of combination treatment using vecabrutinib with venetoclax on survival, following engraftment, syngeneic recipient mice transplanted with a Eµ-TCL1 tumor were randomized to continuous treatment with vehicle, vecabrutinib, venetoclax, or the combination of vecabrutinib and venetoclax (n = 5 each). Treatment with vecabrutinib or venetoclax resulted in a significant increase in survival (median survival of 45 and 47 days, respectively) compared with vehicle treatment (37 days). Combination treatment using vecabrutinib with venetoclax resulted in a significant increase in survival (57 days) compared with either of the single-drug treatments (Figure 6H). Thus, the in vivo experiments demonstrated improved tumoral response, as well as favorable reprogramming of the tumor microenvironment and prolongation of survival, upon combination treatment with vecabrutinib and venetoclax.
Discussion
The BTK inhibitor ibrutinib has been very efficacious in treatment-naive patients with CLL, as well as those with relapsed/refractory disease.11,33,34 In addition to inhibiting BCR signaling in CLL cells, ibrutinib modulates T cells in the tumor microenvironment as a result of its inhibition of ITK.12,35 These immunomodulatory effects have been hypothesized to add to the clinical activity of ibrutinib16 and make it an ideal candidate for combination treatments with other immunotherapeutic agents.14,36-38 However, 1 of the unifying factors mediating resistance across different patient cohorts in CLL,17 as well as other non-Hodgkin’s lymphomas, such as marginal zone lymphoma39 and follicular lymphoma,40 is the acquired BTK C481S mutation that prevents the covalent binding of ibrutinib with BTK. Therefore, a novel strategy to treat patients with ibrutinib resistance is to use noncovalent BTK inhibitors that do not bind to cysteine 481.41,42 In contrast to other noncovalent BTK inhibitors (eg, LOXO-305,43 GDC-0853,41 ARQ-53141), vecabrutinib, similarly to ibrutinib, is a potent dual-BTK/ITK inhibitor. Thus, in the present study, vecabrutinib was used as a model to study the tumor-specific, as well as the T-cell microenvironmental, impact of noncovalent BTK/ITK inhibitors using the Eµ-TCL1 adoptive transfer mouse model.
Using a kinase activity assay, different in vitro model systems, and primary CLL patient samples, we demonstrate that vecabrutinib is potent in inhibiting cells with the C481S BTK mutation and represents an efficacious option for treating ibrutinib resistance mediated by C481S BTK mutation. However, the diminished response of PLCG2 mutants to vecabrutinib indicates that an alternative treatment with a BCL2 inhibitor may be warranted in this context. There is mounting evidence that the noncovalent BTK inhibitors are active in relapsed CLL patients with WT and mutant BTK, supporting the investigation of these noncovalent inhibitors, irrespective of BTK mutation status.44 Furthermore, vecabrutinib and LOXO-305 are highly selective and may address the intolerance to ibrutinib that can limit its use.
Human CLL cells have been shown to reprogram the T-cell microenvironment, leading to skewing toward terminally differentiated effector T cells or memory subtypes, whereas the relative frequencies of naive T-cell subpopulations are decreased.35,45 The Eµ-TCL1 adoptive transfer model shows a similar T-cell skewing and, hence, represents a suitable model for studying a drug’s impact on the microenvironment.46 However, these T-cell populations exhibit features of exhaustion, leading to defective immune surveillance and reduced elimination of the tumor cells.46 Vecabrutinib, similarly to ibrutinib,36 reversed this reprogramming and decreased the levels of immunosuppressive CD4+ Tregs, promoting reconstitution of antitumor immunity.47 Serial sampling and analysis of the T-cell subpopulations of patients treated with ibrutinib showed differences in their modulation between the early and late follow-up time points.16 Upon long-term treatment, an increase in TCRβ repertoire diversity was observed, indicating elimination of the exhausted mono/oligoclonal T cells and normalization and replenishment of the naive T-cell pool.48 Unlike human CLL, the murine adoptive transfer model with frequent high-risk aberrations, such as gain of Myc,49 has a highly proliferative disease course that presents a limited time window for treatment. Although the long-term impact of vecabrutinib is difficult to establish with the murine adoptive transfer model, the observed short-term effects reflect a similar impact on the T-cell microenvironment, as seen with ibrutinib.
Despite being a potent ITK inhibitor, vecabrutinib showed only a minor impact on the activation and proliferation of isolated T cells, which is in stark contrast to ibrutinib, indicating that the adverse effect of ibrutinib on T cells may be attributed to its broader inhibitory profile targeting several kinases.50 The decrease in TCR activation by vecabrutinib upon stimulation with soluble anti-CD3/CD28 in the presence of APCs could be ascribed to its combined inhibition of BTK in APCs and ITK in T cells. Despite the strong inhibitory effect of ibrutinib on T cells, it was shown to improve T-cell numbers and function upon long-term treatment.16,48 Treatment with more specific next-generation BTK/ITK inhibitors may further improve T-cell responses.
Single-agent treatment with ibrutinib is efficacious in different patient populations, yet an improved clinical response, complete remission, and minimum residual disease negativity are achieved upon combination with venetoclax,31 and combination treatment with ibrutinib and idelalisib was found to be promising.32,51,52 Here, combination treatment with vecabrutinib and venetoclax showed synergy in vitro and a survival benefit in vivo in the murine model. More importantly, unlike ibrutinib,30 vecabrutinib promoted BCL2 dependency in WT and C481S mutant BTK CLLs, indicating a viable combination treatment option for both CLLs.
Changes in T-cell subpopulations have been reported in human CLL upon treatment with venetoclax.53 Here, the T-cell changes induced by venetoclax were further modulated by the addition of vecabrutinib, leading to favorable changes, such as normalization of naive CD8+ T cells and a decrease in CD4+ Tregs. The relationship between BCL2 inhibition by venetoclax and changes within the T-cell compartment needs to be further clarified by analyzing cell type–specific expression of BCL2. Overall, the results show that the clinically relevant combination of vecabrutinib with venetoclax may improve efficacy by a cooperative activity of these inhibitors on the tumor cells, as well as the tumor microenvironment.
Because ITK inhibition by vecabrutinib leads to a similar T-cell microenvironment reprogramming as ibrutinib, it may represent a viable option for the treatment of chronic graft-versus-host disease,54 or long-term drug treatment may be beneficial for the generation of chimeric antigen receptor T cells, as suggested previously for ibrutinib.37 In line with a recently published study,36 the efficacy of vecabrutinib may be increased by combination with anti–PD-1/PD-L1 antibody, which may help to improve CD8+ T-cell function.
In summary, in addition to its efficacy with regard to ibrutinib-resistant C481S mutant BTK, the next-generation noncovalent BTK inhibitor vecabrutinib shows a very similar tumoral and microenvironmental response profile to that of the highly successful BTK inhibitor ibrutinib. Thus, our results highlight the relevance of noncovalent BTK inhibitors, such as vecabrutinib, as a single agent or in combination with BCL2 inhibitors, for patients whose disease is refractory to or relapses after ibrutinib treatment.
Acknowledgments
The authors thank Sandra Richter and Melanie Seepe for excellent technical support and Stig Hansen and Jeff Iwig (Carmot Therapeutics, Berkeley, CA) for the kinase-inhibition assays.
This work was supported by funding from Deutsche Forschungsgemeinschaft SFB1074, projects B1 and B6. P.M.R. is funded by a fellowship of the German Cancer Research Center Clinician Scientist Program, supported by the Dieter Morszeck Foundation. F.S. is supported by the Clinician Scientist Program from the Medical Faculty of Ulm University.
Authorship
Contribution: B.M.C.J. and S.S. designed the study and wrote the manuscript; B.M.C.J., A.M., R.P.D., S.E., P.M.R., F.S., C.W., M.W., and J.Q. designed and performed experiments, analyzed and interpreted data, and edited the manuscript; and E.T., D.M., J.A.F., K.-M.D., L.H.M., P.T., M.S., and P.G. interpreted data and edited the manuscript. All authors reviewed the manuscript.
Conflict-of-interest disclosure: J.A.F. and P.T. are employees of Sunesis Pharmaceuticals. The remaining authors declare no competing financial interests.
Correspondence: Stephan Stilgenbauer, Division of Chronic Lymphocytic Leukemia, Department of Internal Medicine III, Ulm University Medical Center, Albert-Einstein-Allee 23, 89081 Ulm, Germany; e-mail: stephan.stilgenbauer@uniklinik-ulm.de.
Requests for data sharing may be submitted to Stephan Stilgenbauer (stephan.stilgenbauer@uniklinik-ulm.de).
The online version of this article contains a data supplement.
There is a Blood Commentary on this article in this issue.
The publication costs of this article were defrayed in part by page charge payment. Therefore, and solely to indicate this fact, this article is hereby marked “advertisement” in accordance with 18 USC section 1734.

This feature is available to Subscribers Only
Sign In or Create an Account Close Modal