

Key Points
MM cells induce lipolysis in BM adipocytes.
The released FFAs are taken up by myeloma cells through fatty acid transporter proteins, leading to growth or lipotoxicity.

Abstract
Adipocytes occupy 70% of the cellular volume within the bone marrow (BM) wherein multiple myeloma (MM) originates and resides. However, the nature of the interaction between MM cells and adipocytes remains unclear. Cancer-associated adipocytes support tumor cells through various mechanisms, including metabolic reprogramming of cancer cells. We hypothesized that metabolic interactions mediate the dependence of MM cells on BM adipocytes. Here we show that BM aspirates from precursor states of MM, including monoclonal gammopathy of undetermined significance and smoldering MM, exhibit significant upregulation of adipogenic commitment compared with healthy donors. In vitro coculture assays revealed an adipocyte-induced increase in MM cell proliferation in monoclonal gammopathy of undetermined significance/smoldering MM compared with newly diagnosed MM. Using murine MM cell/BM adipocyte coculture assays, we describe MM-induced lipolysis in adipocytes via activation of the lipolysis pathway. Upregulation of fatty acid transporters 1 and 4 on MM cells mediated the uptake of secreted free fatty acids (FFAs) by adjacent MM cells. The effect of FFAs on MM cells was dose dependent and revealed increased proliferation at lower concentrations vs induction of lipotoxicity at higher concentrations. Lipotoxicity occurred via the ferroptosis pathway. Exogenous treatment with arachidonic acid, a very-long-chain FFA, in a murine plasmacytoma model displayed a reduction in tumor burden. Taken together, our data reveal a novel pathway involving MM cell–induced lipolysis in BM adipocytes and suggest prevention of FFA uptake by MM cells as a potential target for myeloma therapeutics.
Introduction
Multiple myeloma (MM) is highly dependent on the tumor microenvironment (TME). Clonal expansion of plasma cells in bone marrow (BM) is regulated by the BM TME and affects initiation, progression, survival, and evasion from therapies.1 BM adipocytes (BMAds) comprise 70% of the BM volume in a typical patient with MM, and despite being a significant part of the TME, their specific role in MM pathogenesis and progression remains largely unknown.
Cancer-associated adipocytes (CAA) have been shown to support solid tumor progression through: (1) secretion of adipokines; (2) synergistic metabolic reprogramming between cancer cells and CAA; and (3) modulation of TME such as T-cell suppression through overexpression of programmed cell death-ligand 1.2,3 High-proliferative tumor cells have enhanced metabolic demands, triggering alternative metabolic pathways, including glycolysis and fatty acid (FA) oxidation.4 Adipocytes primarily store and release free FAs (FFAs) to support local and systemic metabolic demands. CAA provide a metabolic niche for malignant cells via FFAs. Studies have shown that gonadal fat provides FFAs to leukemia stem cells and protects them from chemotherapy.5 As with CAA, BMAds have been implicated in support of BM-originating or BM-homing tumors such as metastasizing prostate and breast cancer cells, or acute myeloid leukemia (AML), via the secretion of lipid chaperone FABP4 in BMAds6,7 or by modulation of cell–cell communication proteins.8
In patients with MM, obesity-induced increases in BMAd numbers and volume are associated with an increased risk of developing myeloma.9-11 Nearly one-third of patients with monoclonal gammopathy of undetermined significance (MGUS) and MM have lipid-reactive clonal immunoglobulins,12 and obese patients with MGUS are 20% more likely to progress to MM.13 Obesity-induced deregulation of lipids14 and diet-induced obesity were found to promote a myeloma-like syndrome in mice.15 In addition, mature adipocytes confer drug resistance by protecting MM cells from chemotherapy by secretion of adipokines and activation of autophagy.16 Conversely, MM cells also reprogram BMAds (eg, by expressing factors supporting osteoclastogenesis and suppressing osteoblastogenesis, leading to increased bone lesions).17
The complex mechanisms involved in BMAd and MM cell interaction are a topic of intense investigation. In vitro cocultures have shown that pre-adipocytes promote chemotaxis in MM cells by activating Wnt signaling, whereas mature adipocytes promote MM cell proliferation by activating ERK signaling.18 In vivo studies showed that MM cells facilitate their progression by decreasing the secretion of tumor-suppressing adiponectin from BMAds.19 Here we use patient-derived cells and in vitro and in vivo models to show that MM cells induce lipolysis in BMAds and that the released FFAs are then taken up by MM cells through FA transporter proteins (FATPs). Inhibition of either BMAd lipolysis or FFA transporter into MM cells could be a potential novel strategy to prevent MM progression.
Materials and methods
Isolation of primary cells from patients with MM
BM aspirates of patients with MGUS, smoldering MM (SMM), and newly diagnosed MM (NDMM) were collected as per an approved institutional review board protocol. BM aspirates were used to isolate fat-enriched BM fraction by centrifugation and BM stromal cells (BMSCs) by adhesion to tissue culture plastic in αMEM (Corning) containing 20% fetal bovine serum. BMSC markers were confirmed by using flow cytometry for expression of CD90-BV421, CD271-FITC, CD105-FITC, CD146-PE, CD106-APC, CD29-FITC, CD49e-PE, CD44-PerCP/Cy5.5, Notch4-PE, and Notch1-APC and absence for CD45-PerCP/Cy5.5 (BioLegend).
Cell lines
OP9 (ATCC, CRL-2749), MC3T3-E1 subclone 4 (ATCC, CRL-2593), MM.1S (ATCC, CRL-2974), U266 (ATCC, TIB-196), H929 (ATCC, CRL-9068), and RPMI8226 (ATCC, CRM-CCL-155) cells were purchased from ATCC. MM cell lines OPM2, KMS12PE, INA6, and 5TGM1 were provided by collaborators as described previously.20,21 Routine cell line authentication using morphology, karyotyping, and polymerase chain reaction (PCR)-based methods was performed as per supplier guidelines. All cells were also routinely tested for Mycoplasma by using a luminescence-based assay (Lonza).
Adipogenic differentiation and coculture with myeloma cells
Patient-derived BMSCs (passage 2-4) or murine BM stromal cell line OP9 were induced to differentiate into adipocytes by adding dexamethasone (1 µM), indomethacin (0.2 mM), insulin (100 nM), and 3-isobutyl-1-methylxanthine (0.5 mM) (D4902, 17378, I9278, and I7018, respectively; MilliporeSigma) in αMEM containing 10% fetal bovine serum. After 3 days of induction, the committed pre-adipocytes were allowed to mature in αMEM 10% fetal bovine serum media supplemented with insulin (100 nM). The media were changed every 3 days.
For coculture experiments, BMSCs or OP9 cells were seeded at a per-well density of 3 × 10⁴ cells in a 12-well plate, 1.5 × 10⁴ in a 24-well plate, or 4 × 10³ in a 96-well plate and then induced to differentiate into adipocytes. MM cells were then seeded on the adipocytes at 5 × 10⁵ (per well of a 12-well plate) and 2.5 × 10⁵ (per well of a 24-well plate) in direct contact or transwells. After coculture incubations, nonadherent MM cells and adherent adipocytes were separated for further analysis.
Adipogenic differentiation was assessed by Oil Red O staining for neutral lipids after washing with phosphate-buffered saline (PBS) and fixing in 10% formalin. Staining intensity was determined by eluting the stain in 1 mL of isopropanol and measuring absorbance at 518 nM.
Cellular assays
Next, 4 × 10³ MM1.S or 5TGM1 cells were cocultured for 72 hours with OP9 or BMSC immature or mature adipocytes or MC3T3-E1 osteoblasts in 96-well plates. Cell proliferation was then assessed by using CyQUANT NF Cell Proliferation Assay (Molecular Probes) according to the manufacturer’s instructions.
Myeloma-cell induced lipolysis in adipocytes
OP9 cells were seeded at 2 × 10⁴ per well in a 96-well plate and differentiated into mature adipocytes as described earlier; 8 × 10⁴ MM cells (OPM2 and 5TGM1) were added at a 1:4 ratio and cocultured for 24 hours. The cells were then washed and incubated for 2 hours with or without isoproterenol at 37°C. The super natant from all conditions was collected and incubated for 1 hour at room temperature with the Glycerol Reaction mix from the High Sensitivity Lipolysis Assay Kit (MAK215; MilliporeSigma). Glycerol concentration was measured by fluorescence intensity using the CCR plate reader (Synergy HTX reader; BioTek).
Lipid uptake by myeloma cells
Next, 1.5 × 10⁴ 5TGM1 and OPM2 cells were cultured in an 8-well chamber slide (MilliporeSigma) in the presence of 1 µM of green fluorescent fatty acid BODIPY FL C12 and BODIPY FL C16 (D3822, D3821; Thermo Fisher Scientific) for 24 hours in culture media. MM cells were then washed twice with PBS and counterstained with 4’,6-diamidino-2-phenylindole mounting media (Vector); the fluorescent FAs were imaged by using a fluorescent microscope (Olympus IX81, cellSens Dimension software).
In some experiments, MM cell lines (OPM2 and 5TGM1) were seeded in a 96-well plate at 8 × 10⁴ per well density in serum-free media for 2 hours. After starvation, cells were treated with arachidonic acid (AA) or linoleic acid at different concentrations, and the assay was performed following the Fatty Acid Uptake Kit manufacturer’s instructions (MilliporeSigma, MAK156). Readings were taken at 0, 5, 10, 30, 60, and 120 minutes by using a BioTek Synergy plate reader.
Intercellular lipid transfer
To assess lipid transfer from adipocytes to MM cells, OP9 cells were cultured at a density of 5 × 10⁴ per well of 24-well plates and differentiated into mature adipocytes. Intracellular lipids were stained with HCS LipidTOX Deep Red neutral lipid stain (H34477; Invitrogen) 1:100 diluted in normal growth media for 30 minutes at 37°C. Then, 5 × 10⁴ MM cells (1:1 ratio) were added to the adipocytes and cocultured for 24 hours. MM cells in suspension were collected after 24 hours, and LipidTOX Deep Red signal was analyzed by using flow cytometry.
In other experiments, OP9 cells were cultured onto 8-well slides (EMD Millipore) and were differentiated into mature adipocytes as described earlier. Lipids in adipocytes were labeled with HCS LipidTOX Deep Red neutral lipid stain. After 30 minutes, extracellular LipidTOX was removed from the cells by washing thrice with 1× PBS. MM cells were then seeded on top of LipidTOX-labeled adipocytes for 24 hours.
Mouse xenograft plasmacytoma model in SCID mice
All mouse experiments were conducted per the approved Institutional Animal Care and Use Committee protocol by the Massachusetts General Hospital. Briefly, 2.5 × 10⁶ MM.1S cells were suspended in 100 μL of PBS and injected subcutaneously into the intra-scapular region of 8-week-old male CB17 SCID mice (Charles River Laboratories). Tumor growth was monitored weekly until the mass was detectable by caliper. At day 20 post–cell injection, the mice with comparable tumor mass were injected with 500 μg/g subcutaneously 2 days per week of AA or vehicle in proximity to the tumor mass. Tumor growth was monitored by using caliper measurements.
Immunohistochemistry
Tumors from the aforementioned in vivo studies were formalin fixed, paraffin embedded, and sectioned. After deparaffinization, antigen retrieval was performed by using 20 µg/mL of proteinase K for 15 minutes. Endogenous peroxidases were quenched, and slides were blocked in TNB buffer (TSA Biotin System; PerkinElmer), then stained with primary antibody (1:200) diluted in TNB for 1 hour at room temperature. Sections were then washed and incubated with appropriate horseradish peroxidase–coupled secondary antibodies; horseradish peroxidase detection was performed by using 3,3′-diaminobenzidine (Vector) for 15 to 20 seconds. Slides were counterstained with hematoxylin before mounting.
Statistical analysis
Data are presented as mean ± standard error of the mean unless stated otherwise in each figure legend. Statistical analyses were conducted by using a two-tailed Student t test (Microsoft Excel), and P < .05 was considered significant. All in vitro experiments were repeated in triplicates. For in vivo experiments, N denotes the number of animals, as indicated in each figure legend.
Results
BM stromal cells from patients with MM are predisposed to adipogenic commitment and support the proliferation of myeloma cells
BMSCs from patients with MM were characterized by flow cytometry using previously defined markers (supplemental Figure 1, available on the Blood Web site). BMSCs from MGUS/SMM patients (but not from NDMM patients) showed significantly higher expression of markers of adipogenic commitment: that is, leptin-receptor (LepR), critical for adipogenic commitment22; Pref-1, expressed in adipocyte precursors23; and Perilipin A associated with lipid droplets24 (Figure 1A-B).
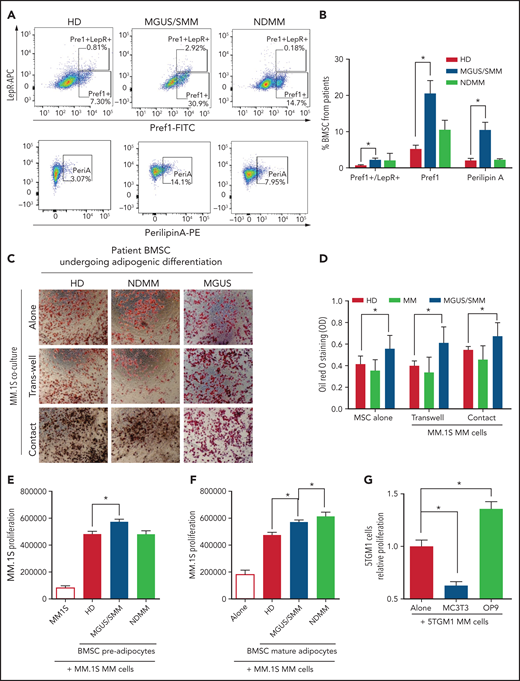
BM stromal cells of precursor stages of MM disease are more prone to differentiate into adipocytes and increase the proliferation of myeloma cells. (A) Representative fluorescence-activated cell-sorting plots of BMSCs from HD and patients with MGUS/SMM and NDMM showing increased expression of adipogenic lineage markers at baseline. (B) Quantification of panel A. (C) Representative Oil Red O staining (C) and associated quantification of neutral lipids (D) from BMSC-derived adipocytes from HD and patients with MGUS/SMM and NDMM cocultured in the presence or absence of MM.1S cells in direct contact or in transwells. (E) Proliferation of MM.1S cells cocultured in the presence of pre-adipogenic BMSCs from HD and patients with MGUS/SMM and NDMM. (F) Proliferation of MM.1S cells cocultured with mature adipocytes differentiated from BMSCs from HD and patients with MGUS/SMM and NDMM. (G) Relative proliferation of 5TGM1 cells after 72 hours of coculture with MC3T3-E1 pre-osteoblasts or OP9 pre-adipocytes. Biospecimens from MGUS and SMM from MGUS and SMM patients were analyzed independently but were pooled together for analysis purposes. All data indicate n ≥ 3; mean ± standard error of the mean. *P < .05.
BM stromal cells of precursor stages of MM disease are more prone to differentiate into adipocytes and increase the proliferation of myeloma cells. (A) Representative fluorescence-activated cell-sorting plots of BMSCs from HD and patients with MGUS/SMM and NDMM showing increased expression of adipogenic lineage markers at baseline. (B) Quantification of panel A. (C) Representative Oil Red O staining (C) and associated quantification of neutral lipids (D) from BMSC-derived adipocytes from HD and patients with MGUS/SMM and NDMM cocultured in the presence or absence of MM.1S cells in direct contact or in transwells. (E) Proliferation of MM.1S cells cocultured in the presence of pre-adipogenic BMSCs from HD and patients with MGUS/SMM and NDMM. (F) Proliferation of MM.1S cells cocultured with mature adipocytes differentiated from BMSCs from HD and patients with MGUS/SMM and NDMM. (G) Relative proliferation of 5TGM1 cells after 72 hours of coculture with MC3T3-E1 pre-osteoblasts or OP9 pre-adipocytes. Biospecimens from MGUS and SMM from MGUS and SMM patients were analyzed independently but were pooled together for analysis purposes. All data indicate n ≥ 3; mean ± standard error of the mean. *P < .05.
To evaluate the effect of MM cells on adipocyte differentiation, BMSCs from healthy donors (HD) and patients with MGUS, SMM, and NDMM were induced to differentiate into adipocytes in the presence of MM.1S cells, a human MM cell line.25 Assessment of adipocyte differentiation by using Oil Red O staining revealed that BMSCs from patients with MGUS/SMM are predisposed to increased adipogenic differentiation (Figure 1C-D). The presence of MM cells did not alter the differentiation potential of these BMSCs.
Conversely, coculture conditions exhibited increased proliferation of MM.1S cells in the presence of pre-BMAds and mature-BMAds from HD compared with MM.1S cells alone (Figure 1E-F), indicating that human adipocytes support MM growth. The pre-BMAds and mature-BMAds from MGUS/SMM and NDMM BMSCs further increased the proliferation of MM.1S cells compared with the HD group.
We further confirmed this finding using OP9 cells, a preadipose cell line derived from murine BMSCs.26 As a lineage-control in the coculture studies, murine MC3T3-E1 pre-osteoblasts were used as an adipocytic-lineage sibling of mesenchymal origin. The proliferation of 5TGM1 murine MM cells was significantly increased in the presence of OP9 adipocytes, whereas it was significantly decreased in the presence of osteoblasts (Figure 1G).
MM cells induce lipolysis in adipocytes
Interestingly, we noted that adipocytes contained smaller lipid droplets in cocultures of both human and murine MM cells (Figure 1C,G). To explore this, mature OP9 adipocytes were cocultured with 5TGM1 murine or OPM2 human MM cells for 24 hours. Our data showed a decrease in LipidTOX-stained lipid droplet size distribution compared with OP9 alone (Figure 2A-B). Given that adipocytes provide stored FA for increased local or systemic energy demands, we hypothesized that the decreased lipid droplet size was due to MM-induced lipolysis in adipocytes.
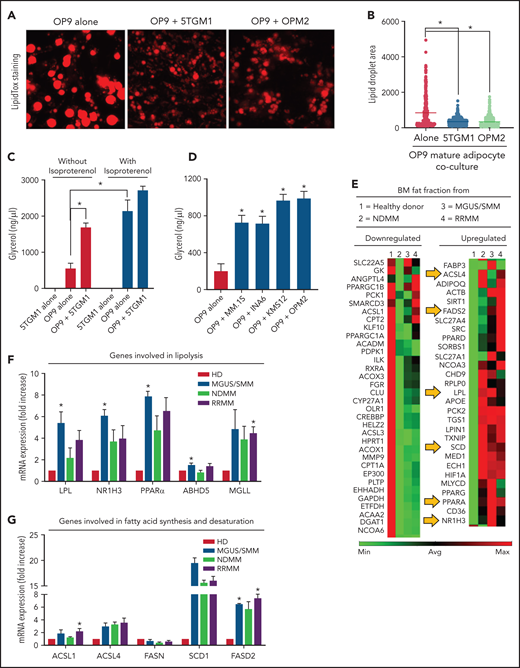
MM cells induce lipolysis in adipocytes. (A) LipidTOX-stained images of mature OP9 adipocytes alone or cocultured with 5TGM1 murine or OPM2 human MM cells. (B) Lipid droplet area was calculated by using ImageJ software (National Institutes of Health) and depicted for OP9 adipocytes alone or cultured along with 5TGM1 and OPM2 cells. (C) 5TGM1 cells were cultured alone or cocultured with OP9 adipocytes for 24 hours and were used for the detection of glycerol. Isoproterenol was used as a positive control. (D) Detection of glycerol in OP9 adipocytes cocultured with MM cell lines of human origin, including MM.1S, INA6, KMS-12, and OPM2. (E) Messenger RNA (mRNA) was isolated from the fat fractions of BM aspirates from HD and patients with MGUS/SMM, NDMM, and RRMM. Gene expression analysis was conducted by using a real-time PCR array of human peroxisome proliferator-activated receptor (PPAR) targets. Heatmap representing partial list of differentially expressed genes related to FA metabolism. mRNA expressions were quantified for genes involved in lipolysis (LPL, NR1H3, PPARα, LIPE, MGLL, PLIN1, and ABHD5) (F) and/or genes involved in FA synthesis and FA desaturation (ACSL1, ACSL4, FASN, SCD1, FASD1, and FASD2) (G) by quantitative PCR. Biospecimens from patients with MGUS and SMM were analyzed independently but were pooled together for analysis purposes. Data are presented as mean ± standard error of the mean. *P < .05.
MM cells induce lipolysis in adipocytes. (A) LipidTOX-stained images of mature OP9 adipocytes alone or cocultured with 5TGM1 murine or OPM2 human MM cells. (B) Lipid droplet area was calculated by using ImageJ software (National Institutes of Health) and depicted for OP9 adipocytes alone or cultured along with 5TGM1 and OPM2 cells. (C) 5TGM1 cells were cultured alone or cocultured with OP9 adipocytes for 24 hours and were used for the detection of glycerol. Isoproterenol was used as a positive control. (D) Detection of glycerol in OP9 adipocytes cocultured with MM cell lines of human origin, including MM.1S, INA6, KMS-12, and OPM2. (E) Messenger RNA (mRNA) was isolated from the fat fractions of BM aspirates from HD and patients with MGUS/SMM, NDMM, and RRMM. Gene expression analysis was conducted by using a real-time PCR array of human peroxisome proliferator-activated receptor (PPAR) targets. Heatmap representing partial list of differentially expressed genes related to FA metabolism. mRNA expressions were quantified for genes involved in lipolysis (LPL, NR1H3, PPARα, LIPE, MGLL, PLIN1, and ABHD5) (F) and/or genes involved in FA synthesis and FA desaturation (ACSL1, ACSL4, FASN, SCD1, FASD1, and FASD2) (G) by quantitative PCR. Biospecimens from patients with MGUS and SMM were analyzed independently but were pooled together for analysis purposes. Data are presented as mean ± standard error of the mean. *P < .05.
In the process of lipolysis, various lipase enzymes hydrolyze stored triglycerides into FFAs and glycerol. We therefore next assessed lipolysis by glycerol secretion. Our data confirmed negligible glycerol secretion in 5TGM1 cells with or without synthetic catecholamine isoproterenol, indicating a lack of triglyceride storage (Figure 2C). In contrast, mature OP9 had baseline glycerol production, which was increased fourfold after isoproterenol treatment and threefold in the presence of 5TGM1 MM cells. 5TGM1-induced lipolysis in OP9 adipocytes was further increased in the presence of isoproterenol. Coculture of OP9 adipocytes with the other most commonly used human MM cell lines, MM.1S, INA6, KMS-12, and OPM2, also increased lipolysis fourfold (Figure 2D). Taken together, these data indicate that MM cells induce lipolysis in adipocytes.
Peroxisome proliferator-activated receptor signaling is the critical regulator of proliferation, differentiation, and lipid metabolism in adipocytes. Examination of key genes involved in peroxisome proliferator-activated receptor activation and response using messenger RNA from fat fractions of MM patient BM aspirates revealed that the most upregulated genes were involved in FA degradation (lipolysis), FA synthesis, and FA desaturation27 as evaluated by Kyoto Encyclopedia of Genes and Genomes and Gene Ontology process network analysis (Figure 2E-G). NR1H3, or liver X receptor (LXR), regulates the basal lipolysis rate through the control of PLIN1 and HSL gene promoters.28 NR1H3 expression was significantly increased in the BMAds of patients with MGUS/SMM as well as in the BMAds of patients with NDMM and relapsed/refractory MM (RRMM) (Figure 2E-F). Increased lipolysis was further associated with increased FA synthesis (increased LPL, ACSL1, and ACSL4) (Figure 2F) and increased FA desaturation (SCD1 and FASD2) (Figure 2G). Our data suggest that MM patient–derived BMAds exhibit commitment to lipolysis and altered FA metabolism induced by MM cells.
MM cells take up FFAs secreted from adipocytes
Given that MM cells have negligible intracellular lipid stores (Figure 2C) compared with adipocytes, we hypothesized that FFAs released from adipocytes due to MM-induced lipolysis are taken up by MM cells for metabolic reprogramming. Murine 5TGM1 and human-derived OPM2 MM cells were exposed to fluorescently labeled FA. BODIPY FL C12 and BODIPY FL C16 are BODIPY fluorophore-labeled 12-carbon and 16-carbon long-chain fatty acids, respectively. As with natural lipids, these compounds are trafficked across the cell membrane via FA transporters. Both BODIPY FL C12 and BODIPY FL C16 were transported into OPM2 and 5TGM1 MM cells (Figure 3A), indicating that the cellular machinery for FA transport is present in MM cells.
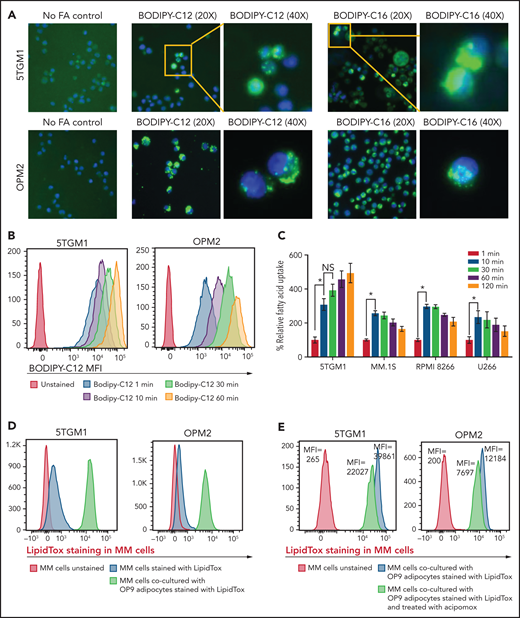
FAs secreted from adipocytes are directly taken up by myeloma cells. (A) Representative images stained by using BODIPY fluorophore-labeled 12-carbon long-chain FA and 16-carbon long-chain FA in murine 5TGM1 and human-derived OPM2 myeloma cells. (B) Flow cytometric analysis of BODIPY C12 FA uptake by 5TGM1 and OPM2 MM cells preincubated with the fluorescent dodecanoic acid FA measured at 1, 10, 30, and 60 minutes. (C) Measurement of FA uptake at 1, 10, 30, 60, and 120 minutes in MM cells using the MAK156 kit (MilliporeSigma). The kit uses a fluorescent dodecanoic FA substrate whose uptake into cells results in an increase in fluorescent intensity measured at λex = 485/λem = 515 nM. (D) Fluorescent intensity profiles of LipidTOX Deep Red–labeled lipids transferred from adipocytes to MM cells (5TGM1 and OPM2) either cultured alone or cocultured with OP9 adipocytes. (E) Reduction of labeled BODIPY C12 uptake by 5TGM1 and OPM2 MM cells through inhibition of adipocyte lipolysis by acipimox treatment. Data are presented as mean ± standard error of the mean. *P < .05.
FAs secreted from adipocytes are directly taken up by myeloma cells. (A) Representative images stained by using BODIPY fluorophore-labeled 12-carbon long-chain FA and 16-carbon long-chain FA in murine 5TGM1 and human-derived OPM2 myeloma cells. (B) Flow cytometric analysis of BODIPY C12 FA uptake by 5TGM1 and OPM2 MM cells preincubated with the fluorescent dodecanoic acid FA measured at 1, 10, 30, and 60 minutes. (C) Measurement of FA uptake at 1, 10, 30, 60, and 120 minutes in MM cells using the MAK156 kit (MilliporeSigma). The kit uses a fluorescent dodecanoic FA substrate whose uptake into cells results in an increase in fluorescent intensity measured at λex = 485/λem = 515 nM. (D) Fluorescent intensity profiles of LipidTOX Deep Red–labeled lipids transferred from adipocytes to MM cells (5TGM1 and OPM2) either cultured alone or cocultured with OP9 adipocytes. (E) Reduction of labeled BODIPY C12 uptake by 5TGM1 and OPM2 MM cells through inhibition of adipocyte lipolysis by acipimox treatment. Data are presented as mean ± standard error of the mean. *P < .05.
To assess the FA uptake rate, 5TGM1 and OPM2 cells were serum starved and then incubated with BODIPY FL C12. Flow cytometric assessment revealed a time-dependent increase in BODIPY FL C12 signal in MM cells (Figure 3B) and other commonly used human origin cells, NCI-H929, MM.1S, INA6, RPMI-8226, and U266 (supplemental Figure 2). Kinetic analysis showed rapid FA uptake in 5TGM1, MM.1S, RPMI-8266, and U266 MM cells (Figure 3C). This FA uptake was saturated within 10 minutes, suggesting that MM cells have efficient FA transporters.
We next assessed if FFAs secreted by adipocytes are directly taken up by MM cells. We tracked the transfer of LipidTOX Deep Red–labeled lipids from adipocytes to MM cells by flow cytometry. Staining of 5TGM1 and OPM2 MM cells with LipidTOX showed a modest increase in LipidTOX intensity compared with unstained cells (Figure 3D), indicating that MM cells have modest intracellular lipid depots. Coculture of unstained MM cells with the LipidTOX-labeled OP9 mature adipocytes either in suspension or an adherent state for 24 hours revealed a significant increase in LipidTOX signal in MM cells. The addition of acipimox, a small-molecule inhibitor of lipolysis,29 to LipidTOX-labeled OP9 mature cells before coculture with 5TGM1 or OPM2 MM cells decreased the LipidTOX signal in MM cells compared with untreated OP9 cells (Figure 3E). Similar results were observed with MM.1S, KMS12PE, and U266 cells (supplemental Figure 3). These data indicate that lipolysis-induced FFAs are transferred intracellularly into the MM cells and could alter the FA metabolism in MM cells. Indeed, evaluating the expression levels of 42 genes involved in FA metabolism (Kyoto Encyclopedia of Genes and Genomes Gene Set M699) in a publicly available data set (GSE13591)30 identified 10 genes whose expression levels increased with MM progression from MGUS, MM, to plasma cell leukemia (supplemental Figure 4), whereas the other genes were not changed.
Myeloma cells uptake long-chain FFAs through FATPs but not CD36
FFAs are transported into cells through FATP or CD36 receptor. Human cells have 6 FATP isoforms: FATP1 to FATP6. Flow cytometric analysis of human CD138+ cells from HD, NDMM donor, and RRMM donor, and MM cell lines (OPM2, 5TGM1, MM.1S, and KMS12PE) mostly did not show expression of CD36 (supplemental Figure 5). Analysis of congregate gene expression pattern in 21 human MM cell lines from the ONCOMINE Database showed that FATP1 and FATP4 were stably expressed in human MM cells (Figure 4A). Real-time PCR analysis of 5TGM1, OPM2, H929, and MM.1S, MM cells showed that FATP4 was consistently expressed at high levels in all cell lines (Figure 4B). In samples from patients with MM, both CD138+ MM cells and CD138– B cells expressed high levels of FATP1 and FATP4, whereas their expression was almost absent in lineage-sibling T cells (Figure 4C). The FATPs were expressed at high levels on both cell surface and within the intracellular space (Figure 4D), suggesting that FATPs are shuttled between the intracellular and cell surface locations in MM cells in response to extracellular FFAs.
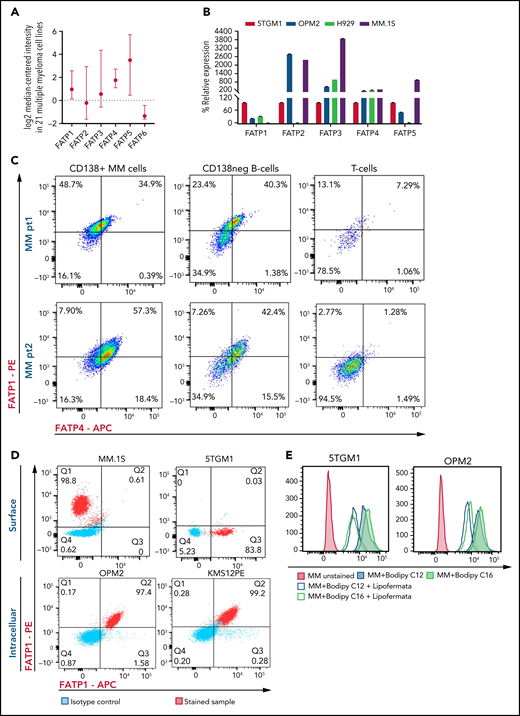
Myeloma cells uptake long-chain FFAs through FATPs. (A) Expression of FATP isoforms in human myeloma cell lines from the Cancer Cell Line Encyclopedia and the ONCOMINE resources. (B) FATP relative mRNA expression in MM cell line used in our experiments. (C) Flow cytometric profile of FATP1 and FATP4 from CD138+ cells, CD138neg B cells, and T cells in patients with NDMM and RRMM. (D) Cell surface and intracellular expression of FATP1 and FATP4 from MM.1S, 5TGM1, OPM2, and KMS12PE MM cells using flow cytometry. (E) Reduction of labeled BODIPY C12 and BODIPY C16 uptake by 5TGM1 and OPM2 MM cells through blockade of FATPs by lipofermata treatment on MM cells. Data are presented as mean ± standard error of the mean. MFI, mean fluorescence intensity.
Myeloma cells uptake long-chain FFAs through FATPs. (A) Expression of FATP isoforms in human myeloma cell lines from the Cancer Cell Line Encyclopedia and the ONCOMINE resources. (B) FATP relative mRNA expression in MM cell line used in our experiments. (C) Flow cytometric profile of FATP1 and FATP4 from CD138+ cells, CD138neg B cells, and T cells in patients with NDMM and RRMM. (D) Cell surface and intracellular expression of FATP1 and FATP4 from MM.1S, 5TGM1, OPM2, and KMS12PE MM cells using flow cytometry. (E) Reduction of labeled BODIPY C12 and BODIPY C16 uptake by 5TGM1 and OPM2 MM cells through blockade of FATPs by lipofermata treatment on MM cells. Data are presented as mean ± standard error of the mean. MFI, mean fluorescence intensity.
Low FA uptake promotes proliferation, whereas high FA uptake results in lipotoxicity, suggesting a bimodal cellular effect
The ability of MM cells to uptake FA through FATPs suggested that FA levels may be altered in the local BM TME of patients with MM. Lipidomic analysis showed significant changes in the saturated and unsaturated FAs (visual abstract). Among the various FAs, polyunsaturated fatty acids have been shown to modulate cancer risk and progression.32 Specifically, AA ω-6 polyunsaturated fatty acid, which, once released from the phospholipid cell membrane, produces multiple biologically active metabolites through cyclooxygenase, lipoxygenase (LOX), and cytochrome P450 pathways.33 AA levels were significantly decreased in BM aspirates of patients with SMM, NDMM, and RRMM compared with HD (Figure 5A). To determine the effects of AA on MM cells, 5TGM1 cells were treated with AA at increasing concentrations (0.125-100 µM). Low doses of AA (0.125-2 µM) increased the proliferation and viability of MM cells compared with vehicle control (Figure 5B-C). In contrast, high doses of AA (25-100 µM) dramatically decreased the proliferation and viability of MM cells, suggesting a bimodal cellular effect of AA on MM cells. These effects were specific to AA because linoleic acid, a precursor of AA, did not affect MM proliferation (Figure 5D) or viability (data not shown). Similar to 5TGM1 mouse cells, the human MM.1S, H929, and U266 MM cells also showed a dramatic decrease in proliferation in response to higher AA concentrations (Figure 5E). AA provides active metabolites for cellular function but can also damage cells through peroxidation by oxygen free radicals.34 Flow cytometric assessment of BODIPY-11C, a lipid peroxidation sensor, showed that AA 50 µM increased lipid peroxidation in MM cells compared with vehicle control (Figure 5F).
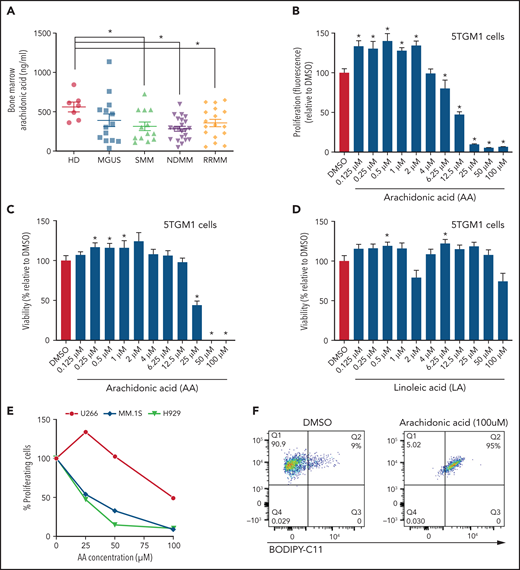
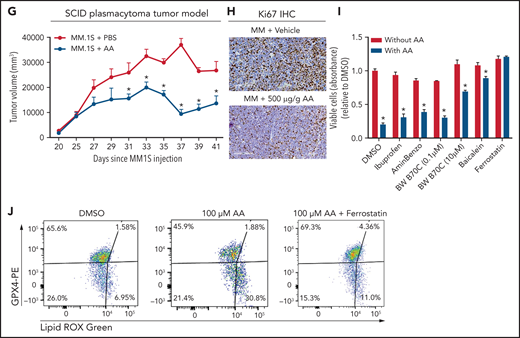
Lower FA uptake promotes proliferation, whereas higher FA uptake results in lipotoxicity through a ferroptosis pathway. (A) AA concentration (nanograms per milliliter) in BM supernatant of patients with MGUS (n = 14), SMM (n = 12), NDMM (n = 22), and RRMM (n = 17) and healthy controls (HD) (n = 7) measured by using an enzyme-linked immunosorbent assay. (B) Dose-dependent effect of AA on cell proliferation in myeloma cell line 5TGM1 quantified by CyQUANT assay after 72 hours of treatment. (C) Effect of AA on cell viability in myeloma cell line 5TGM1 assessed by CellTiter-Glo Assay after 72 hours of treatment. (D) Cell viability of 5TGM1 cells in the presence of linoleic acid assessed by Cell Titer Glow assay after 72 hours of treatment. (E) Effect of AA on human (H929, MM1S, and U266) MM cell proliferation at higher concentrations after 72 hours of treatment. (F) Flow cytometric analysis of lipid peroxidation measured by BODIPY-11C fluorescence in MM.1S after exposure to 100 μM AA for 24 hours. (G) Tumor plasmacytoma model in SCID mice was generated. MM1S (2.5 × 10⁶) cells were injected subcutaneously in the intra-scapular region of mice (n = 10 per group), and the tumor treated with AA (500 μg/g). Tumor growth kinetics is represented for a period of 41 days. PBS was used as vehicle and control. (H) Expression of proliferation marker Ki67 in tumor tissues was determined by immunohistochemistry for groups treated with vehicle and AA (500 μg/g). (I) Apoptosis-inducing AA-signaling pathways in MM cells were investigated. Inhibition of different AA metabolic pathways in MM.1S cells were investigated by using ibuprofen, baicalein, BW B70C, 1-aminobenzotriazole, and ferrostatin; relative cell viability was measured by using an MTT assay. (J) Flow cytometric panel representation of GPX-4 and Lipid ROX modulation by AA and relative recovery by ferrostatin. Data are presented as mean ± standard error of the mean. *P < .05. DMSO, dimethyl sulfoxide.
Lower FA uptake promotes proliferation, whereas higher FA uptake results in lipotoxicity through a ferroptosis pathway. (A) AA concentration (nanograms per milliliter) in BM supernatant of patients with MGUS (n = 14), SMM (n = 12), NDMM (n = 22), and RRMM (n = 17) and healthy controls (HD) (n = 7) measured by using an enzyme-linked immunosorbent assay. (B) Dose-dependent effect of AA on cell proliferation in myeloma cell line 5TGM1 quantified by CyQUANT assay after 72 hours of treatment. (C) Effect of AA on cell viability in myeloma cell line 5TGM1 assessed by CellTiter-Glo Assay after 72 hours of treatment. (D) Cell viability of 5TGM1 cells in the presence of linoleic acid assessed by Cell Titer Glow assay after 72 hours of treatment. (E) Effect of AA on human (H929, MM1S, and U266) MM cell proliferation at higher concentrations after 72 hours of treatment. (F) Flow cytometric analysis of lipid peroxidation measured by BODIPY-11C fluorescence in MM.1S after exposure to 100 μM AA for 24 hours. (G) Tumor plasmacytoma model in SCID mice was generated. MM1S (2.5 × 10⁶) cells were injected subcutaneously in the intra-scapular region of mice (n = 10 per group), and the tumor treated with AA (500 μg/g). Tumor growth kinetics is represented for a period of 41 days. PBS was used as vehicle and control. (H) Expression of proliferation marker Ki67 in tumor tissues was determined by immunohistochemistry for groups treated with vehicle and AA (500 μg/g). (I) Apoptosis-inducing AA-signaling pathways in MM cells were investigated. Inhibition of different AA metabolic pathways in MM.1S cells were investigated by using ibuprofen, baicalein, BW B70C, 1-aminobenzotriazole, and ferrostatin; relative cell viability was measured by using an MTT assay. (J) Flow cytometric panel representation of GPX-4 and Lipid ROX modulation by AA and relative recovery by ferrostatin. Data are presented as mean ± standard error of the mean. *P < .05. DMSO, dimethyl sulfoxide.
Based on our in vitro studies, we hypothesized that peritumoral delivery of AA might reduce MM tumor burden. To test this theory, we generated a plasmacytoma model in SCID mice using MM.1S cells as previously described.20,21 Mice were treated with peritumoral delivery of AA. Treatment with AA significantly decreased tumor volume (Figure 5G). Immunohistochemical staining of the tumors at euthanasia revealed a decrease in the Ki67 proliferation marker (Figure 5H).
To identify the underlying mechanism within the apoptosis-inducing AA signaling pathway, we used specific inhibitors of each of these signaling pathways, including ibuprofen (cyclooxygenase inhibitor), baicalein (12-LOX inhibitor), BW B70C (5,15-LOX inhibitor), 1-aminobenzotriazole (cytochrome P450 inhibitor), and ferrostatin (ferroptosis/lipid peroxidation inhibitor). The ferrostatin treatment completely rescued AA-induced apoptosis (Figure 5I) and suppression of proliferation in MM.1S and H929 cells (supplemental Figure 7). Ferroptosis cell death is the result of an accumulation of lipid peroxides, which is generally prevented by the enzyme glutathione peroxidase 4 (GPX4). We therefore investigated the role of AA on GPX4 and found that all MM cell lines partially or completely lost the expression of GPX4 when exposed to AA and that this effect was completely abrogated when cotreated with ferrostatin (Figure 5J).
Discussion
CAA support tumor progression through adipokines, synergistic metabolic reprogramming, or modulation of the TME. MM cells are surrounded by adipocytes in the BM, as shown previously by immunostaining of CD138+cells in BM biopsy samples from patients with SMM.35 A growing consensus shows that BMAds support MM proliferation and viability, and create a protective niche, allowing evasion from antitumor therapies.16,18,19,36 Emerging studies have begun to elucidate the cellular and molecular mechanisms involved.19,37 We found that MM cells induce lipolysis in BMAds and uptake the released FFAs through FATPs, most likely for their metabolic reprogramming (Visual abstract).
BMAds are a distinct fat depot; their molecular and cellular functions are distinct from white, beige, and brown adipocytes.38 Although the role of white and brown adipocytes has been well recognized in solid tumors such as breast and prostate cancer, the role of BMAds in normal and malignant hematopoiesis is still being elucidated.39 In normal hematopoiesis, BMAd numbers may be negatively correlated with hematopoietic stem cell numbers.40 Conversely, BMAds may serve as a source of stem cell factor after irradiation, leading to hematopoietic recovery.41 BMAds are also a major source of adiponectin,42 which stimulates hematopoietic stem cell proliferation and multipotency, whereas the loss of adiponectin results in defective hematopoietic regeneration.43 Adiponectin is also known to inhibit tumor progression. In MM, Morris et al19 have shown that myeloma progression occurs at least in part by inhibiting the secretion of adiponectin from adipocytes through tumor necrosis factor α signaling.
We found that BMSCs from patients with MGUS/SMM have an increased commitment toward the adipocytic lineage, indicating that the BM TME is preconditioned toward increased adipogenesis in early and precursor myeloma stages. This is supported by previous findings of increased Pref-1 and increased adipocyte size in BM biopsy samples from patients with NDMM.18 Single-cell RNA-sequencing analysis showed that MM.1S cells reprogram MSC from HD toward more adipogenic differentiation, as opposed to commitment toward osteoblastic lineage.44 Similarly, the KaLaWaRij mouse model of MM low (but not high) burden of MM showed a significant increase in BMAds.19 More recent studies have shown that MM cells induce senescence in BMAds.45
Our data show that MM cells induce lipolysis in BMAds and that genes involved in lipolysis are increased in BM fat fractions from patients with MM at all stages. LipidTOX-labeled FAs are directly transferred from adipocytes to MM cells via FATPs expressed on MM cells. A previous study showed that exogenously added adipocyte-derived FFAs are taken up in various amounts by different MM cell lines, likely due to variation in the expression of FA transporters and the composition of the FFA mixture.7 Interestingly, we did not find a consistent expression of CD36 on MM cells as seen in other tumors such as prostate cancer. Moreover, suppressing FA uptake by CD36 inhibition slowed cancer progression46 in this model. Hematologic cancers such as AML induce lipolysis in adipocytes, at least in part, via secretion of GDF15 and activation of hormone-sensitive lipase.7,47 The secreted FFAs are then transported to AML cells through FABP4.7
Long-chain FAs such as BODIPY C12 and BODIPY C16 are transported into cells through the FATP family of lipid transporters.48 The rapid uptake of BODIPY C12 and BODIPY C16 by MM cells shown here suggested that FATPs are the major transporters of lipolysis-induced FFAs. Here we report time-dependent expression of FATP4 in response to extracellular long-chain FAs such as AA, suggesting the shuttling of these transporters between an intracellular and cell surface location in MM cells. Furthermore, a decrease in FA uptake after treatment with the FATP inhibitor lipofermata found that FATP inhibition can serve as a therapeutic target in reducing MM progression.
Our studies show that low and high concentrations of FA uptake by MM cells could have either proliferative or lipotoxic effects, respectively. Moreover, uptake of small-chain vs very-long-chain FA could have different effects on MM cells. Therefore, the nature of FFA uptake may have multi-modal effects on MM cells. We found that AA promotes proliferation at low concentrations but at high concentrations induces lipotoxicity through ferroptosis, a lipid peroxidase–based regulated cell death pathway.49,50 FFAs primarily act as structural units of the membrane, facilitate β-oxidation for energy production, serve as lipid-signaling molecules, and promote cancer progression.51-53 Instead of relying on FASN-mediated de novo lipogenesis, FAs released from adipocytes may be used for driving cancer progression by AML,7 ovarian,52 prostate,54 pancreatic,55 and melanoma56 tumor cells. Hematopoietic stem cells uptake FFAs, and the inhibition of FA oxidation in hematopoietic stem cells leads to cellular or functional alterations such as asymmetric division or defective repopulation after transplantation.57
Altogether, our studies suggest that MM cells ensure FFA energy supply first by inducing lipolysis in adipocytes and then by uptaking FFAs through FATPs. Targeting BMAds to reduce adipogenesis and lipolysis and targeting MM cells to inhibit FATP-mediated FFA uptake or modulation of AA-initiated signaling may lead to reduced tumor burden and progression in patients with MM.
Acknowledgments
The authors thank the Flow Cytometry Core in the Center for Regenerative Medicine at Massachusetts General Hospital for their support in flow cytometry analysis.
This work was supported by the Multiple Myeloma Research Fund at the Massachusetts General Hospital.
Authorship
Contribution: C.P., K.F., and N.R. were responsible for conceptualization and designed the studies; C.P. and K.F. developed methodologies; C.P., K.F., T.M., C.O., K.-T.S., and A.M. were responsible for data acquisition; C.P., K.F., and N.R. analyzed the data; C.P., K.F., and N.R. wrote the manuscript; and all the authors reviewed the manuscript.
Conflict-of-interest disclosure: The authors declare no competing financial interests.
The current affiliation for K.F. is Constellation Pharmaceuticals, Cambridge, MA.
Correspondence: Noopur Raje, Lawrence House, Room POB 216, 55 Fruit Street, Boston, MA 02114; e-mail: nraje@mgh.harvard.edu.
Requests for original data may be submitted via e-mail to the corresponding author.
The online version of this article contains a data supplement.
The publication costs of this article were defrayed in part by page charge payment. Therefore, and solely to indicate this fact, this article is hereby marked “advertisement” in accordance with 18 USC section 1734.

Comments
FFAs and myeloma