

Key Points
STAT3 regulates amino acid influx and glutaminolysis in leukemia stem cells by promoting expression of MYC and SLC1A5.
Depletion of glutamine and its downstream metabolites leads to a decrease in OXPHOS activity in LSCs, resulting in cell death.

Abstract
Acute myeloid leukemia (AML) is characterized by the presence of leukemia stem cells (LSCs), and failure to fully eradicate this population contributes to disease persistence/relapse. Prior studies have characterized metabolic vulnerabilities of LSCs, which demonstrate preferential reliance on oxidative phosphorylation (OXPHOS) for energy metabolism and survival. In the present study, using both genetic and pharmacologic strategies in primary human AML specimens, we show that signal transducer and activator of transcription 3 (STAT3) mediates OXPHOS in LSCs. STAT3 regulates AML-specific expression of MYC, which in turn controls transcription of the neutral amino acid transporter gene SLC1A5. We show that genetic inhibition of MYC or SLC1A5 acts to phenocopy the impairment of OXPHOS observed with STAT3 inhibition, thereby establishing this axis as a regulatory mechanism linking STAT3 to energy metabolism. Inhibition of SLC1A5 reduces intracellular levels of glutamine, glutathione, and multiple tricarboxylic acid (TCA) cycle metabolites, leading to reduced TCA cycle activity and inhibition of OXPHOS. Based on these findings, we used a novel small molecule STAT3 inhibitor, which binds STAT3 and disrupts STAT3-DNA, to evaluate the biological role of STAT3. We show that STAT3 inhibition selectively leads to cell death in AML stem and progenitor cells derived from newly diagnosed patients and patients who have experienced relapse while sparing normal hematopoietic cells. Together, these findings establish a STAT3-mediated mechanism that controls energy metabolism and survival in primitive AML cells.
Introduction
Acute myeloid leukemia (AML) is an aggressive disease with a dismal prognosis and high relapse rates.1,2 AML is thought to arise from a subpopulation of leukemia stem cells (LSCs), which display unique molecular properties and negatively correlate with survival.3,4 LSCs are often found in greater abundance at the time of relapse, suggesting that they are more resistant to chemotherapy.3-6 Therefore, identifying approaches to selectively target the LSC population is an important component of disease management. One unique vulnerability of LSCs is their preferential reliance on mitochondrial activity and oxidative phosphorylation (OXPHOS) for energy production.6-8 This reliance differs from normal hematopoietic cells, which are more flexible in their ability to use several pathways for energy production.9-11 Strategies aimed at inhibiting OXPHOS are of considerable interest and have been described in several reports.7,12,13 Although we have previously described the metabolic rewiring of LSCs toward increased reliance on OXPHOS,7,13 limited mechanistic evidence has been generated to explain the etiological contributors to such events.
In the present study, we identify the signal transducer and activator of transcription 3 (STAT3) as a modulator of OXPHOS and potential target for therapy. Prior studies have shown that STAT3 is important for leukemogenesis and is overexpressed in many AML patient samples.14-16 STAT3 is activated by several signals, including interleukin-6,15,17 which induce phosphorylation of 2 residues on STAT3, Y705, and S727. Phosphorylation at Y705 leads to dimerization of STAT3 and translocation to the nucleus,18 in which STAT3 plays a role as a nuclear transcription factor that mediates self-renewal and proliferation.19 STAT3 also has a less characterized role regulating various functions of the mitochondria.20 Its localization and function in the mitochondria are thought to be mediated by the phosphorylation of residue S727,20,21 and some studies have suggested that mitochondrial STAT3 regulates mitochondrial genes,22 whereas others have demonstrated that it can also act to enhance the activity of the electron transport chain (ETC).21,23 Based on previous studies and the known role of OXPHOS in supporting LSCs, we hypothesized that targeting STAT3 could facilitate eradication of primitive AML cell types. Here we show, similar to prior studies, that STAT3 is highly expressed in AML,14-16,24,25 and by using primary human AML specimens, we show that STAT3 serves as an important factor in regulating OXPHOS.
Methods
Cell culture
Base media of minimum essential medium and 5.5 mM of glucose was used, supplemented with physiologic levels of amino acids as previously reported12 and 10 nM of human cytokines stem cell factor (SCF), interleukin-3, and Fms Related Receptor Tyrosine Kinase 3 (FLT3).
Patient samples and LSC enrichment
Primary human AML samples were obtained from apheresis products or bone marrow of patients with AML who gave written consent for sample procurement at the University of Colorado, according to the Colorado IRB Protocol #12-0173. For analysis of LSC-enriched fractions, specimens were processed as previously described.12,26,27 Detailed methods can be found in supplemental Materials (available on the Blood Web site). Characteristics of patient samples used are described in Table 1, and samples used for each experiment are outlined in Table 2.
Characteristics of primary AML samples used for these studies
| AML | Diagnosis | Cytogenetics | Mutations | Age/gender | Phereses or bone marrow |
|---|---|---|---|---|---|
| AML1 | Relapse | Complex | IDH1, cKIT | 47 yo M | Pheresis |
| AML2 | De novo | Complex | None | 73 yo F | Pheresis |
| AML3 | De novo | Normal | NPM1, FLT3-TKD, PTPN11 | 74 yo F | Pheresis |
| AML4 | Relapse | t(6;9)(p21;q34) | FLT3-ITD, FLT3-TKD, IDH2 | 79 yo M | Pheresis |
| AML5 | Relapse | Normal | FLT3-ITD | 49 yo F | Pheresis |
| AML6 | De novo | Normal | FLT3-ITD | Pheresis | |
| AML7 | No information | — | — | — | Pheresis |
| AML8 | Unknown | Complex | CBL, SRSF2, TET2 | 80 yo F | Pheresis |
| AML9 | No information | — | — | — | Pheresis |
| AML10 | De novo | Complex | FLT3-ITD, BCOR, NOTCH1 | 52 yo M | Pheresis |
| AML11 | De novo | Complex | ASXL1, DNMT3A NOTCH1, NRAS | 52 yo M | Pheresis |
| AML12 | Relapse | Normal | FLT3, NPM1, IDH1 | 65 yo F | Pheresis |
| AML13 | De novo | Complex | KRAS, PTPN11 | 60 yo F | Pheresis |
| AML14 | De novo | inv(16) (p13.1q22) | None | 21 yo M | Pheresis |
| AML15 | No information | — | — | — | Bone marrow |
| AML16 | No information | — | — | — | Bone marrow |
| AML17 | Unknown | Normal | FLT3-ITD, MPN1 | Unknown | Bone marrow |
| AML18 | Unknown | Normal | MPN1 | Unknown | Bone marrow |
| AML19 | No information | — | — | — | — |
F, female; M, male; yo, year old.
Samples used for each experiment
| Experiment | Samples used |
|---|---|
| RNA-sequencing | AML: 6, 11, 13, 14 |
| ChIP assay | AML: 1, 4, 6 |
| Metabolomics: global | AML: 6, 11, 14 |
| Metabolomics: flux | AML: 4, 5, 6 |
| siRNA experiments | AML: 1, 3, 4, 14 |
| Complex activity assays | AML: 11, 14, 3 |
| MitoSox assay | AML: 5, 6,14 |
| Viability assays LSCs | AML: 5, 6, 14, 11, 15, 16, 17, 18 |
| Colony assays | AML: 1, 2, 4, 6, 11, 13 |
| Patient-derived xenograft ex vivo assays | AML: 1, 6, 11 |
| In vivo assay | AML: 1 |
Seahorse Cell Mito Stress Test
The extracellular flux assay XF96 kit was used to measure oxygen consumption rate (OCR). Drug-treated or siRNA-treated primary AML cells or LSCs were plated on Cell-Tak–coated XF96 cell culture microplates at 200 000 cells/well in 5 replicates and measured according to the manufacturer’s protocol. OCR was measured at basal level and after injection of 5 μg/mL of oligomycin, 2 μmol/L of Carbonyl cyanide-p-trifluoromethoxyphenylhydrazone (FCCP), 5 μmol/L of antimycin A, and 5 μmol/L of rotenone.
SF25 synthesis and characterization
The chemical synthesis of SF25 (STAT3i) is described in supplemental Methods. Cell-based enzyme-linked immunosorbent assay (ELISA) was used to determine the inhibition of cellular STAT3, STAT1α, STAT5A, and STAT5B from binding to an immobilized DNA consensus sequence. HeLa cells (1 million cells/100-mm dish) that expressed constitutively active STAT3 were treated with STAT3i for 24 hours. Nuclear extracts were prepared using an extraction kit (Signosis) and diluted in complete lysis buffer. Evaluation of STAT3 from the nuclear extract binding to an immobilized DNA consensus sequence was determined using the TransAM STAT3 ELISA kit (ActiveMotif).28
RNA-sequencing
LSCs were treated with either vehicle control or 5 μM of STAT3i for 4 hours. mRNA isolation, quality check, library construction, and sequencing were performed according to a previously used protocol.12 Single-end reads of 100 nt were generated for each sample on the Illumina HiSeq2500 platform. Methods for RNA-sequencing analysis can be found in supplemental Materials.
ETC complex activity assay
Complex I and complex V activity was measured by a calorimetric assay (Abcam ab109721 and ab109714), according to the manufacturer’s protocol. Complex II/III activity was measured using Agilent’s XF Plasma Membrane Permeabilizer according to the manufacturer’s protocol. Cells were treated with 2 μM of rotenone and succinate was added as a substrate at 10 nM. Baseline OCR was read in an XF96 Analyzer, and 2 μM of antimycin A was then used to inhibit the complex.
Metabolic tracing experiments
Technical replicates of 250 000 LSCs were sorted and first incubated with vehicle control (DMSO) vs 5 μM of STAT3i for 3 hours. Cells were then incubated with 13C5,15N2-L-Glutamine for 1, 8, or 16 hours. Heavy-labeled L-Glutamine was added at a physiologically relevant concentration (650 μM). Extraction and mass spectrometry were performed as previously described29-31; detailed methods can be found in supplemental Materials.
Colony-forming unit assay
Primary AML or normal cord blood mononuclear cells were first treated with drug vs vehicle control overnight at 37°C, or infected with lentivirus expressing shSCR or shSTAT3 and they were subsequently seeded in human methylcellulose media at 25 000 cells/mL. These cells were grown at 37°C for up to 14 days before counting with a stereomicroscope. The detailed methods for generating lentiviral particles, and infecting AML cells has been previously described.32
Mouse studies
Xenograft studies were performed as previously described33 and are detailed in the supplemental Methods. In brief, human primary AML cells were treated with either vehicle control or 5 μM of STAT3i overnight. On the second day, 8 to 9 busulfan-conditioned NSG-S mice per group were injected with AML cells. Mice were euthanized after 8 to 10 weeks and tested for engraftment using mouse- and human-specific CD45 antibodies. For in vivo mouse studies, mice were first engrafted with a human primary AML sample to approximately 15% human blast cells. They were then treated intraperitoneally with either 30 mg/kg of STAT3i or vehicle control for 6 consecutive days.
Results
STAT3 is highly expressed in primary AML cells and plays a role in OXPHOS
To investigate the role of STAT3 in human AML cells, we used multiple primary AML specimens donated by patients at University of Colorado (characteristics outlined in Table 1). We first measured expression of total and phosphorylated STAT3 at Y705, a marker of STAT3 activation, via western blot. As shown in Figure 1A, 14 of 18 AML patient samples showed significantly higher STAT3 expression compared with the nearly absent STAT3 expression in normal mononuclear cells isolated from umbilical cord blood. Furthermore, 8 of 18 AML samples tested showed phosphorylation of STAT3 at the residue Y705, suggesting constitutive activation. To determine whether STAT3 expression mediates mitochondrial function of AML cells, we first performed siRNA-mediated knockdown studies and evaluated the results on mitochondrial respiration. STAT3 knockdown (Figure 1B-C) led to a significant decrease in the OCR after 48 hours, as demonstrated in a representative primary AML sample (Figure 1D) and 3 primary AML samples (Figure 1E). Notably, our siRNA-mediated knockdown was specific to STAT3 and did not affect STAT5 (supplemental Figure 1A). Reduction in STAT3 was followed by decreased viability in knockdown cells at 60 hours (Figure 1F). These findings suggest a role for STAT3 in mitochondrial function.
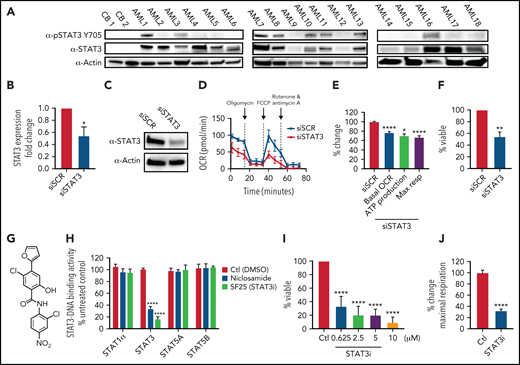
STAT3 is expressed in primary AML cells and plays a role in OXPHOS. (A) Western blot showing total and phosphorylated STAT3 levels in mononuclear cells derived from 2 cord blood (CB) and 18 human primary AML samples. (B) qPCR showing mRNA expression levels of STAT3 in 3 primary AML samples treated with scramble siRNA (siSCR) control or siRNA against STAT3 (siSTAT3) after 48 hours of culture. (C) Western blot showing STAT3 protein levels 48 hours after transfection of siSTAT3 compared with siSCR. (D) Seahorse Cell Mito Stress Test showing OCR at the time of highest STAT3 knockdown (24-48 hours) of a representative primary AML sample. (E) Combined data showing changes in basal OCR, ATP production, and maximal respiratory capacity in 4 primary AML samples, including sample 1D, upon STAT3 inhibition by siRNA. (F) Viability assay of STAT3-deficient cells compared with scramble control (siSCR) after 60 hours in culture (48 hours of siRNA KD plus 12 hours of viability). (G) Structure of the salicylamide STAT3 inhibitor SF25 (STAT3i). (H) Cell-based ELISA performed in HeLa cells showing cellular STAT1α, STAT3, STAT5A, and STAT5B binding to an immobilized DNA consensus sequence in the presence or absence of STAT3i as well as niclosamide. (I) Viability assay in 8 primary AML samples treated with various doses of STAT3i for 24 hours compared with vehicle control. (J) Maximal respiratory capacity changes based on Seahorse Cell Mito Stress Test in 3 primary AML samples upon treatment with 5 μM of STAT3i for 4 hours compared with vehicle control. Statistical analyses were performed using the Student t-test. P values are represented as follows: *P ≤ .05; **P ≤ .01; ***P ≤ .001; ****P ≤ .0001.
STAT3 is expressed in primary AML cells and plays a role in OXPHOS. (A) Western blot showing total and phosphorylated STAT3 levels in mononuclear cells derived from 2 cord blood (CB) and 18 human primary AML samples. (B) qPCR showing mRNA expression levels of STAT3 in 3 primary AML samples treated with scramble siRNA (siSCR) control or siRNA against STAT3 (siSTAT3) after 48 hours of culture. (C) Western blot showing STAT3 protein levels 48 hours after transfection of siSTAT3 compared with siSCR. (D) Seahorse Cell Mito Stress Test showing OCR at the time of highest STAT3 knockdown (24-48 hours) of a representative primary AML sample. (E) Combined data showing changes in basal OCR, ATP production, and maximal respiratory capacity in 4 primary AML samples, including sample 1D, upon STAT3 inhibition by siRNA. (F) Viability assay of STAT3-deficient cells compared with scramble control (siSCR) after 60 hours in culture (48 hours of siRNA KD plus 12 hours of viability). (G) Structure of the salicylamide STAT3 inhibitor SF25 (STAT3i). (H) Cell-based ELISA performed in HeLa cells showing cellular STAT1α, STAT3, STAT5A, and STAT5B binding to an immobilized DNA consensus sequence in the presence or absence of STAT3i as well as niclosamide. (I) Viability assay in 8 primary AML samples treated with various doses of STAT3i for 24 hours compared with vehicle control. (J) Maximal respiratory capacity changes based on Seahorse Cell Mito Stress Test in 3 primary AML samples upon treatment with 5 μM of STAT3i for 4 hours compared with vehicle control. Statistical analyses were performed using the Student t-test. P values are represented as follows: *P ≤ .05; **P ≤ .01; ***P ≤ .001; ****P ≤ .0001.
These findings were extended using a pharmacological small molecule STAT3 inhibitor, SF25 (hereafter termed STAT3i). STAT3i is a salicylamide that, like the previously described STAT3 inhibitor niclosamide, interacts with the DNA-binding domain of STAT3 and inhibits STAT3-DNA interaction (Figure 1G-H).28 STAT3i is a more potent inhibitor of STAT3-DNA binding and has improved cell penetration and retention properties over niclosamide. STAT3i also shows selectivity to STAT3 inhibition compared with other members of the STAT family (Figure 1H). To test STAT3i, we first performed a dose response analysis using 8 primary AML samples. As shown in Figure 1I, after 24 hours of culture, significant cell death was observed at doses as low as 625 nM. To ensure that subsequent studies of mitochondrial respiration could be performed before the onset of overt cell death events, which could confound analyses of STAT3 activity, we titrated time of exposure and dose (supplemental Figure 1B). These studies demonstrated no evident death in the first 12 hours of culture at a 5-μM concentration. Subsequent studies performed at a dose of 5 μM showed a profound inhibition of maximal respiratory capacity after only 4 hours for 3 of 3 primary AML specimens (Figure 1J), in agreement with the findings observed upon STAT3 knockdown, and confirmed that OXPHOS inhibition occurs before cell death (supplemental Figure 1B).
We do note that the effect seen with STAT3i is more pronounced than with STAT3 knockdown, and although this could be caused by the transient effect of siRNA technology, additional off-target effects from this compound cannot be ruled out. Because our primary samples are predominantly derived from leukapheresis, we also corroborated these findings in 3 primary bone marrow samples, which show a significant decrease in OXPHOS activity upon treatment of STAT3i (supplemental Figure 1C). To determine if this effect was specific to STAT3, we also evaluated the expression of STAT5, which has also been shown to be upregulated in primary AML cells.34,35 As shown in supplemental Figure 1D, 6 of 8 patient samples showed increased expression of STAT5, but only 1 sample showed significant phosphorylation of this protein. Further, siRNA-mediated knockdown of STAT5 showed no significant effect on maximal respiration in 4 primary AML samples (supplemental Figure 1E-F), suggesting that the regulation of OXPHOS is a specific characteristic of STAT3.
MYC is a downstream target of STAT3 and regulates OXPHOS in LSCs
Because OXPHOS is important for LSC survival7,12,13 and the above data showed that STAT3 can regulate OXPHOS in bulk leukemia, we next sought to determine whether STAT3 activity also plays a role in LSC biology. We have previously shown that LSCs are characterized by the presence of low reactive oxygen species (termed ROS-low), a characteristic that can be used to isolate LSC-enriched subpopulations from primary AML specimens (Figure 2A; supplemental Figure 2A).7,26 Upon pharmacological inhibition with 5 μM of STAT3i, a similar decrease in maximal respiratory capacity was seen in ROS-low LSCs (Figure 2B) as observed for bulk AML specimens. Of note, ROS-high cells isolated from bulk leukemia specimens (supplemental Figure 2B) were also impaired, suggesting that all populations of AML are affected by STAT3i. To investigate how STAT3 regulates OXPHOS in LSCs, we performed RNA-sequencing using specimens treated with 5 μM of STAT3i vs vehicle control for 4 hours (n = 4 individual patient samples). As observed for bulk tumor cells (supplemental Figure 1B), 4-hour incubation with STAT3i showed no significant cell death (supplemental Figure 2C) in LSCs. To analyze our RNA-sequencing data, we first confirmed that known STAT3 targets were downregulated on samples treated with STAT3i36,37 (supplemental Figure 2D). This was followed by gene set enrichment analysis, which showed changes in multiple pathways (supplemental Figure 2E-F), including several mitochondrial pathways and transcription factor targets (supplemental Figure 2G-H).
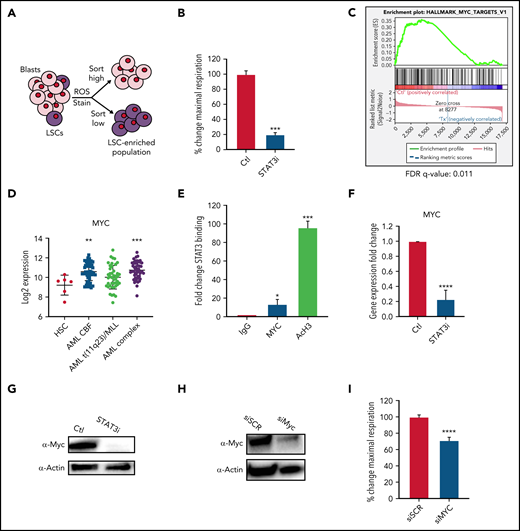
STAT3 regulates OXPHOS in LSCs via transcriptional regulation of MYC. (A) Cartoon depiction of sorting scheme for LSCs. (B) Maximal respiratory capacity changes based on Seahorse Cell Mito Stress Test in LSCs isolated form 3 primary AML samples after treatment with 5 μM of STAT3i for 4 hours compared with vehicle control. (C) RNA-sequencing showing expression changes in the MYC targets pathway in LSCs isolated from 4 primary AML samples after treatment with 5 μM of STAT3i compared with vehicle control. (D) Expression data from BloodSpot showing differences in MYC expression in AML cells compared with hematopoietic stem cells (HSCs). CBF, core-binding factor; Complex, complex cytogenetics. (E) ChIP-PCR showing STAT3 binding to MYC promoter region. Data are shown as percent input and normalized to negative IgG control. AcH3 is used as a positive control (n = 3). (F) qPCR comparing MYC expression of LSCs treated with 5 μM of STAT3i for 4 hours compared with vehicle control. (G) Western blot comparing protein levels of Myc in LSCs treated with 5 μM of STAT3i for 4 hours compared with vehicle control. (H) Western blot showing Myc protein expression 48 hours after siRNA transfection. (I) Seahorse Cell Mito Stress Test showing changes in maximal respiratory capacity of 4 primary AML samples 48 hours after transfection of either siRNA against MYC or scramble control. Statistical analyses were performed using the Student t-test. P values are represented as follows: *P ≤ .05; **P ≤ .01; ***P ≤ .001; ****P ≤ .0001.
STAT3 regulates OXPHOS in LSCs via transcriptional regulation of MYC. (A) Cartoon depiction of sorting scheme for LSCs. (B) Maximal respiratory capacity changes based on Seahorse Cell Mito Stress Test in LSCs isolated form 3 primary AML samples after treatment with 5 μM of STAT3i for 4 hours compared with vehicle control. (C) RNA-sequencing showing expression changes in the MYC targets pathway in LSCs isolated from 4 primary AML samples after treatment with 5 μM of STAT3i compared with vehicle control. (D) Expression data from BloodSpot showing differences in MYC expression in AML cells compared with hematopoietic stem cells (HSCs). CBF, core-binding factor; Complex, complex cytogenetics. (E) ChIP-PCR showing STAT3 binding to MYC promoter region. Data are shown as percent input and normalized to negative IgG control. AcH3 is used as a positive control (n = 3). (F) qPCR comparing MYC expression of LSCs treated with 5 μM of STAT3i for 4 hours compared with vehicle control. (G) Western blot comparing protein levels of Myc in LSCs treated with 5 μM of STAT3i for 4 hours compared with vehicle control. (H) Western blot showing Myc protein expression 48 hours after siRNA transfection. (I) Seahorse Cell Mito Stress Test showing changes in maximal respiratory capacity of 4 primary AML samples 48 hours after transfection of either siRNA against MYC or scramble control. Statistical analyses were performed using the Student t-test. P values are represented as follows: *P ≤ .05; **P ≤ .01; ***P ≤ .001; ****P ≤ .0001.
Interestingly, one of the top pathways changed upon STAT3 inhibition was “MYC targets” (Figure 2C). MYC is a transcription factor and oncogene that is frequently activated in AML and can induce leukemogenesis.38,39 This finding is supported by analyses derived from the BloodSpot database (http://www.bloodspot.eu/)40 showing MYC is consistently upregulated in AML cells (Figure 2D). In addition, prior studies showed that STAT3 regulates transcriptional activity of the MYC gene,41 a finding confirmed in the present study, in which we observed STAT3 binding to the MYC promoter region by chromatin immunoprecipitation (ChIP) analysis (Figure 2E). To confirm that STAT3 regulates MYC, LSCs were treated with STAT3i for 4 hours and quantitative polymerase chain reaction (qPCR) and western blot tests were performed, showing significant downregulation of the MYC RNA and protein (Figure 2F-G). To test whether MYC plays a role in the OXPHOS changes seen upon STAT3 inhibition, we used siRNA to knock down MYC in primary AML patient samples and analyzed mitochondrial respiration. A reduction in maximal OCR indicated that knockdown of MYC leads to a significant decrease in OXPHOS AML cells (Figure 2H-I).
STAT3 regulates glutamine influx in LSCs via MYC
To better understand the ramifications of STAT3 inhibition, we next examined global energy metabolism of LSCs. To this end, we sorted ROS-low LSCs from 4 primary AML samples, cultured them with 5 μM of STAT3i vs vehicle control for 4 hours, and performed metabolomic studies as previously described.42 Steady-state analysis of the metabolomics data identified significant changes in metabolites that are part of the glutaminolysis pathway (supplemental Figure 3A), whereas glycolytic metabolites were unchanged (supplemental Figure 3B). This result suggests that STAT3 signaling could control OXPHOS by promoting glutaminolysis in LSCs. Because glutamine and glutamate were decreased, we also challenged other amino acids. Some amino acids such as cysteine did not decrease significantly, whereas aspartate and proline increased (supplemental Figure 3C), likely as a compensatory response to the decreased glutamine pathway. Interestingly, even in the presence of higher aspartate levels, which can contribute to glutamate production, we saw a reduction in glutamate that could be related to decreased expression of aspartate aminotransferase upon STAT3 inhibition (supplemental Figure 3D).
To further characterize the impact of STAT3 inhibition in the glutaminolysis pathway, we performed a metabolic tracing experiment with stable isotope-labeled glutamine, which captures dynamic changes in glutamine levels and catabolism.43 Heavy-labeled glutamine was used for a time course experiment to determine how carbons mobilize into different energetic pathways upon modulation of STAT3; 5 μM of STAT3i or vehicle control was added to ROS-low AML cells 4 hours before the first time point. 13C5,15N2 L-Glutamine was then added at physiologically relevant concentrations, and heavy-labeled metabolites were measured at 1, 8, and 16 hours by mass spectrometry (Figure 3A). STAT3 inhibition decreased the levels and percentage of heavy carbon accumulation in intracellular glutamine and glutamate in as little as 1 hour, and within 8 hours reduced glutathione (GSH) was also evident (Figure 3B). Furthermore, glutamine carbon accumulation was also decreased in TCA cycle intermediates, including α-ketoglutarate, succinate, and citrate (supplemental Figure 3E-F). This finding suggests a decreased influx of glutamine into AML LSCs upon STAT3 inhibition, likely mediated by glutamine transporter(s), resulting in decreased levels of GSH and TCA cycle intermediates (Figure 3C).
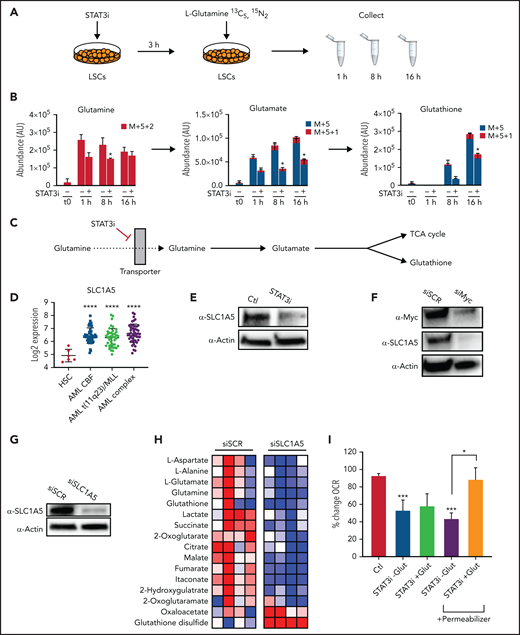
STAT3 promotes glutaminolysis in LSCs via MYC’s regulation of the transporter SLC1A5. (A) Cartoon depiction of experimental design. LSCs are isolated from primary human AML cells and then treated with 5 μM of STAT3i vs vehicle control for 3 hours. Stable-isotope labeled 13C5,15N2-L-Glutamine is then added to the media, and cells are collected at 1, 8, and 16 hours and analyzed by mass spectrometry. (B) Tracing experiments showing changes in intracellular glutamine, glutamate, and glutathione in LSCs after 4 hours of treatment with 5 μM of STAT3i compared with vehicle control (n = 4). (C) Cartoon depiction of hypothesized pathway by which STAT3 regulates glutaminolysis. (D) Data from BloodSpot showing SLC1A5 gene expression in AML cells compared with HSCs. CBF, core-binding factor; Complex, complex cytogenetics. (E) Western blot showing protein levels of SLC1A5 in LSCs after a 4-hour incubation period with 5 μM of STAT3i compared with vehicle control. (F) Western blot showing protein levels of SLC1A5 after knocking down MYC in a human primary AML patient sample. (G) Western blot showing SLC1A5 protein levels after 48 hours of siRNA knockdown compared with scramble control. (H) Heat map of steady-state metabolomics in primary AML cells treated with siSCR versus siSLC1A5. (I) Seahorse assay showing OCR after 40 minutes of 5 μM of STAT3i-treated LSCs in the presence or absence of media supplemented with 10× glutamine. These conditions were then recapitulated in the presence of a plasma membrane permeabilizer (n = 4). Statistical analyses were performed using the Student t-test. P values are represented as follows: *P ≤ .05; **P ≤ .01; ***P ≤ .001; ****P ≤ .0001.
STAT3 promotes glutaminolysis in LSCs via MYC’s regulation of the transporter SLC1A5. (A) Cartoon depiction of experimental design. LSCs are isolated from primary human AML cells and then treated with 5 μM of STAT3i vs vehicle control for 3 hours. Stable-isotope labeled 13C5,15N2-L-Glutamine is then added to the media, and cells are collected at 1, 8, and 16 hours and analyzed by mass spectrometry. (B) Tracing experiments showing changes in intracellular glutamine, glutamate, and glutathione in LSCs after 4 hours of treatment with 5 μM of STAT3i compared with vehicle control (n = 4). (C) Cartoon depiction of hypothesized pathway by which STAT3 regulates glutaminolysis. (D) Data from BloodSpot showing SLC1A5 gene expression in AML cells compared with HSCs. CBF, core-binding factor; Complex, complex cytogenetics. (E) Western blot showing protein levels of SLC1A5 in LSCs after a 4-hour incubation period with 5 μM of STAT3i compared with vehicle control. (F) Western blot showing protein levels of SLC1A5 after knocking down MYC in a human primary AML patient sample. (G) Western blot showing SLC1A5 protein levels after 48 hours of siRNA knockdown compared with scramble control. (H) Heat map of steady-state metabolomics in primary AML cells treated with siSCR versus siSLC1A5. (I) Seahorse assay showing OCR after 40 minutes of 5 μM of STAT3i-treated LSCs in the presence or absence of media supplemented with 10× glutamine. These conditions were then recapitulated in the presence of a plasma membrane permeabilizer (n = 4). Statistical analyses were performed using the Student t-test. P values are represented as follows: *P ≤ .05; **P ≤ .01; ***P ≤ .001; ****P ≤ .0001.
To test this hypothesis, we tested our RNA-sequencing dataset and found that the sodium-dependent neutral amino acid transporter, SLC1A5, was significantly downregulated upon STAT3 inhibition (supplemental Figure 3G), and expression analysis from the BloodSpot database showed substantial upregulation of this transporter in AML cells (Figure 3D), suggesting a possible dependence. SLC1A5 is a cell surface solute–carrying transporter that mediates uptake of neutral amino acids and is known to transport glutamine in rapidly proliferating tumor cells.44 To validate this finding, we performed western blot tests on LSCs after 4 hours of culture with 5 μM of STAT3i. Significant downregulation of SLC1A5 was observed at the protein level (Figure 3E). Because previous studies in other systems have shown that SLC1A5 can be regulated by MYC,45,46 we tested whether this relationship was also evident in AML cells. Upon MYC inhibition by siRNA, we observed a decrease in SLC1A5 at the protein level (Figure 3F), suggesting that SLC1A5 is regulated by MYC. On the other hand, although MYC has been shown to regulate glutaminase, which mediates the conversion from glutamine to glutamate, STAT3 inhibition did not appear to affect protein levels of glutaminase in LSCs (supplemental Figure 3H). These data suggest that STAT3 regulates MYC, which in turn regulates SCL1A5 and the influx of glutamine into LSCs, ultimately leading to decreased glutamate, α-ketoglutarate, and GSH levels.
To further confirm that this is the pathway by which STAT3 inhibition leads to a decrease in glutaminolysis, we knocked down SLC1A5 in primary AML cells, which resulted in a marked decrease in glutamine and its downstream metabolites (Figure 3G-H). As expected, the addition of excess glutamine to cell culture in the context of STAT3 inhibition did not rescue the OXPHOS activity as measured by Seahorse assays (Figure 3I) because intake of this amino acid is reduced by less availability of its transporter. However, using a cell permeabilizer agent to allow transporter-independent intake of glutamine did rescue the OXPHOS activity of LSCs, suggesting that glutamine is an important driver of STAT3-mediated OXPHOS activity. To confirm the STAT3-MYC axis is involved in glutaminolysis leading to regulation of OXPHOS, we overexpressed Myc to determine whether we could rescue the OXPHOS phenotype. This was performed in the cell line MOLM-13 for feasibility. Even a modest increase in MYC expression (supplemental Figure 3I-J) led to a partial rescue of OXPHOS activity (supplemental Figure 3K) and viability (supplemental Figure 3L) upon STAT3 inhibition.
STAT3-mediated TCA cycle changes lead to ETC dysfunction
We next sought to test whether STAT3-mediated TCA cycle changes affect ETC activity. Upon culturing 3 primary AML samples with 5 μM of STAT3i or vehicle control for 4 hours, we observed a decrease in ETC complex I, II, and III activity in STAT3-inhibited cells at 4 hours, but no decrease was seen in complex V activity (Figure 4A). This finding is consistent with the metabolomics findings of decreased glutamate and decreased succinate that serve as substrates for complexes I and II/III, respectively. Further, the addition of cell-permeable glutamine and α-ketoglutarate rescued the effect of STAT3 in ETC complex II/III (Figure 4B), suggesting that this effect is TCA cycle mediated. Consistent with reduction of ETC activity upon STAT3i, mitochondrial ROS was reduced upon STAT3 inhibition based on MitoSox stain, as shown in Figure 4C. Because STAT3 is a transcription factor, we questioned whether changes seen in the ETC activity could be related to expression changes of genes belonging to the ETC complexes, some of which are encoded in the nucleus and others in the mitochondria. We therefore probed our RNA-sequencing data, which showed no change in expression for most ETC genes in LSCs treated with STAT3i (data not shown). This result was validated by qPCR, which showed that most ETC complex genes are unchanged, with the exception of UQCC3, which belongs to complex III (Figure 4D).
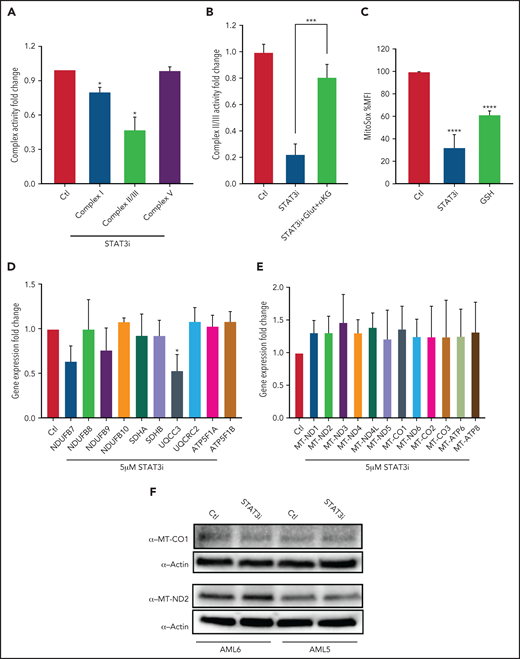
STAT3 regulates ETC activity of LSCs. (A) Bar graph representing complex activity of complexes I, II/III, and V in 3 primary AML samples after treatment with 5 μM STAT3i or vehicle control for 4 hours. (B) Complex II/II activity of 3 primary AML samples treated with 5 μM STAT3i or vehicle control for 4 hours. Cells were incubated on metabolomics media or in the presence of 4 mM glutamine and 4 mM cell-permeable α-KG. (C) Mitochondrial ROS as measured by flow cytometry in LSCs isolated from 3 primary AML samples and treated with 5 μM of STAT3i for 4 hours compared with vehicle control; 4 μM of cell-permeable GSH was used as positive control. (D) qPCR showing gene expression of ETC complex genes in LSCs isolated from 3 primary AML samples and treated with 5 μM of STAT3i for 4 hours or vehicle control. (E) Gene expression from RNA sequencing of mitochondrial genes in LSCs treated with 5 μM of STAT3i for 4 hours or vehicle control (n = 4). (F) Western blot showing protein levels of MT-CO1 and MT-ND2 in LSCs treated with or without 5 μM of STAT3i for 4 hours. Statistical analyses were performed using the Student t-test. P values are represented as follows: *P ≤ .05; **P ≤ .01; ***P ≤ .001; ****P ≤ .0001.
STAT3 regulates ETC activity of LSCs. (A) Bar graph representing complex activity of complexes I, II/III, and V in 3 primary AML samples after treatment with 5 μM STAT3i or vehicle control for 4 hours. (B) Complex II/II activity of 3 primary AML samples treated with 5 μM STAT3i or vehicle control for 4 hours. Cells were incubated on metabolomics media or in the presence of 4 mM glutamine and 4 mM cell-permeable α-KG. (C) Mitochondrial ROS as measured by flow cytometry in LSCs isolated from 3 primary AML samples and treated with 5 μM of STAT3i for 4 hours compared with vehicle control; 4 μM of cell-permeable GSH was used as positive control. (D) qPCR showing gene expression of ETC complex genes in LSCs isolated from 3 primary AML samples and treated with 5 μM of STAT3i for 4 hours or vehicle control. (E) Gene expression from RNA sequencing of mitochondrial genes in LSCs treated with 5 μM of STAT3i for 4 hours or vehicle control (n = 4). (F) Western blot showing protein levels of MT-CO1 and MT-ND2 in LSCs treated with or without 5 μM of STAT3i for 4 hours. Statistical analyses were performed using the Student t-test. P values are represented as follows: *P ≤ .05; **P ≤ .01; ***P ≤ .001; ****P ≤ .0001.
Because STAT3 has also been shown to localize to the mitochondria and modulate expression of mitochondrial genes in other tissues,22 we also tested whether these genes were changed upon STAT3 inhibition. Although we confirmed that STAT3 is phosphorylated at S727 (supplemental Figure 4A) and localizes to the mitochondria of primary AML cells (supplemental Figure 4B), gene expression analysis of our RNA-sequencing data showed no decrease in mitochondrial-encoded ETC genes upon STAT3 inhibition (Figure 4E). Similarly, we confirmed no change at the protein level of 2 representative mitochondrial ETC genes, MT-CO1 and MT-ND2 (Figure 4F). We further confirmed this finding by using siRNA-mediated knockdown of mitochondrial STAT3, which showed no change in mitochondrial protein expression of MT-CO1 (supplemental Figure 4C). These data suggest that the decrease in ETC activity seen upon STAT3 inhibition is likely mediated by TCA cycle changes.
Inhibition of STAT3 leads to selective killing of LSCs compared with HSCs
We next investigated whether STAT3 activity influences the survival of AML stem and progenitor cells. As shown in Figure 5A, primary ROS-low AML specimens cultured with 5 μM of STAT3i for 24 hours showed a significant decrease in viability as assessed by flow cytometry, and there was no difference in the efficacy of STAT3i-mediated cytotoxicity in samples from newly diagnosed patients compared with specimens from patients who experienced relapse after chemotherapy. Further viability of a paired sample showed that its sensitivity to STAT3i was unchanged in the same patient at the time of diagnosis vs time of relapse (supplemental Figure 5A). This finding suggests that STAT3i is equally efficacious in the chemoresistant setting. Similar results were also seen in LSCs isolated from leukapheresis samples compared with LSCs isolated from bone marrow samples (Figure 5A and supplemental Figure 5B, respectively), suggesting that the proliferative state of the patient sample does not affect sensitivity to STAT3 inhibition. Furthermore, culturing primary AML cells with 5 μM of STAT3i overnight, followed by progenitor analysis in colony-formation assays, showed a significant reduction in colony-forming units (Figure 5B). Similarly, colony formation was decreased by shRNA-mediated knockdown of STAT3 in primary human AML cells (Figure 5C-D), further supporting a direct role for STAT3 in maintaining the viability of primitive cells. This result contrasted normal hematopoietic stem and progenitor cells (HSPCs), which showed no significant cell death and no decrease in colony formation upon STAT3 inhibition (Figure 5E-F). These findings indicate that STAT3 is a selective target for LSCs.
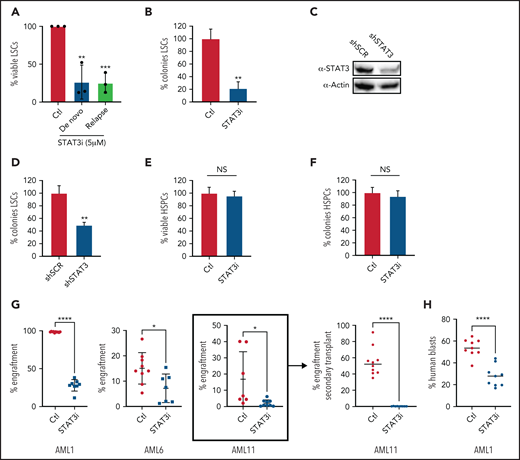
Inhibition of STAT3 leads to selective eradication of LSCs compared with HSPCs. (A) Viability of LSCs isolated from 6 primary human AML samples, 3 at the time of diagnosis and 3 at the time of relapse, after 24-hour treatment with 5 µM of STAT3i compared with vehicle control. (B) Percent number of colonies from 3 primary AML samples treated with 5µM of STAT3i or vehicle control for 24 hours and plated in human methylcellulose media for up to 14 days. (C) Western blot showing protein level of STAT3 after treatment with shRNA against STAT3 or scramble control (shSCR). (D) Percent number of colonies in 3 primary AML samples treated with either shSTAT3 or shSCR. (E) Viability of CD34+ cells (HSPCs) isolated from 3 human cord blood samples and treated with 5 µM of STAT3i vs vehicle control after 24 hours. NS, not significant. (F) Percent colonies of HSPCs isolated from 3 cord blood samples and treated with either 5 µM of STAT3i or vehicle control for 24 hours and plated in human methylcellulose media for up to 14 days. (G) Percent engraftment at 8 to 10 weeks of 3 primary AML samples pretreated with either 5 μM of STAT3i or vehicle control overnight and injected into busulfan-treated NSG-S mice. The sample in bracket was used for secondary transplant, which shows complete eradication of LSCs. (H) Percent human blasts in mice engrafted with a primary AML samples and treated in vivo with 30 mg/kg of STAT3i or vehicle control intraperitoneally daily for 6 days. Statistical analyses were performed using the Student t-test. P values are represented as follows: *P ≤ .05; **P ≤ .01; ***P ≤ .001; ****P ≤ .0001.
Inhibition of STAT3 leads to selective eradication of LSCs compared with HSPCs. (A) Viability of LSCs isolated from 6 primary human AML samples, 3 at the time of diagnosis and 3 at the time of relapse, after 24-hour treatment with 5 µM of STAT3i compared with vehicle control. (B) Percent number of colonies from 3 primary AML samples treated with 5µM of STAT3i or vehicle control for 24 hours and plated in human methylcellulose media for up to 14 days. (C) Western blot showing protein level of STAT3 after treatment with shRNA against STAT3 or scramble control (shSCR). (D) Percent number of colonies in 3 primary AML samples treated with either shSTAT3 or shSCR. (E) Viability of CD34+ cells (HSPCs) isolated from 3 human cord blood samples and treated with 5 µM of STAT3i vs vehicle control after 24 hours. NS, not significant. (F) Percent colonies of HSPCs isolated from 3 cord blood samples and treated with either 5 µM of STAT3i or vehicle control for 24 hours and plated in human methylcellulose media for up to 14 days. (G) Percent engraftment at 8 to 10 weeks of 3 primary AML samples pretreated with either 5 μM of STAT3i or vehicle control overnight and injected into busulfan-treated NSG-S mice. The sample in bracket was used for secondary transplant, which shows complete eradication of LSCs. (H) Percent human blasts in mice engrafted with a primary AML samples and treated in vivo with 30 mg/kg of STAT3i or vehicle control intraperitoneally daily for 6 days. Statistical analyses were performed using the Student t-test. P values are represented as follows: *P ≤ .05; **P ≤ .01; ***P ≤ .001; ****P ≤ .0001.
To directly test the impact of STAT3 inhibition on LSC function, we transplanted control and STAT3i-treated AML cells from 3 different patients into immunodeficient NSG-S mice and measured their engraftment ability.3,47 At 8 to 10 weeks after transplant, engraftment was measured as percentage of human blasts in total mononuclear cells in the bone marrow of experimental mice. These results showed a significant decrease of engraftment in the STAT3i-treated group (Figure 5G), suggesting loss of LSC potential as a consequence of STAT3 inhibition. Further, cells isolated from engrafted mice (Figure 5G, bracket) were used for a secondary transplant, which showed complete eradication of blast cells. To show that STAT3i also has in vivo activity, we first engrafted mice with a primary AML sample, followed by intraperitoneal treatment of STAT3i at 30 mg/kg or vehicle control for 6 days. As shown in Figure 5H, a short course of STAT3i treatment led to significant death of blast cells from AML-engrafted mice.
Discussion
STAT3 is an important transcription factor involved in proliferation and transformation of cancer cells,14,16,41,48 although its role in mitochondrial function is less well understood. In this study, we confirmed prior reports that STAT3 is highly expressed and activated in primary human AML samples and identified a role for STAT3 in regulation of mitochondrial function. We showed that blocking the transcriptional activity of STAT3 affects mitochondrial function via regulation of the TCA cycle and regulation of the ETC. The effect of STAT3 on the TCA cycle is mediated by its regulation of MYC expression, which, in turn, regulates the amino acid transporter SLC1A5.46 This transporter is responsible for the influx of various amino acids into LSCs and is particularly important for glutamine intake. Glutaminolysis has previously been shown to be important for cancer cells, including AML,12,30,31,49-51 because the process results in production of α-ketoglutarate, which is crucial for TCA cycle activity.
Other TCA cycle intermediates such as succinate are also decreased upon STAT3 inhibition, thereby affecting the ETC activity of complexes I, II and III. This hypothesized mechanism is depicted in Figure 6. GSH, which is essential for LSCs as previously shown,13,52 is also decreased upon STAT3 inhibition. GSH is known to regulate succinate dehydrogenase A by S-glutathionylation,13 and a decrease in GSH could further contribute to a decrease in ETC complex activity of LSCs. The decrease in OXPHOS as a result of STAT3 inhibition likely contributes to a decrease in LSC viability because LSCs have a unique metabolic dependency on OXPHOS for energy production. Importantly, we have previously shown that depletion of glutamine alone is not sufficient to eradicate LSCs,12 likely because of compensation from other amino acids such as glutamate, aspartate, and cysteine. However, we propose that in the context of STAT3, inhibition cells are unable to fully compensate given their decreased expression of aspartate aminotransferase, which is consistent with less formation of glutamate. These studies highlight the finding that although STAT3 is a transcription factor, it indirectly exerts regulatory mitochondrial functions that are critical to LSCs. Other potential roles of STAT3 in mitochondrial function as suggested by our RNA-sequencing data or localization of STAT3 to the mitochondria remain to be investigated, and possible off-target effects of our STAT3i compound that could be contributing to the metabolic changes seen in LSCs have not been further explored.
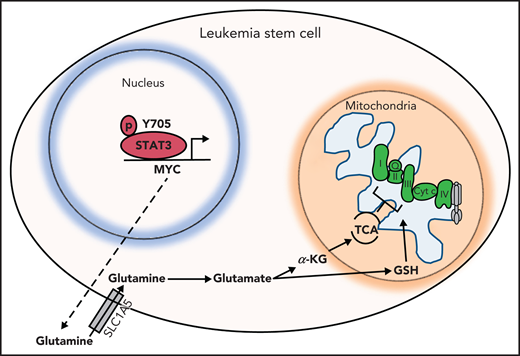
Hypothesized model. STAT3 is phosphorylated at Y705, which signals its localization to the nucleus to regulate the expression of several genes, including MYC. MYC, in turn, promotes expression of the amino acid transporter SLC1A5, allowing influx of glutamine into the cell and, ultimately, abundance of TCA cycle intermediates and GSH. TCA cycle intermediates then promote OXPHOS by ETC activity. GSH is known to promote glutathionylation of the ETC complex II, which is important for its activity. Upon inhibition of STAT3, glutaminolysis is compromised, decreasing levels of glutamate, GSH, and TCA cycle intermediates, thereby decreasing OXPHOS in LSCs.
Hypothesized model. STAT3 is phosphorylated at Y705, which signals its localization to the nucleus to regulate the expression of several genes, including MYC. MYC, in turn, promotes expression of the amino acid transporter SLC1A5, allowing influx of glutamine into the cell and, ultimately, abundance of TCA cycle intermediates and GSH. TCA cycle intermediates then promote OXPHOS by ETC activity. GSH is known to promote glutathionylation of the ETC complex II, which is important for its activity. Upon inhibition of STAT3, glutaminolysis is compromised, decreasing levels of glutamate, GSH, and TCA cycle intermediates, thereby decreasing OXPHOS in LSCs.
In terms of clinical potential, targeting STAT3 leads to effective killing of both the bulk leukemia and the LSC population of primary AML samples but has no identifiable impact on the normal HSPC population. Although longer term studies are needed to further corroborate a lack of effect of STAT3 inhibition in normal HSPCs, our studies suggest that inhibition of STAT3 is a potentially useful target for therapy. Further, sensitivity of STAT3 does not appear to change between newly diagnosed AML or chemoresistant cells, broadening its potential application to patients whose front-line chemotherapy regimens have failed. In the future, it will be important to determine whether STAT3 inhibition can have longer term added toxicities and whether it can be used in combination with current standard of therapy treatments.
In conclusion, we have shown a distinct role for STAT3 in regulating mitochondrial function of AML bulk and LSCs, which occurs via an MYC-SLC1A5–mediated pathway. This important STAT3 function could be used to target the LSC vulnerability of OXPHOS dependence and thereby serve as a potential new therapy for patients with AML.
Acknowledgments
The authors acknowledge expert review by Mercedes Rincon.
This work was supported by the National Cancer Institute, National Institutes of Health (grant T32CA190216-4) (M.L.A.), the National Cancer Institute, National Institutes of Health (Ruth L. Kirschstein National Research Service Award, grant T32CA190216) and Colorado Clinical and Translational Sciences Institute (grant TL1TR002533) (A.I.), the Morgan Adams Foundation (S.L.F.), the Leukemia and Lymphoma Society’s Scholar in Clinical Research and the Robert H. Allen Chair in Hematology Research (D.A.P.), and the National Cancer Institute, National Institutes of Health (grants R01CA200707, R35CA242376, and P30CA046934), a Leukemia and Lymphoma Society Specialized Center of Research (SCOR) grant, and the Nancy Carroll Allen Endowed Chair (C.T.J.).
Authorship
Contribution: M.L.A. and C.T.J. designed the research; M.L.A., A.I., S.P., C.J., A.K., F.G., S.L.F., B.S., and A.D. performed and/or analyzed experiments; P.R. and S.L.F. designed and synthesized SF25; M.L.A. prepared the figures; and M.L.A. and C.T.J. wrote the manuscript with input from S.P., A.I., P.R., A.D., D.A.P., H.Y., M.M., and A.W.
Conflict-of-interest disclosure: The authors declare no competing financial interests.
Correspondence: Maria L. Amaya, Division of Hematology, University of Colorado Anschutz Medical Campus, 12700 E 19th Ave, Room 9122, RC2 MS B170, Aurora, CO 80045; e-mail: maria.l.amaya@cuanschutz.edu.
For original data, please contact maria.l.amaya@cuanschutz.edu.
RNA-sequencing data are deposited in Gene Expression Omnibus (accession number: GSE183036).
The online version of this article contains a data supplement.
The publication costs of this article were defrayed in part by page charge payment. Therefore, and solely to indicate this fact, this article is hereby marked “advertisement” in accordance with 18 USC section 1734.

This feature is available to Subscribers Only
Sign In or Create an Account Close Modal