

Key Points
FIP1L1 knockdown reverses global APA dysregulation in t(8;21) AML and promotes differentiation by 3'UTR lengthening of AML1-ETO.
Targeting APA induces differentiation across AML subtypes by downregulation of MYC and attenuation of oncogenic growth signaling pathways.

Abstract
Posttranscriptional regulation has emerged as a driver for leukemia development and an avenue for therapeutic targeting. Among posttranscriptional processes, alternative polyadenylation (APA) is globally dysregulated across cancer types. However, limited studies have focused on the prevalence and role of APA in myeloid leukemia. Furthermore, it is poorly understood how altered poly(A) site usage of individual genes contributes to malignancy or whether targeting global APA patterns might alter oncogenic potential. In this study, we examined global APA dysregulation in patients with acute myeloid leukemia (AML) by performing 3' region extraction and deep sequencing (3'READS) on a subset of AML patient samples along with healthy hematopoietic stem and progenitor cells (HSPCs) and by analyzing publicly available data from a broad AML patient cohort. We show that patient cells exhibit global 3' untranslated region (UTR) shortening and coding sequence lengthening due to differences in poly(A) site (PAS) usage. Among APA regulators, expression of FIP1L1, one of the core cleavage and polyadenylation factors, correlated with the degree of APA dysregulation in our 3'READS data set. Targeting global APA by FIP1L1 knockdown reversed the global trends seen in patients. Importantly, FIP1L1 knockdown induced differentiation of t(8;21) cells by promoting 3'UTR lengthening and downregulation of the fusion oncoprotein AML1-ETO. In non-t(8;21) cells, FIP1L1 knockdown also promoted differentiation by attenuating mechanistic target of rapamycin complex 1 (mTORC1) signaling and reducing MYC protein levels. Our study provides mechanistic insights into the role of APA in AML pathogenesis and indicates that targeting global APA patterns can overcome the differentiation block in patients with AML.
Introduction
Posttranscriptional regulation is an emerging field of study in normal and malignant hematopoiesis.1 Among posttranscriptional processes, splicing regulation has been the predominant focus, owing to the high instance of splice factor mutations across hematologic malignancies.2 In addition, RNA-editing,3 RNA-methylation,4 and microRNA (miRNA) regulation5 have been linked to proper hematopoietic stem cell (HSC) homeostasis. Despite the importance of posttranscriptional regulation in hematopoietic systems, there has been comparatively little attention paid to the process of alternative polyadenylation (APA), and studies have exclusively focused on APA in lymphocytes.6-12 Furthermore, it is unknown whether polyadenylation regulators contribute to myeloid cell development or myeloid leukemia.
APA is a widespread posttranscriptional mechanism, with the potential to regulate most human genes.13 Differences in poly(A) site (PAS) usage in the 3' untranslated region (3'UTR), mostly in the 3'-most exon, can alter transcript stability,9,14 localization,15 translation efficiency,16 and protein complex formation.12 In addition, PAS usage upstream of the 3'-most exon, chiefly in introns, diversifies the proteome by producing C-terminally truncated proteins with distinct functions10,11 or leads to unstable transcripts, inhibiting gene expression. APA plays a critical role in normal cellular differentiation and cancer transformation. Global PAS profiling reveals that transcript expression signatures shift from proximal to distal PAS usage during normal cellular differentiation.17-19 The opposite shift occurs during cellular transformation, linking transcript shortening to proliferative cellular states.9,20-23
Thus far, the mechanistic link between APA alteration and oncogenic transformation is incomplete. One common explanation is that 3'UTR shortening contributes to oncogene upregulation when affected transcripts evade normal miRNA-mediated degradation.9,14 In addition, global coding sequence (CDS) shortening by enhanced usage of intronic PASs reportedly inactivates tumor suppressor genes in cancer cells.11 Although these have been shown for some genes, oncogenes do not always have shorter 3'UTRs, and tumor suppressors are not the only genes that have shorter CDS due to APA. Thus, the collective contribution of global APA dysregulation on cellular transformation is still elusive.
Acute myeloid leukemia (AML) is a cancer characterized by a hallmark block in differentiation.24 Consequently, there is great clinical interest in developing therapies that promote differentiation of leukemia cells. Among reported differentiating agents, success has been limited to all-trans retinoic acid25 and arsenic trioxide26 in patients with acute promyelocytic leukemia (APL), and more recently isocitrate dehydrogenase (IDH) inhibitors in patients with IDH-mutant AML.27-29 Despite the promising efficacy of these therapies, the percentage of patients that can benefit from them is limited. It is therefore clinically important to identify additional targetable pathways mediating the differentiation block of AML.
Here, we analyzed PAS usage in several AML patient subtypes compared with healthy hematopoietic cells and report global dysregulation of APA in myeloid leukemia. Among the core cleavage and polyadenylation factors, we found that FIP1L1 messenger RNA (mRNA) expression was correlated with 3'UTR shortening in the patient cohort we examined by using 3' region extraction and deep sequencing (3'READS). Disruption of global APA dysregulation by FIP1L1 knockdown led to leukemia cell differentiation, supporting an underappreciated role of APA in blocking the normal maturation of cancer cells. We also identified 3'UTR-APA regulation of AML1-ETO expression, a key AML oncofusion gene that contributes to this observed differentiation block. Finally, by disrupting global APA patterns, we detected downregulation of MYC and mechanistic target of rapamycin complex 1 (mTORC1) signaling across AML cells of diverse mutational contexts, linking dysregulated APA to leukemia cell phenotypes. Our findings underline the importance of posttranscriptional mechanisms in leukemia development and propose APA as a putative therapeutic target for inducing differentiation in patients with AML.
Methods
A complete description of all methods is presented in the supplemental Methods (available on the Blood Web site).
Primary patient samples and healthy hematopoietic stem and progenitor cells
AML samples were obtained from patients at UC San Diego Health with written consent and in accordance with a university-approved Institutional Review Board protocol. After collection of peripheral blood or bone marrow, cells were separated by using Ficoll-Paque (17-1440-02; VWR) and frozen until further use. Patient cells were thawed quickly at 37°C, diluted in 1× phosphate-buffered saline supplemented with 1 mg/mL DNase (1184932001; Sigma) and washed with 1× phosphate-buffered saline supplemented with 2% fetal bovine serum. Live, mononuclear cells were separated by using Ficoll-Paque and washed again. Magnetic bead CD34 enrichment was performed by using the MACS Miltenyi Kit (130-046-702). An aliquot of CD34-enriched leukemic blasts was analyzed by using flow cytometry to confirm that cells were >95% CD34+. RNA was extracted from patient blasts using TRIzol reagent (15596026; Thermo Fisher Scientific).
Cryopreserved, previously enriched CD34+ hematopoietic stem and progenitor cells (HSPCs) from healthy donors were obtained from Fred Hutchinson Cooperative Center for Excellence in Hematology. All HSPC samples were >95% CD34+. Cells were thawed quickly and serially diluted with 1× phosphate-buffered saline supplemented with 2% fetal bovine serum. Cells were resuspended in TRIzol for RNA extraction.
Results
APA is globally dysregulated in patients with AML
To assess the prevalence of APA dysregulation in AML, we first performed 3'READS30,31 and standard RNA-sequencing on enriched AML patient blasts (CD34+) and healthy HSPCs (Figure 1A; supplemental Figure 1A-B). Because blasts from patients with AML are heterogeneous, we selected 4 patient samples that commonly carried the t(8;21) translocation generating the AML1-ETO fusion oncoprotein and 4 non-t(8;21) samples with variable mutations (supplemental Table 1). Compared with healthy HSPCs, both groups of patients exhibited dysregulated APA of numerous genes with an overall trend of 3'UTR shortening, which has been reported in various cancer types14,22 (Figure 1B; supplemental Figure 1C). Patient blasts also exhibited CDS lengthening, which was similarly seen in multiple myeloma samples.10 However, both trends are opposite of those reported in chronic lymphocytic leukemia samples,11,12 highlighting the importance of disease-specific PAS profiling. To further study APA trends in a broader cohort of patients with AML, we analyzed the publicly available BeatAML data set. Across patient subsets, defined by the presence or absence of common AML fusion proteins, 3'UTR shortening was observed in patients compared with healthy bone marrow (supplemental Figure 2A). CDS lengthening was also seen in most patient groups, supporting the prevalence of this trend across AML subtypes (supplemental Figure 2B).
![Alternative polyadenylation is apparent in AML patient samples, affecting genes that promote leukemia development. (A) Schematic of AML patient samples and healthy HSPCs used for 3'READS and/or RNA-sequencing. (B) Scatter plot showing the change in expression of the proximal poly(A) site (pPAS) isoform (x-axis) and distal poly(A) site (dPAS) isoform (y-axis), per gene, in t(8;21) AML patient blasts compared with healthy HSPCs. Significant APA events (Fisher’s exact test, P < .05) are classified and divided according to type: 3'UTR-APA (left) and CDS-APA (right). Each dot corresponds to a single gene. Blue dots indicate significantly more pPAS usage; red dots indicate significantly more dPAS usage. (C) Venn diagrams showing the overlap of genes with 3'UTR shortening and CDS lengthening in t(8;21) AML blasts and non-t(8;21) AML blasts compared with healthy HSPCs. (D) Genome browser tracks depicting normalized sequencing reads (reads per million [RPM]) in the BAALC gene obtained from 3'READS of HSPCs and AML patient blasts. The full BAALC genomic structure is shown (top) with the purple, boxed region expanded (below). The percent usage of each indicated PAS was calculated by using 3'READS and is shown in the bar graph to the right. n = 2, HSPCs; n = 4, t(8;21) and non-t(8;21) AML patient samples. (E) Relative ratio of Renilla to firefly luciferase activity in Kasumi-1 cells nucleofected with the indicated dual luciferase reporter. Red bars represent activity when the full 3'UTR of the indicated gene was subcloned downstream of Renilla luciferase; blue bars represent activity when the shortened 3'UTR was present. Data are mean ± standard deviation of 3 independent experiments. ***P < .001, Student t test. (F) Genome browser tracks depicting normalized sequencing reads (RPM) in the CUL4A gene obtained from 3'READS of HSPCs and AML patient blasts. The proximal, intronic PAS is boxed. The percent usage of each indicated PAS was calculated by using 3'READS and is shown in the bar graph to the right. n = 2, HSPCs; n = 4, t(8;21) and non-t(8;21) AML patient samples.](https://ash.silverchair-cdn.com/ash/content_public/journal/blood/139/3/10.1182_blood.2020005693/4/m_bloodbld2020005693f1.png?Expires=1769112564&Signature=q37HG~aC7Qo1J11aRJCR1Ur3zfKXxMUGRzdL40yjxQQM~BNo7cpaxvk26Vx9KDHqdtNweL4Jjd~q7uJlV~5JOxkSsBiPB3vdbIj-Grjpz70MsRAI4-yKj9~QZuCUt-zl8lyPmu5In7QqgSHeWAAMHQXTnFpoQdGfxBRKqbldxpIReCkjKB~KxJ9uhtNnoAyhpj6ks8~XILep8zSMT02M1Yzcr5yM3iH-sZyStsvRP2n2NbGBYlKpRxzDM70IGJk6S2VrkcmY-P9Wtp6IUdax~SNP0KHcF-lvuuF-xEKTN6Xm5xYH~u~DDpHRmivxcN5tsYIIWkK8pxPG-MC8ojJrvA__&Key-Pair-Id=APKAIE5G5CRDK6RD3PGA)
Alternative polyadenylation is apparent in AML patient samples, affecting genes that promote leukemia development. (A) Schematic of AML patient samples and healthy HSPCs used for 3'READS and/or RNA-sequencing. (B) Scatter plot showing the change in expression of the proximal poly(A) site (pPAS) isoform (x-axis) and distal poly(A) site (dPAS) isoform (y-axis), per gene, in t(8;21) AML patient blasts compared with healthy HSPCs. Significant APA events (Fisher’s exact test, P < .05) are classified and divided according to type: 3'UTR-APA (left) and CDS-APA (right). Each dot corresponds to a single gene. Blue dots indicate significantly more pPAS usage; red dots indicate significantly more dPAS usage. (C) Venn diagrams showing the overlap of genes with 3'UTR shortening and CDS lengthening in t(8;21) AML blasts and non-t(8;21) AML blasts compared with healthy HSPCs. (D) Genome browser tracks depicting normalized sequencing reads (reads per million [RPM]) in the BAALC gene obtained from 3'READS of HSPCs and AML patient blasts. The full BAALC genomic structure is shown (top) with the purple, boxed region expanded (below). The percent usage of each indicated PAS was calculated by using 3'READS and is shown in the bar graph to the right. n = 2, HSPCs; n = 4, t(8;21) and non-t(8;21) AML patient samples. (E) Relative ratio of Renilla to firefly luciferase activity in Kasumi-1 cells nucleofected with the indicated dual luciferase reporter. Red bars represent activity when the full 3'UTR of the indicated gene was subcloned downstream of Renilla luciferase; blue bars represent activity when the shortened 3'UTR was present. Data are mean ± standard deviation of 3 independent experiments. ***P < .001, Student t test. (F) Genome browser tracks depicting normalized sequencing reads (RPM) in the CUL4A gene obtained from 3'READS of HSPCs and AML patient blasts. The proximal, intronic PAS is boxed. The percent usage of each indicated PAS was calculated by using 3'READS and is shown in the bar graph to the right. n = 2, HSPCs; n = 4, t(8;21) and non-t(8;21) AML patient samples.
Alternative polyadenylation is apparent in AML patient samples, affecting genes that promote leukemia development. (A) Schematic of AML patient samples and healthy HSPCs used for 3'READS and/or RNA-sequencing. (B) Scatter plot showing the change in expression of the proximal poly(A) site (pPAS) isoform (x-axis) and distal poly(A) site (dPAS) isoform (y-axis), per gene, in t(8;21) AML patient blasts compared with healthy HSPCs. Significant APA events (Fisher’s exact test, P < .05) are classified and divided according to type: 3'UTR-APA (left) and CDS-APA (right). Each dot corresponds to a single gene. Blue dots indicate significantly more pPAS usage; red dots indicate significantly more dPAS usage. (C) Venn diagrams showing the overlap of genes with 3'UTR shortening and CDS lengthening in t(8;21) AML blasts and non-t(8;21) AML blasts compared with healthy HSPCs. (D) Genome browser tracks depicting normalized sequencing reads (reads per million [RPM]) in the BAALC gene obtained from 3'READS of HSPCs and AML patient blasts. The full BAALC genomic structure is shown (top) with the purple, boxed region expanded (below). The percent usage of each indicated PAS was calculated by using 3'READS and is shown in the bar graph to the right. n = 2, HSPCs; n = 4, t(8;21) and non-t(8;21) AML patient samples. (E) Relative ratio of Renilla to firefly luciferase activity in Kasumi-1 cells nucleofected with the indicated dual luciferase reporter. Red bars represent activity when the full 3'UTR of the indicated gene was subcloned downstream of Renilla luciferase; blue bars represent activity when the shortened 3'UTR was present. Data are mean ± standard deviation of 3 independent experiments. ***P < .001, Student t test. (F) Genome browser tracks depicting normalized sequencing reads (RPM) in the CUL4A gene obtained from 3'READS of HSPCs and AML patient blasts. The proximal, intronic PAS is boxed. The percent usage of each indicated PAS was calculated by using 3'READS and is shown in the bar graph to the right. n = 2, HSPCs; n = 4, t(8;21) and non-t(8;21) AML patient samples.
Dysregulated APA affects oncogenic pathways and genes in patients with AML
In our 3'READS data set, many genes were similarly shortened or lengthened in t(8;21) and non-t(8;21) patients (Figure 1C). To evaluate whether the observed changes in APA might contribute to pathogenesis, pathway enrichment was performed on the common genes that exhibited 3'UTR shortening or CDS lengthening. Significantly enriched pathways included those related to cell cycle, differentiation, and oncogenic signaling pathways, supporting a likely role of APA in leukemia (supplemental Table 2). We next sought to identify specific genes with altered PAS usage that might contribute to disease. 3'UTR-APA regulates gene expression by altering the presence of 3'UTR regions that bind miRNAs or RNA-binding proteins (RBPs), which modulate transcript stability and/or translation efficiency.17,32 In cancer, global 3'UTR shortening by APA reportedly induces oncogene upregulation by transcript evasion of miRNAs or suppressive RBPs.9,14,16,33 Among genes that exhibited significant 3'UTR shortening in our 3'READS data set, we identified BAALC, a negative prognostic marker in AML34,35 that blocks AML cell differentiation,36,37 and MAPKAPK3, a MAPK signaling node that contributes to the characteristic differentiation block of t(8;21) AML38 (Figure 1D; supplemental Figure 3A-C). Because 3'UTR length is not always predictive of protein output,39,40 we tested whether 3'UTR length can contribute to the expression of these leukemia-promoting genes. We subcloned the short and long 3'UTR variants downstream of Renilla luciferase in a dual luciferase reporter and compared the effect on protein output. For both genes, the shorter 3'UTR produced significantly more Renilla protein than the longer 3'UTR, confirming a direct role of APA on gene expression (Figure 1E).
As with 3'UTR-APA, intronic APA can also affect gene expression when premature cleavage and polyadenylation results in a truncated protein product that lacks crucial functional domains.11,41 In cancer, global CDS shortening by intronic polyadenylation inactivates tumor suppressor genes.11 We observed the opposite overall trend of CDS lengthening in patients with AML and reasoned that activation of oncogenes is also a possibility. Among genes with significant CDS lengthening in our 3'READS data set, we identified CUL4A, an oncogenic E3 ubiquitin ligase that promotes proliferation and blocks differentiation in hematopoietic models.42,43 We also identified FOXP1, a transcription factor that is a negative prognostic marker in patients with AML,44 suppresses cell cycle inhibitors in myeloid leukemia cells,45 and plays an oncogenic role in diffuse large B-cell lymphoma46 (Figure 1F; supplemental Figure 3D-F). Usage of the proximal intronic PAS in each case would result in a severely truncated protein that is expected to be dysfunctional10 (supplemental Figure 3G). Altogether, we saw pronounced differences in PAS usage between patient blasts and healthy control subjects and identified specific genes that could reasonably contribute to pathogenesis.
Targeting FIP1L1 reverses APA trends in t(8;21) AML
Although altered posttranscriptional regulation of individual gene targets contributes to oncogenic transformation, the sum of small changes can also collectively promote pathogenesis. We therefore wanted to test whether targeting global polyadenylation patterns might have antileukemic effects. We first selected a common APA regulator to target by using our patient 3'READS and RNA-sequencing data sets. Because 3'UTR shortening is a common feature observed in many cancer types22,47 and is also seen in our data set, we focused on the severity of shortening per patient of the overlapping 235 genes (Figure 2A; supplemental Figure 4). We observed noticeable differences in the extent of 3'UTR shortening across this set of genes, and calculated the correlation between the degree of shortening and the expression level of all APA machinery members in each patient. High FIP1L1 expression was identified as being most predictive of 3'UTR shortening (Figure 2B; supplemental Table 3). We also examined the publicly available AML data set but did not observe a broad correlation between FIP1L1 expression and 3'UTR length, suggesting that additional APA regulators likely contribute to APA dysregulation in different patients. However, because FIP1L1 knockdown induces 3'UTR lengthening in murine systems,48,49 we selected FIP1L1 as a model APA regulator to test the hypothesis that targeting global APA dysregulation may be detrimental to leukemia cells.
![Targeting FIP1L1 reverses APA trends in t(8;21) AML. (A) Extent of 3'UTR shortening, in all patient samples and primary HSPC controls, of the 235 genes with shortened 3'UTRs in both t(8;21) and non-t(8;21) patients. For each gene, the average and standard deviation (SD) of dPAS usage were determined. Z scores were then calculated and assigned to each sample in the cohort for the given gene. Each bar of the graph represents the average z score of all 235 genes in the indicated patient or healthy control, a measure of the overall degree of shortening. Data are mean ± SD. (B) Negative correlation between FIP1L1 expression, calculated by RNA-sequencing, and the extent of 3'UTR shortening per patient. Among all APA regulators, FIP1L1 expression is most correlated to 3'UTR shortening. Correlation was determined by linear regression. (C) Reverse transcription quantitative polymerase chain reaction (RT-qPCR) analysis of BAALC 3'UTR length in Kasumi-1 cells transduced with shRNAs targeting FIP1L1 [shRNA (1), (2), or (3)] or a control shRNA. Usage of either the middle or distal PAS was measured relative to total BAALC mRNA using primer pairs upstream of the middle poly(A) site (mPAS) and most proximal poly(A) site (pPAS), respectively. Relative 3'UTR length in FIP1L1 knockdown Kasumi-1 cells was normalized to 3'UTR length in cells transduced with the control shRNA. Data are mean ± SD of 3 independent experiments. *P < .05, ***P < .001, 1-way analysis of variance (ANOVA) with a post hoc Tukey test. (D) RT-qPCR analysis of total BAALC mRNA normalized to β-Actin mRNA in Kasumi-1 cells upon shRNA knockdown of FIP1L1. mRNA levels in knockdown cells were normalized to cells transduced with the control shRNA. Data are mean ± SD of 3 independent experiments. ***P < .001, one-way ANOVA with a post hoc Tukey test. (E) Western blot showing FIP1L1, BAALC, and actin (loading control) protein in Kasumi-1 cells after transduction with control shRNAs or shRNAs targeting FIP1L1. BAALC protein was quantified by normalizing BAALC signal intensity to actin signal intensity using Li-Cor Image Studio software. Normalized protein quantifications are shown in the bar graph to the right. n = 5 for shControl and shFIP1L1 (2); n = 3 for shFIP1L1 (1) and shFIP1L1 (3). Data are mean ± SD. ***P < .001, 1-way ANOVA with a post hoc Tukey test. (F) Scatter plot showing the change in expression of pPAS and dPAS isoforms, per gene, in Kasumi-1 cells after FIP1L1 knockdown. Significant differences in PAS usage were calculated by using the Fisher’s exact test, comparing PAS usage in Kasumi-1 cells transduced with both shRNAs targeting FIP1L1 vs the control shRNA. APA events are classified and divided according to type: 3'UTR-APA (top) and CDS-APA (bottom). Each dot corresponds to a single gene. Blue dots indicate significantly more pPAS usage; red dots indicate significantly more dPAS usage. (G) Venn diagrams showing: (left) the overlap of genes with 3'UTR shortening in t(8;21) AML blasts that were significantly lengthened upon FIP1L1 knockdown in Kasumi-1 cells and (right) the overlap of genes with CDS lengthening in t(8;21) AML blasts that were significantly shortened upon FIP1L1 knockdown in Kasumi-1 cells. (H) Genome browser tracks depicting normalized sequencing reads (reads per million [RPM]) in the BAALC gene obtained from 3'READS of Kasumi-1 cells transduced with a control shRNA or shRNAs targeting FIP1L1. The full BAALC genomic structure is shown (top) with the purple, boxed region expanded (below). The percent usage of each indicated PAS was calculated by using 3'READS and is shown in the bar graph to the right. n = 3, shControl and shFIP1L1 (2); n = 4 shFIP1L1 (1).](https://ash.silverchair-cdn.com/ash/content_public/journal/blood/139/3/10.1182_blood.2020005693/4/m_bloodbld2020005693f2.png?Expires=1769112564&Signature=ngZXbX8oNHRU1htx0S892QA8Gyt3UqSna9sEG0xuSVkSlHkRNBBAVpP-GGX8n20TLTYB0~vG6hkEt-pWNOxCrmgCyyffb11LnEehgJdEwG-IakrfhN5bfEvhEhEqYXXsGaolvL6r7DGTd1V79rp2ZJyF~8pzE9XY5OrnFE7GAwODIJbZq35OuJUGDH0hAKXqy6M4N2C8mrWxqdW88WFokww2xFqm2e2icEkSQScf-F2Pl9xzAOWtiVbLLKmO4RBONQmSGBw9NG3DM1Gtf~Q2cTgOdHZCDkVJ3EdGKnbaN9Rf8uebSFmTkJNv4WQ6YUTsY8UyNGxYv-fELJGR6dmlLQ__&Key-Pair-Id=APKAIE5G5CRDK6RD3PGA)
Targeting FIP1L1 reverses APA trends in t(8;21) AML. (A) Extent of 3'UTR shortening, in all patient samples and primary HSPC controls, of the 235 genes with shortened 3'UTRs in both t(8;21) and non-t(8;21) patients. For each gene, the average and standard deviation (SD) of dPAS usage were determined. Z scores were then calculated and assigned to each sample in the cohort for the given gene. Each bar of the graph represents the average z score of all 235 genes in the indicated patient or healthy control, a measure of the overall degree of shortening. Data are mean ± SD. (B) Negative correlation between FIP1L1 expression, calculated by RNA-sequencing, and the extent of 3'UTR shortening per patient. Among all APA regulators, FIP1L1 expression is most correlated to 3'UTR shortening. Correlation was determined by linear regression. (C) Reverse transcription quantitative polymerase chain reaction (RT-qPCR) analysis of BAALC 3'UTR length in Kasumi-1 cells transduced with shRNAs targeting FIP1L1 [shRNA (1), (2), or (3)] or a control shRNA. Usage of either the middle or distal PAS was measured relative to total BAALC mRNA using primer pairs upstream of the middle poly(A) site (mPAS) and most proximal poly(A) site (pPAS), respectively. Relative 3'UTR length in FIP1L1 knockdown Kasumi-1 cells was normalized to 3'UTR length in cells transduced with the control shRNA. Data are mean ± SD of 3 independent experiments. *P < .05, ***P < .001, 1-way analysis of variance (ANOVA) with a post hoc Tukey test. (D) RT-qPCR analysis of total BAALC mRNA normalized to β-Actin mRNA in Kasumi-1 cells upon shRNA knockdown of FIP1L1. mRNA levels in knockdown cells were normalized to cells transduced with the control shRNA. Data are mean ± SD of 3 independent experiments. ***P < .001, one-way ANOVA with a post hoc Tukey test. (E) Western blot showing FIP1L1, BAALC, and actin (loading control) protein in Kasumi-1 cells after transduction with control shRNAs or shRNAs targeting FIP1L1. BAALC protein was quantified by normalizing BAALC signal intensity to actin signal intensity using Li-Cor Image Studio software. Normalized protein quantifications are shown in the bar graph to the right. n = 5 for shControl and shFIP1L1 (2); n = 3 for shFIP1L1 (1) and shFIP1L1 (3). Data are mean ± SD. ***P < .001, 1-way ANOVA with a post hoc Tukey test. (F) Scatter plot showing the change in expression of pPAS and dPAS isoforms, per gene, in Kasumi-1 cells after FIP1L1 knockdown. Significant differences in PAS usage were calculated by using the Fisher’s exact test, comparing PAS usage in Kasumi-1 cells transduced with both shRNAs targeting FIP1L1 vs the control shRNA. APA events are classified and divided according to type: 3'UTR-APA (top) and CDS-APA (bottom). Each dot corresponds to a single gene. Blue dots indicate significantly more pPAS usage; red dots indicate significantly more dPAS usage. (G) Venn diagrams showing: (left) the overlap of genes with 3'UTR shortening in t(8;21) AML blasts that were significantly lengthened upon FIP1L1 knockdown in Kasumi-1 cells and (right) the overlap of genes with CDS lengthening in t(8;21) AML blasts that were significantly shortened upon FIP1L1 knockdown in Kasumi-1 cells. (H) Genome browser tracks depicting normalized sequencing reads (reads per million [RPM]) in the BAALC gene obtained from 3'READS of Kasumi-1 cells transduced with a control shRNA or shRNAs targeting FIP1L1. The full BAALC genomic structure is shown (top) with the purple, boxed region expanded (below). The percent usage of each indicated PAS was calculated by using 3'READS and is shown in the bar graph to the right. n = 3, shControl and shFIP1L1 (2); n = 4 shFIP1L1 (1).
Targeting FIP1L1 reverses APA trends in t(8;21) AML. (A) Extent of 3'UTR shortening, in all patient samples and primary HSPC controls, of the 235 genes with shortened 3'UTRs in both t(8;21) and non-t(8;21) patients. For each gene, the average and standard deviation (SD) of dPAS usage were determined. Z scores were then calculated and assigned to each sample in the cohort for the given gene. Each bar of the graph represents the average z score of all 235 genes in the indicated patient or healthy control, a measure of the overall degree of shortening. Data are mean ± SD. (B) Negative correlation between FIP1L1 expression, calculated by RNA-sequencing, and the extent of 3'UTR shortening per patient. Among all APA regulators, FIP1L1 expression is most correlated to 3'UTR shortening. Correlation was determined by linear regression. (C) Reverse transcription quantitative polymerase chain reaction (RT-qPCR) analysis of BAALC 3'UTR length in Kasumi-1 cells transduced with shRNAs targeting FIP1L1 [shRNA (1), (2), or (3)] or a control shRNA. Usage of either the middle or distal PAS was measured relative to total BAALC mRNA using primer pairs upstream of the middle poly(A) site (mPAS) and most proximal poly(A) site (pPAS), respectively. Relative 3'UTR length in FIP1L1 knockdown Kasumi-1 cells was normalized to 3'UTR length in cells transduced with the control shRNA. Data are mean ± SD of 3 independent experiments. *P < .05, ***P < .001, 1-way analysis of variance (ANOVA) with a post hoc Tukey test. (D) RT-qPCR analysis of total BAALC mRNA normalized to β-Actin mRNA in Kasumi-1 cells upon shRNA knockdown of FIP1L1. mRNA levels in knockdown cells were normalized to cells transduced with the control shRNA. Data are mean ± SD of 3 independent experiments. ***P < .001, one-way ANOVA with a post hoc Tukey test. (E) Western blot showing FIP1L1, BAALC, and actin (loading control) protein in Kasumi-1 cells after transduction with control shRNAs or shRNAs targeting FIP1L1. BAALC protein was quantified by normalizing BAALC signal intensity to actin signal intensity using Li-Cor Image Studio software. Normalized protein quantifications are shown in the bar graph to the right. n = 5 for shControl and shFIP1L1 (2); n = 3 for shFIP1L1 (1) and shFIP1L1 (3). Data are mean ± SD. ***P < .001, 1-way ANOVA with a post hoc Tukey test. (F) Scatter plot showing the change in expression of pPAS and dPAS isoforms, per gene, in Kasumi-1 cells after FIP1L1 knockdown. Significant differences in PAS usage were calculated by using the Fisher’s exact test, comparing PAS usage in Kasumi-1 cells transduced with both shRNAs targeting FIP1L1 vs the control shRNA. APA events are classified and divided according to type: 3'UTR-APA (top) and CDS-APA (bottom). Each dot corresponds to a single gene. Blue dots indicate significantly more pPAS usage; red dots indicate significantly more dPAS usage. (G) Venn diagrams showing: (left) the overlap of genes with 3'UTR shortening in t(8;21) AML blasts that were significantly lengthened upon FIP1L1 knockdown in Kasumi-1 cells and (right) the overlap of genes with CDS lengthening in t(8;21) AML blasts that were significantly shortened upon FIP1L1 knockdown in Kasumi-1 cells. (H) Genome browser tracks depicting normalized sequencing reads (reads per million [RPM]) in the BAALC gene obtained from 3'READS of Kasumi-1 cells transduced with a control shRNA or shRNAs targeting FIP1L1. The full BAALC genomic structure is shown (top) with the purple, boxed region expanded (below). The percent usage of each indicated PAS was calculated by using 3'READS and is shown in the bar graph to the right. n = 3, shControl and shFIP1L1 (2); n = 4 shFIP1L1 (1).
We selected the t(8;21)–positive Kasumi-1 cell line as a suitable model because we observed more pronounced shortening in the t(8;21) vs non-t(8;21) patients in our cohort (Figure 2A). FIP1L1 knockdown promoted 3'UTR lengthening of BAALC (Figure 2C) that corresponded to significant downregulation of BAALC mRNA (Figure 2D) and protein (Figure 2E), a change with potential clinical significance. We next tested whether FIP1L1 knockdown could globally alter the APA dysregulation we observed in patients. We performed short hairpin RNA (shRNA)-mediated knockdown in Kasumi-1 cells and observed global 3'UTR lengthening but CDS shortening, a reversal of the trends observed in AML patient blasts (Figure 2F). Importantly, 23% of the genes that had shorter 3'UTRs as detected by using 3'READS in our patient samples were lengthened upon FIP1L1 knockdown and 27% of genes with longer CDS-APA isoforms were shortened upon FIP1L1 knockdown (Figure 2G). BAALC was among the former group, confirming our previous finding (Figure 2H). Altogether, these results show the feasibility of altering global APA profiles by targeting a strategically selected APA regulator.
FIP1L1 knockdown promotes t(8;21) leukemic cell differentiation
We next performed RNA-sequencing of FIP1L1 knockdown Kasumi-1 cells to determine whether the perturbation of global APA patterns had an antileukemic effect (Figure 3A; supplemental Figure 5A). Targeting this APA regulator profoundly changed global gene expression, highlighting the interplay between posttranscriptional gene regulation and transcriptome composition (supplemental Figure 5B). Gene set enrichment analysis (GSEA) revealed that genes which were upregulated upon FIP1L1 knockdown significantly matched those that are upregulated upon myeloid cell development. This included genes such as ITGAM (CD11b)50 and LST1,51 classical markers of mature myeloid cells (Figure 3B). Similarly, genes that were downregulated upon FIP1L1 knockdown negatively correlated with those that are typically upregulated in HSCs. Among these genes are reported leukemic oncogenes BCAT152,53 and CBX554 (Figure 3C). Flow cytometric analysis of Kasumi-1 cells revealed that FIP1L1 knockdown reduced CD34 cell surface expression, indicative of a more differentiated cellular state (Figure 3D; supplemental Figure 5C). This change correlated with a decrease in cell proliferation (Figure 3E) and an increase in apoptosis (Figure 3F). We confirmed the differentiation phenotype by using a single guide RNA (sgRNA) that targets exon 1 of FIP1L1 (Figure 3G; supplemental Figure 5D). With this orthogonal method of knockdown, we again observed decreased CD34 cell surface expression (Figure 3H; supplemental Figure 5E), an increase in expression of myeloid differentiation genes (Figure 3I), and a decrease in stem cell signature genes (Figure 3J). Overall, our results indicate that targeting APA promotes t(8;21) leukemia cell differentiation.
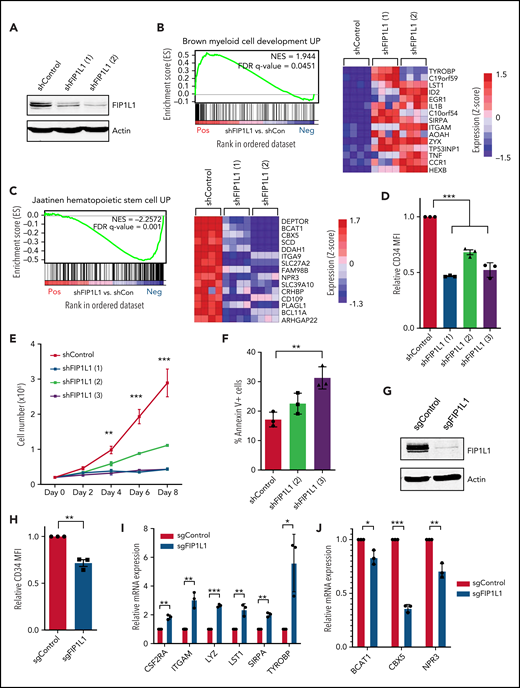
FIP1L1 knockdown promotes t(8;21) leukemic cell differentiation. (A) Western blot showing FIP1L1 and actin (loading control) protein in Kasumi-1 cells after transduction with control shRNAs or shRNAs targeting FIP1L1. (B) GSEA plot comparing differentially expressed genes upon FIP1L1 knockdown in Kasumi-1 cells with the Brown Myeloid Cell Development UP gene set. The heatmap displays 15 genes in the leading edge of the gene set that are most upregulated upon FIP1L1 knockdown. (C) GSEA plot comparing differentially expressed genes upon FIP1L1 knockdown in Kasumi-1 cells with the Jaatinen Hematopoietic Stem Cell UP gene set. The heatmap displays 15 genes in the leading edge of the gene set that are most downregulated upon FIP1L1 knockdown. (D) CD34 cell surface expression measured by flow cytometry of Kasumi-1 cells 6 days after transduction with shRNAs targeting FIP1L1 or a control shRNA. Data are mean ± standard deviation (SD) of 3 independent experiments. ***P < .001, 1-way analysis of variance (ANOVA) with post hoc Tukey test. (E) Proliferation of Kasumi-1 cells after transduction with shRNAs targeting FIP1L1 or a control shRNA. Cells were seeded (day 0) after 2 days of puromycin selection. The graph displays the mean and SD of 3 technical replicates in 1 representative experiment of 2 independent experiments. **P < .01, ***P < .001, multiple Student t tests using the Holm-Šidák method. (F) Percentage of Annexin V–positive apoptotic Kasumi-1 cells 5 days after transduction with shRNAs targeting FIP1L1 or control shRNAs. Data are mean ± SD of 3 independent experiments. **P < .01, 1-way ANOVA with post hoc Tukey test. (G) Western blot showing FIP1L1 and actin (loading control) protein in Kasumi-1 cells after transduction with control sgRNAs targeting green fluorescent protein or sgRNAs targeting FIP1L1. (H) CD34 cell surface expression measured by flow cytometry of Kasumi-1 cells 10 days after transduction with sgRNAs targeting FIP1L1 or control sgRNAs. Data are mean ± SD of 3 independent experiments. **P < .01, Student t test. (I) Reverse transcription quantitative polymerase chain reaction (RT-qPCR) analysis of various myeloid differentiation genes in Kasumi-1 cells transduced with sgRNAs targeting FIP1L1 or control sgRNAs. Data are mean ± SD of 3 independent experiments. *P < .05, **P < .01, ***P < .001, multiple Student t tests using the Holm-Šidák method. (J) RT-qPCR analysis of various HSC signature genes in Kasumi-1 cells transduced with sgRNAs targeting FIP1L1 or control sgRNAs. Data are mean ± SD of 3 independent experiments. *P < .05, **P < .01, ***P < .001, multiple Student t tests using the Holm-Šidák method. FDR, false discovery rate; MFI, mean fluorescent intensity; NES, normalized enrichment score.
FIP1L1 knockdown promotes t(8;21) leukemic cell differentiation. (A) Western blot showing FIP1L1 and actin (loading control) protein in Kasumi-1 cells after transduction with control shRNAs or shRNAs targeting FIP1L1. (B) GSEA plot comparing differentially expressed genes upon FIP1L1 knockdown in Kasumi-1 cells with the Brown Myeloid Cell Development UP gene set. The heatmap displays 15 genes in the leading edge of the gene set that are most upregulated upon FIP1L1 knockdown. (C) GSEA plot comparing differentially expressed genes upon FIP1L1 knockdown in Kasumi-1 cells with the Jaatinen Hematopoietic Stem Cell UP gene set. The heatmap displays 15 genes in the leading edge of the gene set that are most downregulated upon FIP1L1 knockdown. (D) CD34 cell surface expression measured by flow cytometry of Kasumi-1 cells 6 days after transduction with shRNAs targeting FIP1L1 or a control shRNA. Data are mean ± standard deviation (SD) of 3 independent experiments. ***P < .001, 1-way analysis of variance (ANOVA) with post hoc Tukey test. (E) Proliferation of Kasumi-1 cells after transduction with shRNAs targeting FIP1L1 or a control shRNA. Cells were seeded (day 0) after 2 days of puromycin selection. The graph displays the mean and SD of 3 technical replicates in 1 representative experiment of 2 independent experiments. **P < .01, ***P < .001, multiple Student t tests using the Holm-Šidák method. (F) Percentage of Annexin V–positive apoptotic Kasumi-1 cells 5 days after transduction with shRNAs targeting FIP1L1 or control shRNAs. Data are mean ± SD of 3 independent experiments. **P < .01, 1-way ANOVA with post hoc Tukey test. (G) Western blot showing FIP1L1 and actin (loading control) protein in Kasumi-1 cells after transduction with control sgRNAs targeting green fluorescent protein or sgRNAs targeting FIP1L1. (H) CD34 cell surface expression measured by flow cytometry of Kasumi-1 cells 10 days after transduction with sgRNAs targeting FIP1L1 or control sgRNAs. Data are mean ± SD of 3 independent experiments. **P < .01, Student t test. (I) Reverse transcription quantitative polymerase chain reaction (RT-qPCR) analysis of various myeloid differentiation genes in Kasumi-1 cells transduced with sgRNAs targeting FIP1L1 or control sgRNAs. Data are mean ± SD of 3 independent experiments. *P < .05, **P < .01, ***P < .001, multiple Student t tests using the Holm-Šidák method. (J) RT-qPCR analysis of various HSC signature genes in Kasumi-1 cells transduced with sgRNAs targeting FIP1L1 or control sgRNAs. Data are mean ± SD of 3 independent experiments. *P < .05, **P < .01, ***P < .001, multiple Student t tests using the Holm-Šidák method. FDR, false discovery rate; MFI, mean fluorescent intensity; NES, normalized enrichment score.
3'UTR-APA regulates AML1-ETO expression
We next wondered whether we could identify an individual APA event altered by targeting FIP1L1 that might contribute to the differentiation phenotype observed. Indeed, among the genes with significantly altered APA was the t(8;21) generated fusion oncoprotein AML1-ETO. FIP1L1 knockdown induced AML1-ETO 3'UTR lengthening (Figure 4A-B; supplemental Figure 5F). We observed a decrease in usage of the proximal PAS at 1 kb, a concurrent increase in usage of the 3.7 kb site, and the emergence of usage at the most distal 5.2 kb site. To confirm that FIP1L1 directly regulates ETO APA, we overexpressed FIP1L1 in 293T cells using a doxycycline-inducible construct and observed shortening of the ETO 3'UTR after 24 hours of induction (Figure 4C-D).
![3'UTR-APA regulates AML1-ETO expression. (A) Genome browser tracks depicting normalized sequencing reads (reads per million [RPM]) in the RUNX1T1 (aka ETO) gene obtained from 3'READS of Kasumi-1 cells transduced with a control shRNA or shRNAs targeting FIP1L1 [shRNA (1) or (2)]. The full RUNX1T1 genomic structure is shown (top) with the purple, boxed region expanded (below). The percent usage of each indicated PAS was calculated by using 3'READS and is shown in the bar graph to the right. n = 3, shControl and shFIP1L1 (2); n = 4 shFIP1L1 (1). (B) Reverse transcription quantitative polymerase chain reaction (RT-qPCR) analysis of AML1-ETO 3'UTR length in Kasumi-1 cells transduced with a third, unique shRNA (3) targeting FIP1L1 or a control shRNA. Usage of the PAS at 3.7 kb was measured relative to total AML1-ETO mRNA using primer pairs upstream of the 3.7 kb PAS and 1 kb PAS, respectively. Data are mean ± standard deviation (SD) of 3 independent experiments. **P < .01, Student t test. (C) Western blot showing FIP1L1 and actin (loading control) protein in 293T cells transfected with a FLAG-tagged, doxycycline (Dox)-inducible FIP1L1 overexpression construct, with and without 1 μg/mL Dox in the culture medium for 24 hours. The black arrow indicates endogenous FIP1L1. The red arrow indicates FLAG-tagged FIP1L1. (D) Genome browser tracks depicting normalized sequencing reads (RPM) in the RUNX1T1 (aka ETO) gene obtained from 3'READS of 293T cells transfected with a Dox-inducible FIP1L1 overexpression construct, with and without 1 μg/mL Dox in the culture medium for 24 hours. The full RUNX1T1 genomic structure is shown (top) with the purple, boxed region expanded (below). (E) Western blot showing FIP1L1, AML1-ETO, and tubulin (loading control) protein in Kasumi-1 cells after transduction with control shRNAs or shRNAs targeting FIP1L1. AML1-ETO protein was quantified by normalizing AML1-ETO signal intensity to tubulin signal intensity using LI-COR Image Studio software. Normalized protein quantifications from 3 independent experiments are shown in the bar graph below. Data are mean ±SD. **P < .01, ***P < .001, one-way analysis of variance (ANOVA) with a post hoc Tukey test. (F) Plots from GSEA of the RNA-sequencing experiment shown in Figure 3A (supplemental Figure 5A-B). The top plot displays genes that are downregulated by AML1-ETO; the bottom plot displays those that are upregulated by AML1-ETO. (G) Relative ratio of Renilla to firefly luciferase in Kasumi-1 cells nucleofected with the indicated dual luciferase reporter construct containing variable RUNX1T1 (aka ETO) 3'UTRs. Data are mean ± SD of 4 independent experiments. ***P < .001, 1-way ANOVA with a post hoc Tukey test. FDR, false discovery rate; NES, normalized enrichment score.](https://ash.silverchair-cdn.com/ash/content_public/journal/blood/139/3/10.1182_blood.2020005693/4/m_bloodbld2020005693f4.png?Expires=1769112564&Signature=uKfeJdvkDRejvPbViLv3tvnilUJib7aTKB4fxg1Pb~Yxn954uYE09xOAwQpXzO9Bvm4BcpRpJWWQ264Pm8QXN~q~aj1f8I5tUytgVIPn5ry5veMGAkCBa2t8Bq~vqXzeH1pv~Z3HoHCRZnY6r2BErsjiq3gvrGLbIxKHgYVV6o4ZasH1OgOw8vOxaAlc~B6ztsdkbayuWG2DeARNhFzExCJNkIpS9qQkqkGS~KJetWv4maTgT8u921lZ6EY2LsNs2yZGh~ibDS2Mm-aRwPG1OvE2PPlrVJfPTwof2UCRhA2dK0GMT7mv1L60C1O3V~H59H9z5hGMD7ph2zjMt6kBOg__&Key-Pair-Id=APKAIE5G5CRDK6RD3PGA)
3'UTR-APA regulates AML1-ETO expression. (A) Genome browser tracks depicting normalized sequencing reads (reads per million [RPM]) in the RUNX1T1 (aka ETO) gene obtained from 3'READS of Kasumi-1 cells transduced with a control shRNA or shRNAs targeting FIP1L1 [shRNA (1) or (2)]. The full RUNX1T1 genomic structure is shown (top) with the purple, boxed region expanded (below). The percent usage of each indicated PAS was calculated by using 3'READS and is shown in the bar graph to the right. n = 3, shControl and shFIP1L1 (2); n = 4 shFIP1L1 (1). (B) Reverse transcription quantitative polymerase chain reaction (RT-qPCR) analysis of AML1-ETO 3'UTR length in Kasumi-1 cells transduced with a third, unique shRNA (3) targeting FIP1L1 or a control shRNA. Usage of the PAS at 3.7 kb was measured relative to total AML1-ETO mRNA using primer pairs upstream of the 3.7 kb PAS and 1 kb PAS, respectively. Data are mean ± standard deviation (SD) of 3 independent experiments. **P < .01, Student t test. (C) Western blot showing FIP1L1 and actin (loading control) protein in 293T cells transfected with a FLAG-tagged, doxycycline (Dox)-inducible FIP1L1 overexpression construct, with and without 1 μg/mL Dox in the culture medium for 24 hours. The black arrow indicates endogenous FIP1L1. The red arrow indicates FLAG-tagged FIP1L1. (D) Genome browser tracks depicting normalized sequencing reads (RPM) in the RUNX1T1 (aka ETO) gene obtained from 3'READS of 293T cells transfected with a Dox-inducible FIP1L1 overexpression construct, with and without 1 μg/mL Dox in the culture medium for 24 hours. The full RUNX1T1 genomic structure is shown (top) with the purple, boxed region expanded (below). (E) Western blot showing FIP1L1, AML1-ETO, and tubulin (loading control) protein in Kasumi-1 cells after transduction with control shRNAs or shRNAs targeting FIP1L1. AML1-ETO protein was quantified by normalizing AML1-ETO signal intensity to tubulin signal intensity using LI-COR Image Studio software. Normalized protein quantifications from 3 independent experiments are shown in the bar graph below. Data are mean ±SD. **P < .01, ***P < .001, one-way analysis of variance (ANOVA) with a post hoc Tukey test. (F) Plots from GSEA of the RNA-sequencing experiment shown in Figure 3A (supplemental Figure 5A-B). The top plot displays genes that are downregulated by AML1-ETO; the bottom plot displays those that are upregulated by AML1-ETO. (G) Relative ratio of Renilla to firefly luciferase in Kasumi-1 cells nucleofected with the indicated dual luciferase reporter construct containing variable RUNX1T1 (aka ETO) 3'UTRs. Data are mean ± SD of 4 independent experiments. ***P < .001, 1-way ANOVA with a post hoc Tukey test. FDR, false discovery rate; NES, normalized enrichment score.
3'UTR-APA regulates AML1-ETO expression. (A) Genome browser tracks depicting normalized sequencing reads (reads per million [RPM]) in the RUNX1T1 (aka ETO) gene obtained from 3'READS of Kasumi-1 cells transduced with a control shRNA or shRNAs targeting FIP1L1 [shRNA (1) or (2)]. The full RUNX1T1 genomic structure is shown (top) with the purple, boxed region expanded (below). The percent usage of each indicated PAS was calculated by using 3'READS and is shown in the bar graph to the right. n = 3, shControl and shFIP1L1 (2); n = 4 shFIP1L1 (1). (B) Reverse transcription quantitative polymerase chain reaction (RT-qPCR) analysis of AML1-ETO 3'UTR length in Kasumi-1 cells transduced with a third, unique shRNA (3) targeting FIP1L1 or a control shRNA. Usage of the PAS at 3.7 kb was measured relative to total AML1-ETO mRNA using primer pairs upstream of the 3.7 kb PAS and 1 kb PAS, respectively. Data are mean ± standard deviation (SD) of 3 independent experiments. **P < .01, Student t test. (C) Western blot showing FIP1L1 and actin (loading control) protein in 293T cells transfected with a FLAG-tagged, doxycycline (Dox)-inducible FIP1L1 overexpression construct, with and without 1 μg/mL Dox in the culture medium for 24 hours. The black arrow indicates endogenous FIP1L1. The red arrow indicates FLAG-tagged FIP1L1. (D) Genome browser tracks depicting normalized sequencing reads (RPM) in the RUNX1T1 (aka ETO) gene obtained from 3'READS of 293T cells transfected with a Dox-inducible FIP1L1 overexpression construct, with and without 1 μg/mL Dox in the culture medium for 24 hours. The full RUNX1T1 genomic structure is shown (top) with the purple, boxed region expanded (below). (E) Western blot showing FIP1L1, AML1-ETO, and tubulin (loading control) protein in Kasumi-1 cells after transduction with control shRNAs or shRNAs targeting FIP1L1. AML1-ETO protein was quantified by normalizing AML1-ETO signal intensity to tubulin signal intensity using LI-COR Image Studio software. Normalized protein quantifications from 3 independent experiments are shown in the bar graph below. Data are mean ±SD. **P < .01, ***P < .001, one-way analysis of variance (ANOVA) with a post hoc Tukey test. (F) Plots from GSEA of the RNA-sequencing experiment shown in Figure 3A (supplemental Figure 5A-B). The top plot displays genes that are downregulated by AML1-ETO; the bottom plot displays those that are upregulated by AML1-ETO. (G) Relative ratio of Renilla to firefly luciferase in Kasumi-1 cells nucleofected with the indicated dual luciferase reporter construct containing variable RUNX1T1 (aka ETO) 3'UTRs. Data are mean ± SD of 4 independent experiments. ***P < .001, 1-way ANOVA with a post hoc Tukey test. FDR, false discovery rate; NES, normalized enrichment score.
Supporting the functional relevance of this APA event, 3'UTR lengthening in FIP1L1 knockdown Kasumi-1 cells corresponded to downregulation of AML1-ETO protein (Figure 4E) and the reversal of downstream target genes (Figure 4F). Because AML1-ETO plays a well-defined role in blocking differentiation of t(8;21) AML patients,55-59 it is one of several genes contributing to the differentiation phenotype seen upon FIP1L1 knockdown in t(8;21) cells. To confirm that 3'UTR length of the AML1-ETO transcript contributes to protein production, we again performed luciferase assays comparing Renilla luciferase production when followed by the 1 kb, 3.7 kb, or 5.2 kb ETO 3'UTR. Indeed, the shortest 1 kb 3'UTR produced 7 to 8 times more Renilla luciferase activity than either the 3.7 or 5.2 kb 3'UTR (Figure 4G). This observation is supported by various reports of miRNAs that bind to the 3'UTR region downstream of the 1 kb PAS and downregulate AML1-ETO.60-62 Finally, t(8;21) AML patient samples have significantly higher FIP1L1 expression than non-t(8;21) patients in 2 large data sets,63,64 further supporting a role for this specific APA regulator in maintaining expression of AML1-ETO in patients (supplemental Figure 6). Importantly, our data show that a fusion oncoprotein is susceptible to APA-mediated gene expression regulation.
FIP1L1 expression correlates with cell maturity across AML
Although t(8;21) AML patients tended to have higher FIP1L1 expression, some non-t(8;21) patients also had elevated FIP1L1 expression. Therefore, we hypothesized that targeting APA by FIP1L1 knockdown might apply more broadly to patients with AML. To address this, we used the publicly available RNA-sequencing data of The Cancer Genome Atlas patient cohort63 and performed differential gene expression analysis of the highest and lowest FIP1L1-expressing patients (Figure 5A). Gene ontology analysis of pathways enriched in FIP1L1 low-expressing patients revealed a striking overlap with those that were enriched upon FIP1L1 knockdown in t(8;21)+ Kasumi-1 cells. Importantly, overlapping enriched pathways support a gene expression signature of leukocyte differentiation (Figure 5B). GSEA analysis further revealed that high-expressing FIP1L1 patients had gene expression profiles positively correlated with both immature HSCs and leukemic stem cells (Figure 5C). When stratified according to FAB subtype, FIP1L1 expression was significantly higher in M0-M2 vs M3-M6 leukemia patients (supplemental Figure 7A). Collectively, these data support a role of FIP1L1 in regulating stemness gene signatures in patients and prompted us to evaluate the impact of FIP1L1 knockdown in a non-t(8;21) AML context. We turned to the HL-60 and NB4 cell lines, classically used to model myeloid cell differentiation. FIP1L1 knockdown (Figure 5D) resulted in the robust emergence of CD11b+ cells (Figure 5E; supplemental Figure 8A) and the corresponding nuclear morphology of granulocyte differentiation (Figure 5F; supplemental Figure 8B). This differentiation phenotype was confirmed in both cell lines by sgRNA knockdown of FIP1L1 (supplemental Figure 8C-E). This phenotype was induced without the addition of traditional differentiating agents, supporting a profound role of targeting APA and overcoming the hallmark differentiation block of AML. Finally, we observed decreased proliferation (Figure 5G) and increased apoptosis (Figure 5H) of these 2 cell lines upon FIP1L1 knockdown, much like we observed in Kasumi-1 cells.
![FIP1L1 expression correlates to stemness gene signatures and differentiation across AML. (A) Box and whisker plot depicting the FIP1L1 expression of all patients in the AML patient cohort of The Cancer Genome Atlas (TCGA) . Differential gene expression analysis was performed comparing the highest (red) and lowest (blue) FIP1L1 expressing patients. (B) Heatmap depicting significantly enriched gene ontology (GO) terms of upregulated genes in FIP1L1 low-expressing patients and in Kasumi-1 cells upon FIP1L1 knockdown. (C) Plots from GSEA of the RNA-sequencing analysis described in panel A. (D) Western blot showing FIP1L1 and actin (loading control) protein in HL-60 and NB4 cells after transduction with control shRNAs or shRNAs targeting FIP1L1 [shRNA (2) or (3)]. (E) Percentage of CD11b+ HL-60 and NB4 cells, measured by flow cytometry, 5 days after transduction with shRNAs targeting FIP1L1 or a control shRNA. Data are mean ± standard deviation (SD) of 3 independent experiments. *P < .05, **P < .01, ***P < .001, 1-way analysis of variance (ANOVA) with a post hoc Tukey test. (F) Wright-Giemsa staining of HL-60 cell cytospins, 5 days after transduction with shRNAs targeting FIP1L1 or a control shRNA (400×). Irregular-shaped nuclei observed in shFIP1L1 image are indicative of granulocytic differentiation compared with the spherical, smooth-edged nuclei observed in the shControl image. (G) Proliferation of HL-60 and NB4 cells after transduction with shRNAs targeting FIP1L1 or a control shRNA. Cells were seeded (day 0) after 2 days of puromycin selection. The graphs display the mean and SD of 3 technical replicates in 1 representative experiment of 2 independent experiments per cell line. **P < .01, ***P < .001, multiple Student t tests using the Holm-Šidák method. (H) Percentage of Annexin V–positive apoptotic HL-60 and NB4 cells 4 days after transduction with shRNAs targeting FIP1L1 or control shRNAs. Data are mean ± SD of 3 independent experiments. *P < .05, **P < .01, ***P < .001, 1-way ANOVA with a post hoc Tukey test. FDR, false discovery rate; NES, normalized enrichment score.](https://ash.silverchair-cdn.com/ash/content_public/journal/blood/139/3/10.1182_blood.2020005693/4/m_bloodbld2020005693f5.png?Expires=1769112564&Signature=1MBlr2O9TH6WwwaJuPrRJy9veJ4dF3PID4HHaa1K4lK-kHFmMDFDOs-4ZCwbm8ptz6hUL4pkFIS0YDucuKhrcS-g7ZNfFaFkt2v3xK~mMKZHH-RiYgFCrWwxk3kWipuTkrUnf6RM~B3uovFv81z1CqXpzg-zm4xiK-TriTkA9NwI6pbc~9Q4HQTL2Ml0Ms5-0NskJatsM6e6~JSmXMyGwznUR5eeKNJZqy0WgVDL49p4xtthDItA2w1beJkGhhne0FUUnj0CfVbCflbZ2InAOVGbFKh8Q0mccF4MBe~Wa7N5TzgAf~OXycBUxolGSVh~aCa4JqqhkXaIJRAE6pPUEQ__&Key-Pair-Id=APKAIE5G5CRDK6RD3PGA)
FIP1L1 expression correlates to stemness gene signatures and differentiation across AML. (A) Box and whisker plot depicting the FIP1L1 expression of all patients in the AML patient cohort of The Cancer Genome Atlas (TCGA) . Differential gene expression analysis was performed comparing the highest (red) and lowest (blue) FIP1L1 expressing patients. (B) Heatmap depicting significantly enriched gene ontology (GO) terms of upregulated genes in FIP1L1 low-expressing patients and in Kasumi-1 cells upon FIP1L1 knockdown. (C) Plots from GSEA of the RNA-sequencing analysis described in panel A. (D) Western blot showing FIP1L1 and actin (loading control) protein in HL-60 and NB4 cells after transduction with control shRNAs or shRNAs targeting FIP1L1 [shRNA (2) or (3)]. (E) Percentage of CD11b+ HL-60 and NB4 cells, measured by flow cytometry, 5 days after transduction with shRNAs targeting FIP1L1 or a control shRNA. Data are mean ± standard deviation (SD) of 3 independent experiments. *P < .05, **P < .01, ***P < .001, 1-way analysis of variance (ANOVA) with a post hoc Tukey test. (F) Wright-Giemsa staining of HL-60 cell cytospins, 5 days after transduction with shRNAs targeting FIP1L1 or a control shRNA (400×). Irregular-shaped nuclei observed in shFIP1L1 image are indicative of granulocytic differentiation compared with the spherical, smooth-edged nuclei observed in the shControl image. (G) Proliferation of HL-60 and NB4 cells after transduction with shRNAs targeting FIP1L1 or a control shRNA. Cells were seeded (day 0) after 2 days of puromycin selection. The graphs display the mean and SD of 3 technical replicates in 1 representative experiment of 2 independent experiments per cell line. **P < .01, ***P < .001, multiple Student t tests using the Holm-Šidák method. (H) Percentage of Annexin V–positive apoptotic HL-60 and NB4 cells 4 days after transduction with shRNAs targeting FIP1L1 or control shRNAs. Data are mean ± SD of 3 independent experiments. *P < .05, **P < .01, ***P < .001, 1-way ANOVA with a post hoc Tukey test. FDR, false discovery rate; NES, normalized enrichment score.
FIP1L1 expression correlates to stemness gene signatures and differentiation across AML. (A) Box and whisker plot depicting the FIP1L1 expression of all patients in the AML patient cohort of The Cancer Genome Atlas (TCGA) . Differential gene expression analysis was performed comparing the highest (red) and lowest (blue) FIP1L1 expressing patients. (B) Heatmap depicting significantly enriched gene ontology (GO) terms of upregulated genes in FIP1L1 low-expressing patients and in Kasumi-1 cells upon FIP1L1 knockdown. (C) Plots from GSEA of the RNA-sequencing analysis described in panel A. (D) Western blot showing FIP1L1 and actin (loading control) protein in HL-60 and NB4 cells after transduction with control shRNAs or shRNAs targeting FIP1L1 [shRNA (2) or (3)]. (E) Percentage of CD11b+ HL-60 and NB4 cells, measured by flow cytometry, 5 days after transduction with shRNAs targeting FIP1L1 or a control shRNA. Data are mean ± standard deviation (SD) of 3 independent experiments. *P < .05, **P < .01, ***P < .001, 1-way analysis of variance (ANOVA) with a post hoc Tukey test. (F) Wright-Giemsa staining of HL-60 cell cytospins, 5 days after transduction with shRNAs targeting FIP1L1 or a control shRNA (400×). Irregular-shaped nuclei observed in shFIP1L1 image are indicative of granulocytic differentiation compared with the spherical, smooth-edged nuclei observed in the shControl image. (G) Proliferation of HL-60 and NB4 cells after transduction with shRNAs targeting FIP1L1 or a control shRNA. Cells were seeded (day 0) after 2 days of puromycin selection. The graphs display the mean and SD of 3 technical replicates in 1 representative experiment of 2 independent experiments per cell line. **P < .01, ***P < .001, multiple Student t tests using the Holm-Šidák method. (H) Percentage of Annexin V–positive apoptotic HL-60 and NB4 cells 4 days after transduction with shRNAs targeting FIP1L1 or control shRNAs. Data are mean ± SD of 3 independent experiments. *P < .05, **P < .01, ***P < .001, 1-way ANOVA with a post hoc Tukey test. FDR, false discovery rate; NES, normalized enrichment score.
Targeting APA converges on MYC expression and mTORC1 signaling
Because non-t(8;21) cells also differentiated upon FIP1L1 knockdown, we reasoned that common leukemia-promoting pathways must be altered that do not exclusively rely on AML1-ETO protein expression. To identify such pathways, we returned to our RNA-sequencing data from FIP1L1 knockdown in Kasumi-1 cells. Pathway analysis of significantly downregulated genes revealed a striking reduction in biosynthetic processes (Figure 6A). GSEA clarified this general observation as an overall reduction in mTORC1 signaling, a pathway that is constitutively active in leukemia, contributing to initiation and progression.65-67 Specifically, genes downregulated upon FIP1L1 knockdown matched those that are downregulated upon treatment with rapamycin, an mTORC1 inhibitor (Figure 6B). To test whether FIP1L1 knockdown commonly attenuates mTORC1 signaling across AML, shRNA-mediated knockdown was performed in 5 mutationally diverse AML cell lines, and a reduction in phosphorylated p70-S6 Kinase 1 (S6K1), the rapamycin-sensitive direct downstream target of mTOR kinase,68,69 was observed (Figure 6C).
![Targeting APA converges on mTORC1 signaling and MYC expression. (A) Metascape analysis of significantly downregulated genes (P < .01, 1.5× fold change) upon FIP1L1 knockdown in Kasumi-1 cells. (B) Plot from GSEA of the RNA-sequencing experiment presented in Figure 3A (supplemental Figure 5A-B) showing genes downregulated upon rapamycin treatment. (C) Western blot showing FIP1L1, phosphorylated p70-S6 Kinase 1 (p-S6K1), S6K1, and actin (loading control) protein in the indicated AML cell lines after transduction with control shRNAs or shRNAs targeting FIP1L1 [shRNA (2) or (3)]. One representative experiment is shown of 2 independent experiments for each cell line. (D) Plot from GSEA of the RNA-sequencing experiment presented in Figure 3A (supplemental Figure 5A-B) showing genes upregulated by the oncogenic MYC transcription factor. (E) Western blot showing FIP1L1, MYC, and actin (loading control) protein in the indicated AML cell lines after transduction with control shRNAs or shRNAs targeting FIP1L1. One representative experiment is shown of 2 independent experiments for each cell line. (F) Cartoon model showing the impact of targeting APA on a positive oncogenic feedback loop. (Left) In cancer, mTORC1 and MYC positively regulate each other, blocking cellular differentiation. (Right) Targeting APA by FIP1L1 knockdown reduced both mTORC1 signaling and MYC transcriptional networks, promoting leukemia cell differentiation. Further work will elucidate the precise posttranscriptional targets responsible for disrupting this oncogenic signaling network. FDR, false discovery rate; NES, normalized enrichment score.](https://ash.silverchair-cdn.com/ash/content_public/journal/blood/139/3/10.1182_blood.2020005693/4/m_bloodbld2020005693f6.png?Expires=1769112564&Signature=bqXhbVGDu5gmFlWLW2IyxGKmiMkBvqOpTie9x04m3SAr~EtdFLAsjKu0qk0Dix7EXvcEqoHXYsOc-FILZ3296q-gcYnQFuvphY4rV0g39FuMUF4NPolh~GLyh~DvI-1itK9zU5f5ruariN-kBn6FodNiZtLlVDX~7OaOKQqR3c9cJHnAz73l5V91N7M7UIR8DM5TixlDJZAEN07py~rFqxdYRoIBCa44yOgMquEV4f9Kc-wZYehgjnA8-MoU-1fNjUyVLo9Q0QVUUEHeHHuispVO4YC~hSokmFCuvUQJkmLqR75FNUJOQrcUdXj7uKZm0RJ2gQB3YTBMZ9a901J~2w__&Key-Pair-Id=APKAIE5G5CRDK6RD3PGA)
Targeting APA converges on mTORC1 signaling and MYC expression. (A) Metascape analysis of significantly downregulated genes (P < .01, 1.5× fold change) upon FIP1L1 knockdown in Kasumi-1 cells. (B) Plot from GSEA of the RNA-sequencing experiment presented in Figure 3A (supplemental Figure 5A-B) showing genes downregulated upon rapamycin treatment. (C) Western blot showing FIP1L1, phosphorylated p70-S6 Kinase 1 (p-S6K1), S6K1, and actin (loading control) protein in the indicated AML cell lines after transduction with control shRNAs or shRNAs targeting FIP1L1 [shRNA (2) or (3)]. One representative experiment is shown of 2 independent experiments for each cell line. (D) Plot from GSEA of the RNA-sequencing experiment presented in Figure 3A (supplemental Figure 5A-B) showing genes upregulated by the oncogenic MYC transcription factor. (E) Western blot showing FIP1L1, MYC, and actin (loading control) protein in the indicated AML cell lines after transduction with control shRNAs or shRNAs targeting FIP1L1. One representative experiment is shown of 2 independent experiments for each cell line. (F) Cartoon model showing the impact of targeting APA on a positive oncogenic feedback loop. (Left) In cancer, mTORC1 and MYC positively regulate each other, blocking cellular differentiation. (Right) Targeting APA by FIP1L1 knockdown reduced both mTORC1 signaling and MYC transcriptional networks, promoting leukemia cell differentiation. Further work will elucidate the precise posttranscriptional targets responsible for disrupting this oncogenic signaling network. FDR, false discovery rate; NES, normalized enrichment score.
Targeting APA converges on mTORC1 signaling and MYC expression. (A) Metascape analysis of significantly downregulated genes (P < .01, 1.5× fold change) upon FIP1L1 knockdown in Kasumi-1 cells. (B) Plot from GSEA of the RNA-sequencing experiment presented in Figure 3A (supplemental Figure 5A-B) showing genes downregulated upon rapamycin treatment. (C) Western blot showing FIP1L1, phosphorylated p70-S6 Kinase 1 (p-S6K1), S6K1, and actin (loading control) protein in the indicated AML cell lines after transduction with control shRNAs or shRNAs targeting FIP1L1 [shRNA (2) or (3)]. One representative experiment is shown of 2 independent experiments for each cell line. (D) Plot from GSEA of the RNA-sequencing experiment presented in Figure 3A (supplemental Figure 5A-B) showing genes upregulated by the oncogenic MYC transcription factor. (E) Western blot showing FIP1L1, MYC, and actin (loading control) protein in the indicated AML cell lines after transduction with control shRNAs or shRNAs targeting FIP1L1. One representative experiment is shown of 2 independent experiments for each cell line. (F) Cartoon model showing the impact of targeting APA on a positive oncogenic feedback loop. (Left) In cancer, mTORC1 and MYC positively regulate each other, blocking cellular differentiation. (Right) Targeting APA by FIP1L1 knockdown reduced both mTORC1 signaling and MYC transcriptional networks, promoting leukemia cell differentiation. Further work will elucidate the precise posttranscriptional targets responsible for disrupting this oncogenic signaling network. FDR, false discovery rate; NES, normalized enrichment score.
Attenuation of mTORC1 signaling regulates myeloid differentiation through translational control of the MYC transcription factor.70 Indeed, we also saw potent downregulation of MYC target genes in our FIP1L1 knockdown RNA-sequencing data set (Figure 6A,D; supplemental Figure 9A). We confirmed that MYC protein is reduced in all 5 AML cell lines (Figure 6E). Taken together, targeting APA induced differentiation and reduced proliferation (supplemental Figure 8F) across AML subtypes by downregulating global oncogenic signaling pathways.
Discussion
We have added to a growing field of knowledge regarding APA dysregulation in cancer. By examining PAS usage in patients with AML compared with healthy control subjects, we showed that, due to APA, patients exhibited global 3'UTR shortening but CDS lengthening. To study the impact of this global APA dysregulation in leukemia, we targeted FIP1L1, the APA regulator whose mRNA levels correlated with 3'UTR shortening in our 3'READS AML patient cohort. We discovered that APA dysregulation contributes to the differentiation block of leukemia cells, described the impact of APA on the expression of crucial oncogenes, and introduced APA as a putative therapeutic target in AML.
Our results highlight the potential of targeting an APA regulator to overcome the hallmark differentiation block of leukemia. Despite the importance of APA in modulating healthy cellular differentiation,17-19 the role of dysregulated APA in cancer has been predominantly attributed to its impact on cellular proliferation.9,20,22,23 Various studies report 3'UTR shortening and upregulation of cell-cycle and proliferation-related transcripts in cancer such as CCND114,21,71 and CDC6.33 Although not excluding the effects on differentiation, these studies imply that reduced differentiation is a byproduct of enhanced proliferation. However, non-transformed cells with similar proliferative capacity as transformed cells do not exhibit the same 3'UTR shortening, supporting an oncogenic role for APA that is proliferation independent.14 The current study addresses this knowledge gap and emphasizes a role of APA in mediating differentiation of cancer cells. Targeting global APA dysregulation by FIP1L1 knockdown induced differentiation of mutationally diverse AML cell lines. In patients, FIP1L1 expression was correlated to leukemia cell maturation, supporting the clinical relevance of this finding. Mechanistically, we identified 3'UTR-APA of the t(8;21) fusion protein AML1-ETO, reporting for the first time that APA can affect expression of a prominent oncofusion. Importantly, AML1-ETO is implicated in the differentiation block, but not the enhanced proliferation, of myeloid leukemia cells.55 We also experimentally confirmed 3'UTR-APA–mediated regulation of BAALC expression, a negative prognostic factor in leukemia that blocks differentiation in both AML37 and congenital neutropenia.72 These APA events represent 2 of many that contributed to the differentiation phenotype observed.
We also observed dysregulation of leukemogenic pathways that hinder differentiation independent of AML1-ETO and BAALC. Specifically, targeting FIP1L1 prompted downregulation of MYC, an oncogenic transcription factor well known for its role in blocking hematopoietic differentiation.73,74 Although MYC protein was downregulated, MYC polyadenylation was unchanged (supplemental Figure 9B). Indirect MYC downregulation may be mediated by attenuated mTORC1 signaling, as activated mTOR promotes MYC translation.70,75 Although we observed attenuation of activity, mTOR APA was also unchanged (supplemental Figure 9C). Furthermore, MYC indirectly regulates mTORC1 signaling by transcriptional control of cell membrane transporters that supply the amino acids required for mTORC1 activity.76-78 Our data support this feedback loop as rapamycin signatures were linked to those for amino acid deprivation (supplemental Figure 9D). Although the details of this indirect APA mechanism are unclear, we show that targeting APA disrupts this oncogenic positive feedback loop and promotes leukemia cell differentiation (Figure 6F).
Our data also revealed that targeting a core APA machinery factor exhibits some degree of specificity (ie, transcripts were differentially shortened, lengthened, or unaffected upon FIP1L1 knockdown). This finding agrees with previous reports of FIP1L1 depletion in murine embryonic stem cells48 and myoblasts.49 FIP1L1 is an RBP that binds to U-rich or AU-rich regions near the core polyadenylation cis-acting elements.48,79,80 Therefore, FIP1L1 may most prominently affect APA of transcripts that have putative binding motifs. Furthermore, binding can occur between the PAS hexamer and cleavage site79,80 or upstream of the PAS hexamer.48,79 The location of FIP1L1 binding and distance between adjacent PAS hexamers have both been proposed to mediate differences in PAS usage patterns among transcripts.48,49 Indeed, motif enrichment analysis based on our 3'READS data supports this idea that the location of FIP1L1 binding relative to the PAS hexamer may mediate specificity. Upon FIP1L1 knockdown, PAS usage with downstream A/U-rich regions was enhanced, whereas usage of sites with upstream A/U-rich regions was depleted (supplemental Figure 10). These data suggest that upstream binding of FIP1L1 promotes, whereas downstream binding inhibits, PAS usage. Further work will be required to test this hypothesis. Finally, it is important to note that some of the transcripts with altered APA upon FIP1L1 knockdown in our cellular system may not be direct FIP1L1 targets and may be indirectly altered by changes in cellular behavior, such as decreased proliferation and/or increased differentiation.9
Altogether, our findings introduce APA as a putative target for differentiation therapy in AML. Historically, differentiation therapy by all-trans retinoic acid and arsenic trioxide has been most effective in patients with APL.81 Recently, interest in differentiation therapy has been reinvigorated by the efficacy of IDH inhibitors in AML patients with IDH1/2 mutations.27-29 Our findings illuminate another possible target for differentiation therapy that may expand the number of patients who can benefit from differentiation-based treatment. Supporting the therapeutic potential of targeting APA regulators in leukemia, 2 recent reports have identified CPSF3 as the molecular target of JTE-607, a compound that is preferentially detrimental to leukemia cell lines.82,83 CPSF3 is a member of the CPSF complex alongside FIP1L1, and treatment of AML cells with this CPSF3 inhibitor promotes differentiation and apoptosis. It will be exciting to test whether targeting additional polyadenylation regulators also promotes AML cell differentiation. Finally, to fully establish FIP1L1 and other APA regulators as viable therapeutic targets, additional work is required to address the effect of targeting these regulators in healthy hematopoietic cells. Although we did not test the effect of FIP1L1 knockdown on healthy cells, we noted that FIP1L1 expression does not correlate with cell maturity in normal hematopoiesis as it does in patients with AML (supplemental Figure 7B).
The identification of FIP1L1 in leukemogenesis is also clinically intriguing because it is a member of 2 oncofusions found in chronic eosinophilic leukemia and juvenile myelomonocytic leukemia/APL: FIP1L1-PDGFRA84 and FIP1L1-RARA,85,86 respectively. The reported contribution of FIP1L1 in FIP1L1-RARA is limited to receptor dimerization and activation, with no data regarding the impact on global polyadenylation.87 Similarly, reports regarding FIP1L1-PDGFRA describe FIP1L1 as dispensable, claiming that constitutive activation of the receptor is sufficient to induce leukemia in cell lines and mouse models.88,89 Despite this dismissal, not all signaling features dysregulated in chronic eosinophilic leukemia are recapitulated with only the C-terminal portion of PDGFRA.90 In both fusions, FIP1L1 retains the major protein–protein interaction domain but lacks the C-terminal domain implicated in RNA-binding.79 Although our experiments do not directly address the role of FIP1L1 RNA-binding in the observed phenotypes, our data support a likely consequence of FIP1L1 alteration in these fusions and overall contribution to pathogenesis. Consequently, our findings necessitate further study regarding the impact of these 2 oncofusions on polyadenylation dysregulation in patients.
In conclusion, we have shown that APA dysregulation contributes to the differentiation block of AML, which can be overcome by downregulating the cleavage and polyadenylation factor FIP1L1. Consequently, targeting APA may be a promising therapeutic strategy for patients with leukemia.
Acknowledgments
The authors thank the staff at the UC San Diego Institute for Genomic Medicine for their help in sequencing both 3'READS and RNA-sequencing libraries. The authors also thank Qingbao Ding for his technical assistance.
This work was supported by the National Institutes of Health, National Cancer Institute (R01CA104509 [D.-E.Z.]) and the National Institute of General Medical Sciences (R01GM084089 [B.T.]). This work was also supported by a National Institutes of Health training grant (5T32GM007240-38 [A.G.D.]).
Authorship
Contribution: A.G.D. and D.-E.Z. devised the study and designed the experimental strategies; A.G.D., D.T.J., and S.A.S. performed the research, collected data, and analyzed the results; D.Z. and J.S. prepared the 3'READS libraries; R.W. performed the bioinformatics analyses pertaining to the 3'READS experiments; N.D.J., M.L., and L.W. performed additional bioinformatics analyses of publicly available patient data sets; J.-H.Z. and E.D.B. collected, annotated, and provided clinical samples for the study; A.G.D. wrote the manuscript; D.T.J. edited the manuscript; B.T. provided resources, imparted expertise, and critically reviewed the manuscript; E.D.B. also critically reviewed the manuscript; and D.-E.Z. oversaw the study, supervised manuscript preparation, and secured funding to support the study.
Conflict-of-interest disclosure: The authors declare no competing financial interests.
Correspondence: Dong-Er Zhang, 9500 Gilman Dr #0815, La Jolla, CA 92037; e-mail: dez@ucsd.edu.
The online version of this article contains a data supplement.
There is a Blood Commentary on this article in this issue.
The publication costs of this article were defrayed in part by page charge payment. Therefore, and solely to indicate this fact, this article is hereby marked “advertisement” in accordance with 18 USC section 1734.

This feature is available to Subscribers Only
Sign In or Create an Account Close Modal