

Abstract
Patients with acute myeloid leukemia (AML) have conventionally received more intense therapy than patients with myelodysplastic syndrome (MDS). Although less intense therapies are being used more often in AML, the dichotomy between AML and MDS remains, with the presence of ≥20% myeloblasts in marrow or peripheral blood generally regarded as defining AML. Consequently, patients with 19% blasts are typically ineligible for AML studies, and patients with 21% blasts are ineligible for MDS studies. Here we cite biologic and clinical data to question this practice. Biologically, abnormalities in chromosome 3q26 and mutations in NPM1 and FLT3, regarded as AML associated, also occur in MDS. The genetic signatures of MDS, particularly cases with 10% to 19% blasts (MDS-EB2), resemble those of AML following a preceding MDS (secondary AML). Mutationally, secondary AML appears at least as similar to MDS-EB2 as to de novo AML. Patients presenting with de novo AML but with secondary-type AML mutations seem to have the same poor prognosis associated with clinically defined secondary AML. Seattle data indicate that after accounting for European LeukemiaNet 2017 risk, age, performance status, clinically secondary AML, and treatment including allogeneic transplantation, patients with World Health Organization–defined AML (n = 769) have similar rates of overall survival, event-free survival, and complete remission (CR)/CR with incomplete hematologic recovery as patients with MDS-EB2 (n = 202). We suggest defining patients with 10% to 30% blasts (AML/MDS) as eligible for both AML and MDS studies. This would permit empiric testing of the independent effect of blast percentage on outcome, allow patients access to more therapies, and potentially simplify the regulatory approval process.
Introduction
Treatment of patients with acute myeloid leukemia (AML) and that of patients with myelodysplastic syndromes (MDS), including those MDS patients with excess blasts, has historically differed, with more intense regimens reserved for AML. Although less intense induction is now increasingly used in AML, the therapeutic dichotomy between AML and MDS remains, based largely on the requirement, first put forth in the 2001 World Health Organization (WHO) classification of myeloid neoplasms,1 for ≥20% morphologic myeloblasts in either bone marrow or peripheral blood to diagnose AML. Retained in the 2008 and 2016 revisions,2,3 the 20% blast criterion has affected patients’ ability to receive new drugs in clinical trials. Despite the approval of several new drugs for AML,4-13 current therapy for AML and MDS with 10% to 19% blasts (MDS-EB2) remains unsatisfactory.12,13 Therefore, many physicians and patients would prefer participation in a trial. However, the 20% threshold means a patient is ineligible for an AML trial with 19% blasts but eligible with 21% blasts and, conversely, eligible for an MDS trial with 19% but not 21% blasts. However, even if 500 cells are enumerated perfectly accurately, the 95% confidence intervals (CIs) surrounding 19% blasts (16%-23%) and 21% blasts (18%-25%) overlap significantly.14 Reproducibility is also problematic. Assessing concordance among 4 experienced academic hematologic cytologists regarding whether the blast count was 10% to 19% or <10% in 50 patients with MDS, Senent et al15 found a κ statistic value of 0.60, conventionally denoting only moderate concordance. Although any blast percentage is arbitrary, a lower blast threshold would permit more patients to be treated in AML trials. Eligibility criteria for trials originating in academic centers often permit patients with 10% to 19% blasts to enroll in AML trials. However, the strict separation of AML from MDS by the US Food and Drug Administration (FDA) and other regulatory agencies based on the 20% blast threshold continues to influence pharmaceutical companies, the sponsors of many innovative trials. Similarly, if the blast threshold for a diagnosis of AML were, for example, ≥30% (the threshold for AML used until 2001), patients with 21% to 29% blasts, who today are considered to have AML, would be considered to have MDS and become eligible for MDS trials.
The WHO has noted that “the 20% blast threshold is not a mandate to treat the patient as having AML or blast transformation: therapeutic decisions must always be based on the clinical situation after all information is considered.”(p2294) For example, as noted since the 2001 edition, “patients with the clonal, recurring cytogenetic abnormalities t(8;21)(q22;q22), inv(16)(p13q22), or t(16;16)(p13;q22) should be considered to have AML regardless of the blast percentage.”1(p2294) Inclusion of these patients within AML likely reflects their responsiveness to intensive therapy usually reserved for patients with ≥20% blasts. The French-American-British (FAB) system, the predecessor of the WHO, considered the threshold for AML to be 30% blasts,16 with patients with 20% to 29% blasts classified in the MDS category refractory anemia with excess blasts (RAEB) in transformation.17 However, the observation that administration of intensive AML-type therapy to patients with FAB-defined AML (≥30% blasts) or FAB RAEB in transformation (20%-29% blasts) resulted in similar outcomes after accounting for cytogenetics, age, de novo vs secondary AML, and treatment again suggested the value of clinical data in informing classification.18 This observation influenced the 2001 WHO reduction of the blast threshold for AML from 30% to 20%.1 Here we suggest that the 20% threshold is as arbitrary and problematic as the prior 30%.
Biologic data
AML-associated abnormalities can present as MDS
Core binding factor (CBF) rearrangements (as well as PML-RARA rearrangements) are considered AML defining, irrespective of blast count.1 Likewise, although also considered an AML-associated abnormality, NPM1 mutations can rarely present as MDS or chronic myelomonocytic leukemia (CMML).19,20 Such cases appear biologically different from the more common NPM1 wild-type MDS or CMML.20 Inv(3)/t(3;3) can also present as either AML or MDS.21 On the basis of analyses of 2043 patients, Bersanelli et al22 classified MDS into 8 distinct groups defined by specific genomic features. Group 7 comprised 174 patients with AML-like mutations occurring in DNMT3A, NPM1, FLT3, IDH1, and RUNX1 genes; 83% of these cases presented with 15% to 19% blasts.22 Rather than classifying solely on blast percentage, some cases might be better classified on the basis of common genetic features, such as NPM1-mutated myeloid neoplasm or myeloid neoplasm with inv(3)/t(3:3).
Genetic overlap between high-grade MDS and secondary AML
Defining the chromatin/spliceosome class of AML by mutations in genes regulating RNA splicing (SRSF2, SF3B1, U2AF1, and ZRSR2), chromatin modification (ASXL1, STAG2, BCOR, KMT2a PTD, EZH2, and PHF6), or transcription (RUNX1), Papaemmanuil et al23 noted AML patients in this class were older, often presented with an antecedent hematologic disorder and/or dysplastic marrow morphology, and had inferior outcomes. The same genetic mutations of the Papaemmanuil et al chromatin/spliceosome AML class or the Lindsley et al24 secondary AML pattern have also been described in high-grade MDS,25,26 suggesting that secondary AML and high-grade MDS represent biologically very similar myeloid neoplasms transcending the morphologic 20% blast threshold.
Furthermore, Menssen and Walter27 have that noted mutations in genes involved in at least 6 major pathways are shared between MDS and secondary AML. These entities also share cytogenetic abnormalities resulting in copy-number alterations, in contrast to the balanced translocations more common in de novo AML. Indeed, a group of MDS-associated cytogenetic abnormalities are diagnostic of the WHO category AML with myelodysplasia-related changes (AML-MRC), even in clinically de novo cases without a prior MDS diagnosis or significant morphologic dysplasia. These abnormalities are also common in MDS and are often considered to confer poor or very poor risk according to the MDS Cytogenetic Scoring System28 and the revised International MDS Prognostic Scoring System (IPSS),29 each of which combined MDS patients with AML patients with 20% to 29% blasts developing after MDS.
MDS progression to AML evaluated using paired samples
Menssen and Walter27 identified 60 patients with paired MDS/secondary AML samples. Mutations in TP53, splicing factor, and epigenetic modifying genes occurred in both MDS and secondary AML stages, but the proportion of patients with these mutations was higher in the MDS stage; at AML progression, these mutations often persisted but became less prominent than mutations in transcription factors (eg, RUNX1, CEBPA) and activating signaling genes (eg, NRAS/KRAS, FLT3), suggesting that AML progression is driven largely by de novo/pan-AML mutations arising in preexisting MDS clones. Other studies30-32 have similarly supported mutations in epigenetic regulating genes as early founder events followed by progression events (eg, mutations in signaling genes or NPM1). However, months to years before progression, progression-associated mutations can often be identified at low levels at the MDS stage,26 with preleukemic mutations persisting in AML remission.33 These data suggest a complex relationship between blast percentage and underlying mutation signature, defying simple categorization as MDS or AML based on a single blast percentage cutoff.
Clinically secondary vs clinically de novo AML
Lindsley et al24 compared mutation patterns in 93 patients with secondary AML (defined by histologic documentation of MDS or CMML ≥3 months before AML diagnosis) with mutation patterns in 180 patients with clinically de novo AML.34 Mutations in 8 genes (SRSF2, ZRSR2, SF3B1, ASXL1, BCOR, EZH2, U2AF1, and STAG2) were >95% specific for secondary AML, whereas 3 alterations (NPM1 mutations, KMT2a rearrangements, and CBF gene fusions) were >95% specific for de novo AML. Sixteen genes had <95% specificity and were considered pan-AML mutations.
Extending these comparisons to include MDS, Chen et al35 compared mutation incidence in 36 genes among 102 patients with MDS-EB (5%-19% blasts), 69 (nonpaired) patients with WHO-defined AML-MRC (n = 61) or therapy-related AML (t-AML; n = 8), and 64 patients with de novo AML. Mutations in spliceosome genes occurred in 35% of those with MDS-EB, 32% of those with AML-MRC/t-AML, and 25% of those with de novo AML (P = .38). TP53 mutations were seen in 39% of patients with MDS-EB, 29% of those with AML-MRC/t-AML, and 2% of those with de novo AML (P < .00001). NPM1 mutation frequency was 6% in MDS-EB, closer to the frequency in AML-MRC/t-AML (13%, P = .17) than to that in de novo AML (41%; P < .001). Likewise, the frequency of FLT3–internal tandem duplication (ITD) was closer when comparing MDS-EB with AML-MRC/t-AML (0% vs 6%; P = .025) than when comparing AML-MRC/t-AML with de novo AML (6% vs 22%; P = .007).
Relation between blast percentage and tumor burden assessed by variant allele frequencies
Chen et al35 also reported that the distribution of variant allele frequencies (VAFs) of individually mutated genes did not differ between MDS-EB and AML-MRC/t-AML, despite the difference in blast percentages between these entities. Toth et al36 reported similar results.
Walter et al31 pursued this topic using paired bone marrow samples from 7 patients at the MDS stage (mean blast count <10%) and subsequently at AML progression (mean blast count ∼45%). They assessed tumor burden as the percentage of clonal cells, based on VAFs of various mutations. Despite the increase in morphologic blast count, ∼85% of the cells were clonal at both the MDS and secondary AML stages.
These biologic data suggest that secondary AML arising from prior MDS and even clinically defined de novo AML exhibiting a secondary-type AML gene signature bear a greater resemblance to MDS-EB than to de novo AML lacking MDS-type genetics. MDS-EB and AML essentially form a continuum. Blast percentage is an imperfect guide to tumor burden, because in both MDS and AML, a similarly high proportion of hematopoietic cells are part of the mutated clone. Rather than blast percentage, disease categorization may be more accurate if based on biologic features. One possibility would classify disease as (1) true MDS with <5% blasts without known high-risk mutations (eg, TP53) or cytogenetic abnormalities [eg, inv(3)/t(3;3)] and thus with low risk of progression to AML [eg, MDS with isolated del(5q)37 or SF3B1-mutated MDS38]; (2) true AML with PML-RARA, RUNX1-RUNX1T1, or CBFB-MYH11 gene fusions, NPM1 mutations, KMT2A gene rearrangments, or biallelic CEBPA mutations, regardless of blast percentage; and (3) cases with high-risk mutations (eg, TP53, ASXL1, RUNX1) or cytogenetic abnormalities [eg, inv(3)/t(3;3)] that are common to both AML and MDS and other cases with >5% blasts. Patients with t-AML could belong to either group 2 or 3 but only rarely to group 1.
Clinical data
Dominance of genetic ontogeny over clinical ontogeny
Comparative importance of specific genetic abnormalities vs AML/MDS distinction
RUNX1-RUNX1T1 t(8;21)(q22.q22.1) and CBFB-MYH11 inv(16)(p13.1q22) or t(16;16)(p13.1;q22)
WHO considers these patients to have AML regardless of blast count, given the lack of dysplasia in those with <20% blasts and the similarly favorable outcomes following AML-type therapy regardless of blast percentage.1 We believe this example provides a compelling precedent for defining AML based on genetic features, rather than purely on a rigid blast percentage.
NPM1
Despite a blast count <20%, NPM1-mutated MDS/CMML appears sensitive to AML-type induction chemotherapy. Montalban-Bravo et al39 compared AML-type induction therapy (typically anthracyclines + cytarabine ± fludarabine or cladribine) with MDS-type therapy (typically hypomethylating agent [HMA] azacitidine or decitabine) in 31 patients with NPM1-mutated MDS or CMML. Median marrow blast count was 10% (range, 0%-19%); 19 patients had MDS-EB2 or CMML with 10% to 19% blasts. The 11 patients receiving AML induction were younger than the 20 patients receiving HMAs, but distributions of revised IPSS scores were similar. Complete remission (CR) rates were 90% with AML induction and 28% with HMAs (P = .004). Seven patients receiving AML-type therapy and 6 receiving HMAs underwent allogeneic hematopoietic cell transplantation (HCT). With a 30-month median follow-up, AML-type induction was associated with longer progression-free survival (P = .023) and overall survival (OS; P = .047). The number of events/deaths was too small to support a multivariate analysis, nor was there a comparison with AML patients with NPM1 mutations who received intensive induction. However, the results suggest a focus on the 20% cut point may lead to potentially efficacious therapy being withheld from NPM1-mutated MDS/CMML patients and their exclusion from clinical trials specifically targeting NPM1 mutations but intended only for patients with AML.
GATA2 MECOM (EVI1) inv(3)(q21.3q26.2) or t(3;3)(q21.3;q26.2)
Although more commonly found in AML, these entities share the same biology and dismal outcomes whether treated as MDS or AML.40,41
TP53
FLT3-ITD
Seattle data
The Fred Hutchinson Cancer Research Center/University of Washington considers patients with MDS-EB2 (10% to 19% morphologic blasts) eligible for AML-type therapy in locally initiated studies.45 Other such patients have received conventional MDS-type therapy, particularly HMAs. Patients with ≥20% morphologic blasts have also received both types of therapy, although few received HMAs plus venetoclax, which became available only relatively recently.
We analyzed outcomes in 769 patients with WHO-defined AML (acute promyelocytic leukemia excepted) and 202 patients with MDS-EB2. AML patients were considered secondary if they had bone marrow documentation of antecedent MDS or myeloproliferative neoplasm (MPN) (n = 123), therapy-related disease (n = 72), or both (n = 21). In 137 of the 144 of cases of AML developing after marrow documentation of MDS or MPN, the marrow showing MDS or MPN was obtained >3 months before AML diagnosis. MDS patients were considered secondary only if they had therapy-related disease (n = 23). Patients were treated between 2008 and 2016, and median follow-up in patients remaining alive or alive in remission was 4.2 years. Of the 769 WHO-defined AML cases, 729 (95%) had ≥20% morphologic blasts in marrow (n = 535) or, if marrow was inadequate, in peripheral blood (n = 194). The remaining 5% were considered AML because of CBF abnormalities or biopsy-proven granulocytic sarcoma. The AML and MDS-EB2 patients did not differ in age or performance status (Table 1). ELN 2017 favorable-risk disease42 was more common in AML, whereas ELN intermediate- and adverse-risk disease42 was more common in MDS-EB2 (Table 1). Reflecting the different criteria for secondary AML vs secondary MDS, secondary disease was more common with AML (28% vs 11%; Table 1). Receipt of low-intensity induction (typically HMAs) was more common with MDS-EB2. We combined patients receiving either 7 + 3 or induction containing cytarabine in doses ≥1 g/m2 into a high-intensity group, because induction with either 7 + 3 or high-dose cytarabine seems equally efficacious.42 Treatment with allogeneic HCT was more common in MDS-EB2 (Table 1). Statistical analyses were not adjusted for multiple testing.
Patient characteristics and response
| Factor | MDS-EB2 (n = 202) | WHO AML (n = 769) | All (N = 971) | P (MDS-EB2 vs WHO AML) |
|---|---|---|---|---|
| Age, y | .36 | |||
| Mean | 62 | 63 | 62 | |
| Range | 22-85 | 18-91 | 18-91 | |
| Performance status | .85 (0-1 vs 2-4) | |||
| 0-1 | 159 (79) | 598 (78) | 757 (78) | |
| 2-4 | 43 (21) | 171 (22) | 214 (22) | |
| Disease status | ||||
| De novo | 179 (89) | 553 (72) | 732 (75) | |
| Secondary | 23 (11) | 216 (28) | 239 (25) | |
| Subcategory of secondary | ||||
| Prior marrow documenting MDS or MPN (AHD) | NA | 123 (16) | 123 (13) | NA |
| Prior cytotoxic therapy, no AHD | 23 (11) | 72 (9) | 95 (10) | .53 |
| Both AHD and prior cytotoxic therapy | NA | 21 (3) | 21 | NA |
| Morphologic blasts, % | <.001 | |||
| Mean | 14 | 45 | 34 | |
| Range | 10-19.8) | 0-100 | 0-100 | |
| ELN 2017 risk group | <.001 | |||
| Favorable | 11 (5) | 189 (25) | 200 (21) | <.0001 |
| Intermediate | 98 (49) | 293 (38) | 391 (40) | .009 |
| Adverse | 89 (44) | 274 (36) | 363 (37) | .03 |
| Unknown | 4 (2) | 13 (2) | 17 (2) | .76 |
| Induction intensity | .038 | |||
| High | 137 (68) | 577 (75) | 714 (75) | |
| Low | 65 (32) | 192 (25) | 257 (26) | |
| CR | ||||
| CRMRD− | 59 (29) | 359 (47) | 418 (43) | <.001 |
| CR or CRi | 117 (58) | 530 (69) | 647 (67) | .0043 |
| Treatment with allogeneic HCT | 90 (45) | 270 (35) | 960 (37) | .02 |
Data presented as n (%) unless otherwise indicated.
AHD, antecedent hematologic disorder; CRi, CR with incomplete hematologic recovery; CRMRD−, CR without measurable residual disease.
Rates of CR or CRi and of CRMRD− (determined by multiparameter flow cytometry) were higher in AML (Table 1); OS, event-free survival (EFS), and relapse-free survival (RFS) in patients achieving CR/CRi (but not CRMRD−) were also superior in AML (Figure 1). However, after accounting for the covariates listed in Table 1, whether a patient had AML or MDS-EB2 did not affect OS or EFS (Table 2), likely reflecting that AML patients were less likely to be in the ELN 2017 adverse- (P = .03) or intermediate-risk group (P = .009) and more likely to be in the favorable-risk group (P < .001; Table 1), with ELN 2017 having a major impact on both survival and EFS (Table 2). Although the discrepancies were not as great as with ELN 2017, AML patients were more likely than MDS-EB2 patients to receive intensive induction (Table 1), which was also associated with improved OS and EFS (Table 2).
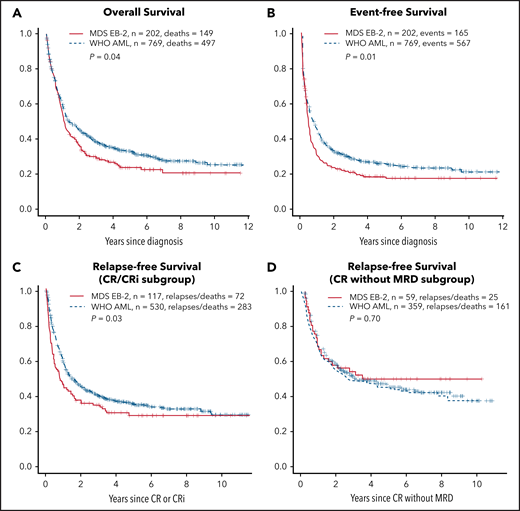
OS, EFS, and RFS for CR/CRi subgroup and CR without MRD subgroup. OS (A); EFS (B); RFS for CR/CRi subgroup (C); CR without MRD subgroup (D). The y-axes show probabilities of indicated outcomes. Univariate log-rank P values are as indicated.
OS, EFS, and RFS for CR/CRi subgroup and CR without MRD subgroup. OS (A); EFS (B); RFS for CR/CRi subgroup (C); CR without MRD subgroup (D). The y-axes show probabilities of indicated outcomes. Univariate log-rank P values are as indicated.
Multivariable models
| Variable | OS HR (95% CI) | EFS HR (95% CI) | CR or CRi OR (95% CI) | RFS if CR/CRi HR (95%CI) |
|---|---|---|---|---|
| WHO AML (ref MDS-EB2) | 0.89 (0.74-1.07) | 0.89 (0.75-1.06) | 1.06 (0.99-1.13) | 0.66 (0.53-0.83) |
| P | .21 | .2 | .11 | <.001 |
| Age (per 10 y) | 1.3 (1.22-1.38) | 1.19 (1.13-1.26) | 0.98 (0.96-1) | 1.13 (1.05-1.2) |
| P | <.001 | <.001 | .02 | <.001 |
| PS 2-4 (ref PS 0-1) | 2 (1.68-2.37) | 1.68 (1.42-1.99) | 0.87 (0.82-0.93) | 1.21 (0.96-1.51) |
| P | <.001 | <.001 | <.001 | .11 |
| ELN 2017 intermediate risk (ref favorable risk) | 1.7 (1.34-2.15) | 1.72 (1.38-2.14) | 0.86 (0.8-0.93) | 2.15 (1.67-2.76) |
| P | <.001 | <.001 | <.001 | <.001 |
| ELN 2017 adverse risk (ref favorable risk) | 2.28 (1.8-2.88) | 2.29 (1.84-2.85) | 0.78 (0.73-0.84) | 3.07 (2.35-4) |
| P | <.001 | <.001 | <.001 | <.001 |
| Secondary (ref de novo) | 1.3 (1.1-1.55) P = 0.002 | 1.28 (1.08-1.5) P = 0.004 | 0.93 (0.87-0.99) P = 0.02 | 1.16 (0.93-1.43) P = 0.18 |
| P | .002 | .004 | .02 | .18 |
| Low-intensity induction (ref high intensity) | 1.3 (1.08-1.55) | 1.62 (1.36-1.93) | 0.7 (0.66-0.75) | 1.07 (0.82-1.38) |
| P | .004 | <.001 | <.001 | .63 |
| Allogeneic HCT (ref no allogeneic HCT) | 0.48 (0.39-0.6) | 0.39 (0.31-0.47) | Not applicable | 0.29 (0.23-0.36) |
| P | <.001 | <.001 | <.001 |
Time-dependent Cox regression for OS, EFS, and RFS; logistic regression for CR/CRi and CRMRD−.
HR, hazard ratio; OR, odds ratio.
OS is the end point most commonly used for new drug approvals by the FDA, with EFS also commonly used, because it estimates the effect of new drugs independently of therapy administered after relapse or for refractory AML.46 Achievement of CR or CRi was not affected by the AML/MDS-EB2 distinction, although RFS in patients achieving CR/CRi was longer in AML (Table 3). In contrast, AML patients were more likely to achieve CRMRD−, but RFS was similar in such patients regardless of the AML/MDS-EB2 distinction. Notably, however, the effect of AML rather than MDS-EB2 on RFS in CR/CRi (HR, 0.66) was less than that of having ELN intermediate- or adverse-risk disease (HR, 2.15 and 3.07, respectively) or of undergoing HCT (HR, 0.29). Similarly, the effect of AML rather than MDS-EB2 on the rate of CRMRD− (OR, 1.13) was lower than that of having ELN intermediate- or adverse-risk disease (OR, 0.82 and 0.71, respectively) and similar to that of having secondary AML (OR, 0.88). Results were essentially the same (data not shown) when blast percentage was examined in deciles (10%-19%, 20%-20%, 30%-39% … 90%-99%), thus providing a clinical counterpart to the observation by Walter et al31 of a lack of relation between blast percentage and tumor burden assessed using genetic methods to estimate percent clonal cells by genetic methods.
Multivariable models
| Variable | CRMRD− OR (95% CI) | RFS if CRMRD− HR (95% CI) |
|---|---|---|
| WHO AML (ref = MDS EB2) | 1.13 (1.05-1.21) | 0.8 (0.56-1.15) |
| P | <.001 | .23 |
| Age (per 10 y) | 0.97 (0.95-0.99) | 1.18 (1.08-1.3) |
| P | .004 | <.001 |
| PS 2-4 (ref PS 0-1) | 0.92 (0.86-0.98) | 1.12 (0.82-1.53) |
| P | .01 | .48 |
| ELN 2017 intermediate risk (ref favorable risk) | 0.82 (0.75-0.88) | 2.14 (1.57-2.93) |
| P | <.001 | <.001 |
| ELN 2017 adverse risk (ref favorable risk) | 0.71 (0.65-0.77) | 2.58 (1.8-3.7) |
| P | <.001 | <.001 |
| Secondary (ref de novo) | 0.88 (0.82-0.94) | 0.85 (0.61-1.18) |
| P | <.001 | .33 |
| Low-intensity induction (ref high intensity) | 0.76 (0.71-0.82) | 1.18 (0.81-1.72) |
| P | <.001 | .39 |
| Allogeneic HCT (ref no allogeneic HCT) | Not applicable | 0.27 (0.2-0.38) |
| P | <.001 |
Time-dependent Cox regression for RFS; logistic regression for CRMRD−.
The expected prognostic impacts of ELN 2017 risk group, age, treatment with HCT, performance status, and secondary AML suggest the Seattle data set is representative of usual experience. Median follow-up of our patients remaining alive in remission was ∼4 years. Although the probability of relapse or death resulting from AML seems to decline sharply after remission lasting for 3 years,47 there were patients lost to follow-up, and these may have had worse OS, EFS, or RFS than other patients. The proportion of our MDS-EB2 patients who received high-intensity induction (68%) is likely higher than the proportion at other centers. Furthermore, we found that, after accounting for covariates, high-intensity therapy was associated with better OS and EFS, which is not necessarily the general experience. However, the lack of more widespread use of intensive therapy in EB2 is precisely the practice that we are challenging, and we hope our data stimulate comparison of intensive vs nonintensive therapy for MDS-EB2 patients in randomized prospective trials. HCT, particularly in first CR, may also have been more commonly used in Seattle than elsewhere. However, within the limits of patient numbers and events, interaction terms indicated the effects of the AML/MDS-EB2 distinction on outcomes were similar regardless of intensity of induction or treatment with HCT (P > .05 for all outcomes). A related important question is whether differences in outcome between AML and MDS-EB2 might be more obvious in other subgroups defined, for example, by age or ELN.
We cannot retrospectively assess the possible role of latent variables (eg, selection bias) in determining which patients received AML-type and which MDS-type therapy, although we attempted to adjust for this by including variables such as age and performance status. A trial randomly assigning patients with WHO-defined AML or MDS-EB2 to the same therapies would be needed to evaluate the effect of such latent variables, recognizing that several such trials might be needed to account for various subgroups defined by ELN, age, and other variables. In the shorter term, European studies that have included MDS-EB2 patients in their AML trials might serve as validation cohorts for the Seattle cohort to possibly reduce the effect of selection bias.
Discussion
We observed that the AML/MDS-EB2 distinction had no effect OS or EFS, arguably the 2 most important clinical end points.46 There were only variable/inconsistent effects on CR/CRi and RFS among those achieving CR/CRi and on CRMRD− and RFS among those achieving CRMRD− (Tables 2 and 3). The effects of ELN, HCT, and, in most cases, age, performance status, and secondary AML were greater than those of AML vs MDS-EB2 (Tables 2 and 3). Therefore, particularly given the biologic data described here, we see no compelling reason to determine eligibility for either an AML or MDS trial therapy based solely on a 20% blast cut point, with the burden of proof resting on those who advocate for this cut point.
Nonetheless the 20% blast cut point continues to play a key role, with important consequences for patients. For example, despite sharing the same genetic lesions, patients considered to have MDS-EB2 may be ineligible to receive agents approved only for AML. Examples include gemtuzumab ozogamicin in NPM1-mutated disease49 or gilteritinib in FLT3-ITD–mutated disease.8 Formally, the use of gemtuzumab ozogamicin or gilteritinib in MDS represents off-label use and is therefore not reimbursed in most health care systems. Patients diagnosed with MDS-EB2 are similarly ineligible for important trials of therapies being conducted exclusively in AML. Examples are phase 1 studies of the SYK inhibitor entospletinib50 (registered at www.clinicaltrials.gov as #NCT03013998) and the menin-KMT2a inhibitors KO-53951 (registered at www.clinicaltrials.gov as #NCT04067336) and SNDX-561352 (registered at www.clinicaltrials.gov as #NCT04065399). Likewise, patients with AML are typically ineligible to receive novel lower-intensity therapies under investigation in MDS. The dichotomy between AML and MDS has become so pronounced that separate AML and MDS protocols are used to investigate drugs, such as eprenetapopt (APR 246), which reactivates TP53,53,54 or magrolimab, which restores macrophage checkpoint inhibition,55 despite the similar biologic and clinical implications of TP53 mutations and macrophage checkpoint inhibition in AML and MDS.43,44
Academic trials may be becoming less proscriptive. Eligibility for a trial by HOVON (Dutch-Belgian Hemato-Oncology Cooperative Group) and SAKK (Swiss Group for Clinical Cancer Research) investigating the addition of clofarabine to 7 + 3 included patients with RAEB (MDS-EB in today’s nomenclature).56 Subgroup analyses showed no differences in outcome between AML and MDS-EB.56 Patients with MDS-EB were also eligible for randomization between 7 + 3 with or without lenalidomide in a study conducted by the same groups, with potential differences in outcome between AML and MDS not reported.57 Ongoing HOVON/AMLSG (German-Austrian Acute Myeloid Leukemia Study Group) trials examining 7 + 3 with or without ivosidenib/enasidenib (registered at www.clinicaltrials.gov as #NCT03839771) and 7 + 3 plus midostaurin or gilteritinib (registered at www.clinicaltrials.gov as #NCT04027309) allow patients with either AML or MDS-EB2 to enroll. The Fred Hutchinson Cancer Research Center/University of Washington often enrolls patients with MDS-EB2 in trials of newly diagnosed AML,46 as does MD Anderson Cancer Center,58 which found little evidence that marrow blast percentage considered as 10% to 19%, 20% to 29%, or ≥30% had independent effects on survival in patients age <60, 60 to 69, or ≥70 years.59 However, US cooperative groups generally restrict trials to either AML or MDS based on the 20% blast count criterion. Pharmaceutical company–sponsored trials, particularly important as the source of many novel treatments, have similarly adhered to the 20% cut point, likely reflecting the continued emphasis by the FDA on this cut point.
We propose that patients with NPM1, FLT3, or TP53 mutations, with KMT2a rearrangements or with inv(3)/t(3:3), be eligible for AML trials regardless of blast count, much as is currently the case in CBF disease. Recognizing that any blast cut point is arbitrary, we further propose that patients with 10% to 30% blasts (AML/MDS) be routinely eligible for both AML and MDS trials. This would allow formal testing of the effect of blast percentage on outcome, especially if such AML/MDS patients were randomly assigned between AML and MDS therapies. Some therapies may be more effective against higher or lower blast count disease, whereas the effectiveness of others may depend on genetic profile irrespective of blast percentage, as suggested for AML therapy in NPM1-mutated disease.40 Although arbitrary, the 10% lower limit and 30% upper limit are based on similar risks of death in patients with >10% to 20% and 21% to 30% blasts in the revised IPSS classification of MDS30 and similar reductions in risk of death in patients receiving azacitidine compared with conventional care regimens regardless of whether patients had MDS-EB2 or 20% to 30% blasts.60 The 30% upper limit could be increased, or the 10% lower limit decreased, based on the results of initial trials. In principle, all patients with >5% blasts might be considered eligible for both AML and MDS studies. However, our clinical data are limited to patients with ≥10% blasts; further study is needed in MDS patients with 5% to 9% blasts. Defining patients as having MDS vs AML based on mutation profile is another possibility. However, many centers around the world do not have access to the extensive molecular testing that would be required or do not receive results in a timely manner. Nonetheless, a uniform genetic evaluation of the current MDS, MPN, and AML designations might eventually allow harmonization of trials and comparison among them.
We believe that creating a 10% to 30% AML/MDS category would give more patients access to a wider variety of treatments and potentially simplify the regulatory approval process, with potential extension of drugs approved for AML to MDS-EB2, while allowing patients with low blast count AML to access drugs used to treat MDS-EB2. We hope our data will stimulate discussion regarding the criteria used to define AML and MDS in future disease classification schemes, such as the WHO classification.61
Acknowledgments
Megan Othus, Fred Hutchinson Cancer Research Center, performed the statistical analyses of the Seattle data and contributed invaluable advice about their interpretation, and Carole Shaw, Fred Hutchinson Cancer Research Center, collected data on the Seattle patients.
We dedicate this article to Elihu Estey. Over many years, Elihu Estey was a thought leader in hematology, in particular in the field of malignant myeloid disorders. He made seminal contributions to the development of new treatments for our patients suffering from myelodysplastic syndrome and acute leukemia, and also opened new avenues for designing clinical trials, integrating seamlessly his mathematics background. We always knew Elihu Estey as a rigorous clinical scientist and as an outstanding representative of academic medicine. We admired his sharp and brilliant mind. We have lost a great colleague and a wonderful friend.
Authorship
Contribution: All authors jointly formulated the topic, collected and interpreted data, and wrote, critically reviewed, and approved the manuscript before submission.
Conflict-of-interest disclosure: E.E. reports consultancy for AbbVie, Bristol-Myers Squibb, Pfizer, and Up-to-Date and clinical research funding to institution from AbbVie, Amgen, Aptevo, Bayer, Biosight, ImmunoGen, Janssen, Kura, Macrogenics, Menarini Ricerche, and Pfizer. H.D. reports consultancy for AbbVie, Agios, Amgen, Astellas, Astex Pharmaceuticals, AstraZeneca, Berlin-Chemie, Bristol-Myers Squibb, Celgene, GEMoaB, Helsinn, Janssen, Jazz, Novartis, Oxford Biomedica, and Roche and clinical research funding to institution from Agios, Amgen, Astellas, Bristol-Myers Squibb, Celgene, Jazz Pharmaceuticals, Novartis, and Pfizer. R.P.H. declares no competing financial interests.
Elihu Estey died on 8 October 2021.
Correspondence: Hartmut Döhner, Department of Internal Medicine III, Ulm University Hospital, Albert-Einstein-Allee 23, 89081 Ulm, Germany; e-mail: hartmut.doehner@uniklinik-ulm.de.

This feature is available to Subscribers Only
Sign In or Create an Account Close Modal