

Key Points
Hemogen recruits coactivator BRG1 and repels corepressor NuRD complex to establish open chromatin in erythroid cells.
Hemogen facilitates chromatin looping for promoter/enhancer activation in the GATA1/LDB1 complex context.

Abstract
Hemogen is a hematopoietic tissue–specific gene that regulates the proliferation and differentiation of hematopoietic cells; however, the mechanism underlying its function in erythropoiesis is unknown. We found that depletion of hemogen in human CD34+ erythroid progenitor cells and HUDEP2 cells significantly reduced the expression of genes associated with heme and hemoglobin synthesis, supporting a positive role for hemogen in erythroid maturation. In human K562 cells, hemogen antagonized the occupancy of corepressors nucleosome remodeling and histone deacetylase (NuRD) complex and facilitated LDB1 complex–mediated chromatin looping. Hemogen recruited SWI/SNF complex ATPase BRG1 as a coactivator to regulate nucleosome accessibility and H3K27ac enrichment for promoter and enhancer activity. To determine whether hemogen/BRG1 cooperativity is conserved in mammalian systems, we generated hemogen-knockout/knockin mice and investigated hemogen/BRG1 function in murine erythropoiesis. Loss of hemogen in embryonic days 12.5 to 16.5 fetal liver cells impeded erythroid differentiation through reducing the production of mature erythroblasts. Chromatin immunoprecipitation sequencing in wild-type and hemogen-knockout animals revealed that BRG1 is largely dependent on hemogen to regulate chromatin accessibility at erythroid gene promoters and enhancers. In summary, the hemogen/BRG1 interaction in mammals is essential for fetal erythroid maturation and hemoglobin production through its active role in promoter and enhancer activity and chromatin organization.
Introduction
During erythropoiesis, the process of red blood cell development and maturation, cells undergo a series of commitment and differentiation steps that are accompanied by progressive size reduction, cell cycle arrest, massive globin polypeptide synthesis, and enucleation.1 These cellular events are tightly regulated through cell type–specific transcriptional programs that are driven by specific combinations of lineage-restricted transcription factors that function through the recruitment and/or stabilization of cofactors at target genes, leading to proper gene expression programs.2,3
GATA1 is a central transcription factor of erythropoiesis and recruits coregulator complexes for gene activation and repression in a context-dependent manner. GATA1 forms a complex with DNA-binding transcription factor SCL/TAL1 and scaffolding proteins LMO2 and LDB1 to mediate enhancer contact with target promoters for gene activation.4-6 GATA1 and LDB1 recruit chromatin modifiers CBP/P300 and SWI/SNF catalytic subunit BRG1 to the β-globin locus control region (LCR) to promote erythroid differentiation and the formation of higher-order chromatin loops.5,7-10 In contrast, corepressor ETO2 is important for GATA1/LDB1 complex–negative vs -positive function through recruitment of the nucleosome remodeling and histone deacetylase (NuRD) complex.11-14
A large-scale quantitative proteomic study of transcription factors and cofactors in erythropoiesis revealed that corepressors are dramatically more abundant than coactivators at the protein level, but not at the RNA level.15 The data showed a general trend with coactivators CBP/P300 and MLL3 being, on average, 100 times less abundant than corepressors HDAC1-3 and CHD4. These data raise the question of how transcription factors compete to recruit a limited number of coactivators to antagonize corepressors in specific cellular contexts. How coactivator/corepressor recruitment and antagonism are balanced in erythropoiesis is poorly understood.
Hemogen (also known as erythroid differentiation-associated gene [EDAG]) plays an important role in cell proliferation, differentiation, expansion, and apoptosis in different cell types.16-19 Hemogen participates in GATA1 acetylation and co-occupies GATA1 target genes (eg, EKLF, HBB, GYPA, and SLC4A1) in primary erythroid cells.20,21 Hemogen is enriched at the putative regulatory elements upstream of the HBD globin gene.22 However, the mechanisms underlying hemogen function in erythropoiesis and the interplay between hemogen and cofactors in gene regulatory networks are unclear.
We found that, in human erythroid progenitor cells, hemogen collaborated with LDB1 to promote chromatin looping. As an erythroid activator, hemogen recruited chromatin remodeling complex SWI/SNF catalytic subunit BRG1 and antagonized repressive NuRD complex occupancy for regulation of enhancer and promoter activity. During mouse embryonic erythropoiesis, loss of hemogen released BRG1 from occupied sites and impaired chromatin accessibility of genes associated with erythrocyte maturation. Overall, hemogen/BRG1 cooperativity in the context of the LDB1 complex plays a critical role in fetal erythropoiesis.
Materials and methods
Cell culture
Primary CD34+ umbilical cord cells (Lonza; cat. #2C-101) were cultured, as described.23 HUDEP2 cells were cultured in serum-free expansion medium (SFEMII, STEMCELL Technologies; cat. #09655) and induced in Dulbecco’s modified Eagle medium, as described.24 K562 cells were cultured in RPMI 1640, 10% fetal bovine serum.
RNA interference and lentivirus production
A short hairpin RNA plasmid targeting HEMGN (clone ID: TRCN0000430486; Sigma) was used to knock down expression of hemogen in human umbilical cord CD34+ and HUDEP2 cells. The plasmid was electroporated into CD34+ cells at differentiation day 7 using a human CD34+ cell Nucleofector kit (VAPA-1003; Lonza). Lentivirus was generated by transfecting HEK293T cells with pLKO.1, pMD2.G, and psPAX2 using Lipofectamine 2000 (Invitrogen, Carlsbad, CA), following the Addgene protocol. HUDEP2 cells were incubated with viral supernatant and 10 μg/mL Polybrene and selected by puromycin for 7 days. Stable selected cells were checked by western blotting for protein expression.
RNA sequencing
RNA was isolated (500 ng CD34+ and HUDEP2 cells; 1 μg K562 and embryonic day 14.5 [E14.5] fetal liver cells) and RNA sequencing (RNA-seq) libraries were prepared with an Illumina TruSeq Stranded mRNA Library Preparation kit (20020594), following the manufacturer’s protocol. Library quality was validated using a High Sensitivity DNA Chip in an Agilent Bioanalyzer 2100. Samples were sequenced on a HiSeq instrument (Illumina) by the National Institute of Diabetes and Digestive and Kidney Diseases (NIDDK) Genomics Core.
Fluorescence-activated cell sorting
Fetal livers and bone marrow were manually dissociated to single-cell suspensions and stained with APC Rat Anti-Mouse TER-119 (BD Pharmingen; cat. #557909) and PE Rat Anti-Mouse CD71 (BD Pharmingen; cat. #553267). Cell populations were purified using the BD FACSAria III Cell Sorter. Gating thresholds were set to eliminate unviable cells and separate multiple events (populations S0-S4/5 in fetal liver cells, populations E1-E4 in bone marrow cells).25,26
CRISPR/Cas9 gene editing
The hemogen-knockout (KO) single guide RNA (http://crispr.mit.edu/) was cloned into pSpCas9(BB)-2A-GFP (Addgene; plasmid #48138) and electroporated into K562 cells with a Nucleofector Kit V (Lonza; cat. #VCA-1003). Single-cell clones were isolated by FACS sorting for GFP expression 48 hours following electroporation. See supplemental Table 1 for sgRNA sequences (available on the Blood Web site)
Western blotting and coimmunoprecipitation
Nuclear protein extraction and western blotting were performed as described.5,14 The antibodies used are included in supplemental Table 2.
RNA isolation and reverse transcription quantitative PCR
RNA from K562 cells and fetal liver cells was isolated using an RNeasy Mini Kit (Qiagen; cat. #74104) and a PicoPure RNA Isolation Kit (Thermo Fisher Scientific; cat. #KIT0202), respectively. Complementary DNA was generated using SuperScript III First-Strand Synthesis SuperMix (ThermoFisher Scientific; cat. #18080400), following the manufacturer’s instructions. Quantitative polymerase chain reaction (PCR) was performed using iTaq Universal SYBR Green Super Mix (Bio-Rad Laboratories; cat. #172-5120) and a 7900HT Real-Time PCR instrument (Applied Biosystems). See supplemental Table 2 for PCR primer sequences.
ChIP-qPCR, ChIPmentation, and ChIP-seq
Chromatin immunoprecipitation quantitative PCR (ChIP-qPCR) was performed as described27 using formaldehyde (H3K27ac, polymerase II, serine 5 phosphorylated polymerase II, GATA1, TAL1, and LDB1) or dual EGS/formaldehyde crosslinking (all other antibodies). The comparative CT method was applied to calculate the relative enrichment of sequences of interest over input. ChIPmentation is a technique that combines ChIP with sequencing library preparation by Tn5 transposase (tagmentation). ChIPmentation for H3K27ac was performed, as described.14 Chromatin immunoprecipitation sequencing (ChIP-seq), library preparation, and processing followed the manufacturer’s protocol (ThruPlex DNA-Seq Kit; Takara Bio; cat. #R400675). See supplemental Table 1 for ChIP primers and supplemental Table 2 for antibodies.
Chromosome conformation capture
Chromosome conformation capture (3C) was performed with EcoRI cleavage, as described.28 Relative crosslinking between the anchor fragment and fragments of interest was analyzed by real-time qPCR with SYBR Green Supermix. Interaction between 2 fragments of α-tubulin served as internal normalization control. 3C primers were reported previously.13
MNase digestion
Nucleosome digestion was carried out as described.29 See supplemental Table 2 for primer sequences.
CRISPR-Cas9 editing to generate hemogen-knockout and hemagglutinin-tagged mice
Mouse protocols were approved by the NIDDK Animal Care and Use Committee in accordance with American Association for Accreditation of Laboratory Animal Care (AAALAC) specifications. See supplemental Materials and methods for details about mouse breeding.
Immunofluorescence
Fetal livers were manually dissociated to single-cell suspensions and seeded onto slides. Slide preparation and antibody incubation followed the Abcam protocol. See supplemental Table 2 for antibodies.
Wright-Giemsa and benzidine staining
Wright-Giemsa staining (Sigma-Aldrich; cat. #WG16) followed the manufacturer’s protocol. Slides were incubated with freshly prepared benzidine solution (3% acetic acid, 0.2% benzidine, and 0.3% H2O2) at room temperature for 1 to 5 minutes in the dark.
ATAC-seq
E14.5 fetal liver cells (∼50 000) were treated according to the Omni–Assay for Transposase Accessible Chromatin with high throughput sequencing (ATAC-seq) protocol of the Kaestner Lab (Perelman School of Medicine, University of Pennsylvania, Philadelphia, PA; https://www.med.upenn.edu/kaestnerlab/protocols.html).
Data analysis
For complete data analysis, see supplemental Materials and methods.
Results
Hemogen is a positive regulator of erythroid differentiation and hemoglobinization in human erythroid progenitor cells
To comprehensively examine the scope of hemogen function during erythroid differentiation, we performed RNA interference to knockdown (KD) hemogen at day 7 of differentiation of human cord blood CD34+ cells (Figure 1A; supplemental Figure 1A). FACS analysis of CD71- and CD235a-stained CD34+ cells showed that maturational progression was reduced upon hemogen loss (supplemental Figure 1B).21 Wright-Giemsa staining at differentiation day 14 indicated reduced numbers of enucleated cells upon hemogen KD (supplemental Figure 1C). RNA-seq principal component analysis confirmed distinct transcriptomes between wild-type (WT) and hemogen-KD cells during differentiation (supplemental Figure 1D). Hemogen KD downregulated the transcription of genes involved in heme biosynthesis (CPOX, ALAS2, FECH, HMBS, and PPOX), red cell cytoskeleton (GYPA, EPOR, EPB41/2, and KEL), and hemoglobinization (HBB), which was confirmed at the protein level (Figure 1B; supplemental Figure 1E-F). Gene Ontology (GO) term analysis further revealed that downregulated genes were enriched for heme metabolic and biosynthetic processes (Figure 1C). Upregulated genes were associated with regulation of apoptotic signaling and myeloid cell differentiation pathways, consistent with previously reported functions of EDAG.16,19,30 Depletion of hemogen suppressed the expression of genes involved in heme biosynthesis and hemoglobinization throughout differentiation (Figure 1D).
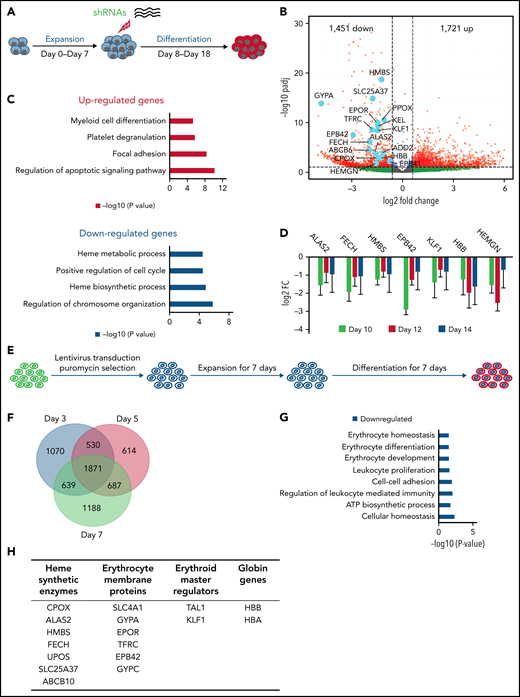
Reduction of hemogen suppresses expression of genes associated with erythrocyte maturation and hemoglobinization in human CD34+ cells and HUDEP2 cells. (A) Schematic diagram of short hairpin RNA (shRNA) KD of hemogen in CD34+ human umbilical cord erythroid progenitor cells. (B) Volcano plot showing differential gene expression between WT and hemogen-KD CD34+ cells at differentiation day 10. Downregulated and upregulated genes are defined by an adjusted P value <.1 and log2 fold change less than −0.6 or >0.6, respectively. Light blue dots highlight erythroid genes that were significantly downregulated upon hemogen KD. (C) GO terms enriched among genes that were significantly up- or downregulated upon hemogen KD in CD34+ cells at differentiation day 10. (D) Expression of erythroid-related and globin genes is shown as log2 fold change in hemogen-KD cells relative to control CD34+ cells during differentiation days 10 to 14. (E) Schematic diagram of shRNA-mediated KD of hemogen in human HUDEP2 cells. (F) Venn diagram of overlapped genes that were downregulated upon hemogen KD at differentiation days 3, 5, and 7. (G) GO analysis of overlapped genes from (F). (H) Examples of genes that were downregulated by hemogen KD in differentiated HUDEP2 cells from (F).
Reduction of hemogen suppresses expression of genes associated with erythrocyte maturation and hemoglobinization in human CD34+ cells and HUDEP2 cells. (A) Schematic diagram of short hairpin RNA (shRNA) KD of hemogen in CD34+ human umbilical cord erythroid progenitor cells. (B) Volcano plot showing differential gene expression between WT and hemogen-KD CD34+ cells at differentiation day 10. Downregulated and upregulated genes are defined by an adjusted P value <.1 and log2 fold change less than −0.6 or >0.6, respectively. Light blue dots highlight erythroid genes that were significantly downregulated upon hemogen KD. (C) GO terms enriched among genes that were significantly up- or downregulated upon hemogen KD in CD34+ cells at differentiation day 10. (D) Expression of erythroid-related and globin genes is shown as log2 fold change in hemogen-KD cells relative to control CD34+ cells during differentiation days 10 to 14. (E) Schematic diagram of shRNA-mediated KD of hemogen in human HUDEP2 cells. (F) Venn diagram of overlapped genes that were downregulated upon hemogen KD at differentiation days 3, 5, and 7. (G) GO analysis of overlapped genes from (F). (H) Examples of genes that were downregulated by hemogen KD in differentiated HUDEP2 cells from (F).
Next, we stably knocked down hemogen in HUDEP2, a cell line established from human erythroid progenitor cells (Figure 1E; supplemental Figure 2A). Hemogen KD dramatically changed the transcriptome compared with WT cells, before and after differentiation (supplemental Figure 2B). Nearly equal numbers of genes were up- or downregulated by hemogen KD during differentiation (supplemental Figure 2C-F). We found that 1871 genes were consistently downregulated upon hemogen reduction in HUDEP2 cells during differentiation (Figure 1F). GO analysis of this cohort of genes revealed enrichment in the biological pathway of erythrocyte homeostasis, erythrocyte differentiation, and erythrocyte development (Figure 1G). Heme synthesis and erythrocyte cytoskeleton genes and HBB and HBA were all downregulated upon loss of hemogen in HUDEP2 cells (Figure 1H; supplemental Figure 2G). Altogether, hemogen is a key factor that is involved in erythroid differentiation of human CD34+ progenitor cells and HUDEP2 cells.
Hemogen antagonizes corepressor occupancy and facilitates chromatin looping in the LDB1 complex context
We noted that the signature erythroid maturation genes displayed in Figure 1H that are downregulated after hemogen loss are all upregulated after loss of repressor protein ETO2 in human K562 cells.14 Moreover, our previous data showed that ETO2 recruits NuRD into the LDB1 complex in K562 cells. To explore how hemogen cooperates with transcription regulators in erythropoiesis, we performed CRISPR-Cas9 editing in K562 cells and generated 3 hemogen-KO clones by targeting the HEMGN gene promoter, exon 1, and exon 2 (supplemental Figure 3A-C). The promoter targeted clone (KO1) that abolished transcription and translation of hemogen was used to investigate hemogen function.
RNA-seq in WT and hemogen-KO K562 cells confirmed hemogen as an activator for globin genes (HBG1, HBG2,and HBA) and erythroid maturation markers (EPOR, HMBS, and EPB42), as in CD34+ and HUDEP2 cells (Figure 2A). GO analysis showed that, upon hemogen loss, downregulated genes were enriched in pathways related to hematopoietic progenitor cell differentiation, chromosome organization, and hemoglobin complex (supplemental Figure 3D). In contrast, upregulated genes were involved in biological pathways of histone modification regulation. Indeed, by comparing log2-fold change plots, we observed that erythroid genes downregulated in hemogen-KO cells were upregulated in transcriptional repressor ETO2-KO cells (Figure 2B).
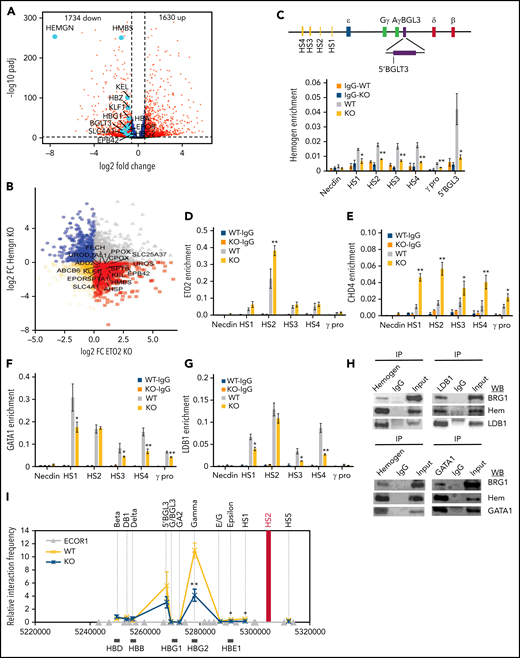
Loss of hemogen increases the recruitment of corepressors and decreases enhancer/promoter looping in the context of the LDB1 complex in human K562 cells. (A) Volcano plot showing differential gene expression between hemogen-KO and WT K562 cells. Dashed vertical lines represent log2 fold change (−0.6 and +0.6). Dashed horizontal line represents adjusted P value < .05. Light blue dots highlight erythroid genes that were significantly downregulated upon hemogen KO (n = 3 biological replicates). (B) Lfc-lfc plot comparing HEMGN-KO and CBFA2T3 (ETO2)-KO dysregulated genes in K562 cells. Red squares represent genes that were positively regulated by HEMGN and negatively regulated by ETO2. Genes of interest are labeled. ChIP-qPCR for hemogen (C), ETO2 (D), and CHD4 (E) occupancy in the β-globin locus in hemogen-KO and WT K562 cells. ChIP-qPCR for GATA1 (F) and LDB1 (G) occupancy in the β-globin locus in hemogen-KO and WT K562 cells. (H) Coimmunoprecipitation (IP) and western blot analysis of interaction between hemogen (hem) and LDB1, GATA1 or BRG1. (I) Chromosome conformation capture (3C) interactions between the β-globin LCR (anchor) and genes in hemogen-WT and -KO K562 cells. Error bars represent standard deviation. N = 3 biological replicates. *P < .05, **P <.01, 2-tailed Student t test. IgG, immunoglobulin G.
Loss of hemogen increases the recruitment of corepressors and decreases enhancer/promoter looping in the context of the LDB1 complex in human K562 cells. (A) Volcano plot showing differential gene expression between hemogen-KO and WT K562 cells. Dashed vertical lines represent log2 fold change (−0.6 and +0.6). Dashed horizontal line represents adjusted P value < .05. Light blue dots highlight erythroid genes that were significantly downregulated upon hemogen KO (n = 3 biological replicates). (B) Lfc-lfc plot comparing HEMGN-KO and CBFA2T3 (ETO2)-KO dysregulated genes in K562 cells. Red squares represent genes that were positively regulated by HEMGN and negatively regulated by ETO2. Genes of interest are labeled. ChIP-qPCR for hemogen (C), ETO2 (D), and CHD4 (E) occupancy in the β-globin locus in hemogen-KO and WT K562 cells. ChIP-qPCR for GATA1 (F) and LDB1 (G) occupancy in the β-globin locus in hemogen-KO and WT K562 cells. (H) Coimmunoprecipitation (IP) and western blot analysis of interaction between hemogen (hem) and LDB1, GATA1 or BRG1. (I) Chromosome conformation capture (3C) interactions between the β-globin LCR (anchor) and genes in hemogen-WT and -KO K562 cells. Error bars represent standard deviation. N = 3 biological replicates. *P < .05, **P <.01, 2-tailed Student t test. IgG, immunoglobulin G.
The corepressor ETO2 confers negative function upon the LDB1 complex in erythropoiesis by affecting transcription factor binding and restructuring chromatin organization.14 We speculated that hemogen may antagonize repressor regulation in the LDB1 complex context. To test this hypothesis, we carried out chromatin immunoprecipitation to investigate LDB1 and NuRD recruitment in the β-globin gene locus after hemogen loss. Hemogen occupied enhancers (LCR and BGLT3) and the γ-globin promoter in control K562 cells (Figure 2C). Loss of hemogen increased ETO2 recruitment in LCR HS2 and dramatically increased NuRD recruitment (CHD4, MTA2, HDAC1, and RBBP4) at the LCR and γ-globin promoter (Figure 2D-E; supplemental Figure 4A-C).
In contrast to corepressors, loss of hemogen greatly impaired enrichment of LDB1 and complex member GATA1, but not TAL1, in the LCR and γ-globin promoter (Figure 2F-G; supplemental Figure 4D), strongly supporting that antagonism between hemogen and corepressors is associated with the LDB1 complex. Moreover, a coimmunoprecipitation assay identified interactions between hemogen and LDB1 and complex member GATA1 (Figure 2H). Consistent with decreased transcription in the β-globin gene locus after hemogen loss, we also observed decreased RNA polymerase II and serine 5 phosphorylated polymerase II at these sites (supplemental Figure 4E-F).
Given that LDB1 is a chromatin loop regulator, we performed 3C to investigate chromatin looping changes upon hemogen loss. Hemogen KO significantly repressed LCR-γ–globin and LCR-ɛ–globin looping (Figure 2I). In addition, looping between enhancer BGLT3 and γ-globin was disrupted in hemogen-KO cells (supplemental Figure 4G). In summary, hemogen antagonized NuRD-mediated negative function of the LDB1 complex and facilitated enhancer-promoter looping for β-globin–like gene activation.
Hemogen interacts with the SWI/SNF complex to activate erythroid genes
The activity of hemogen to antagonize corepressor recruitment to the LDB1 complex prompted us to ask whether hemogen can cooperate with coactivators for gene activation. We conducted hemogen protein pull-down and mass spectrometry and recovered multiple components of the SWI/SNF complex and cohesin complexes (Figure 3A). Coimmunoprecipitation confirmed that hemogen can pull-down SWI/SNF complex BRG1(BAF190), BAF170, and BAF47 (Figure 3B). Reciprocally, these SWI/SNF components pull-down hemogen. The interaction between hemogen and BRG1 also occurred in the LDB1 complex context (Figure 2H).
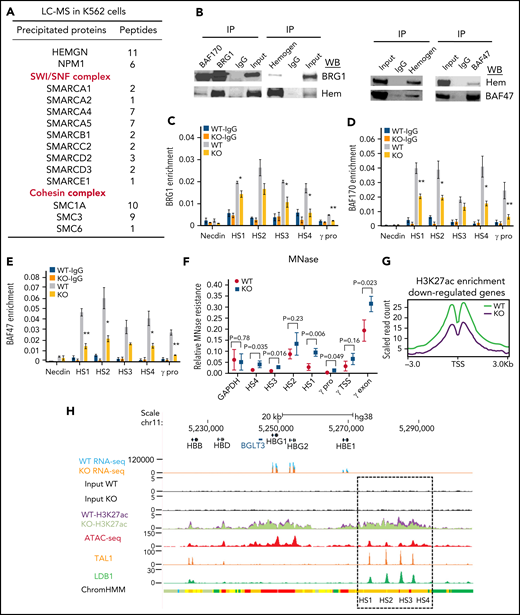
Hemogen interacts with the SWI/SNF complex and affects H3K27ac enrichment at erythroid promoters and enhancers. (A) Mass spectrometry analysis identifies interaction between hemogen and the SWI/SNF and cohesin complexes. (B) Coimmunoprecipitation (IP) analysis of interactions between hemogen (hem) and SWI/SNF components BRG1, BAF170, and BAF47. ChIP-qPCR for BRG1 (C), BAF170 (D), and BAF47 (E) occupancy in the β-globin locus in hemogen-KO and WT K562 cells. (F) MNase-qPCR showing sensitivity of the β-globin locus to digestion in hemogen-KO and WT K562 cells. (G) Normalized peak density plot showing H3K27ac enrichment in WT and hemogen-KO cells at the TSSs of downregulated genes shown in Figure 2A (n = 3 biological replicates). (H) RNA-seq, H3K27ac, and ATAC-seq signals in the β-globin locus. ATAC-seq data from ENCODE. Dashed box encloses the β-globin LCR. Error bars in (C-F) represent standard deviation. n = 3 biological replicates. *P < .05, **P <.01, 2-tailed Student t test. IgG, immunoglobulin G.
Hemogen interacts with the SWI/SNF complex and affects H3K27ac enrichment at erythroid promoters and enhancers. (A) Mass spectrometry analysis identifies interaction between hemogen and the SWI/SNF and cohesin complexes. (B) Coimmunoprecipitation (IP) analysis of interactions between hemogen (hem) and SWI/SNF components BRG1, BAF170, and BAF47. ChIP-qPCR for BRG1 (C), BAF170 (D), and BAF47 (E) occupancy in the β-globin locus in hemogen-KO and WT K562 cells. (F) MNase-qPCR showing sensitivity of the β-globin locus to digestion in hemogen-KO and WT K562 cells. (G) Normalized peak density plot showing H3K27ac enrichment in WT and hemogen-KO cells at the TSSs of downregulated genes shown in Figure 2A (n = 3 biological replicates). (H) RNA-seq, H3K27ac, and ATAC-seq signals in the β-globin locus. ATAC-seq data from ENCODE. Dashed box encloses the β-globin LCR. Error bars in (C-F) represent standard deviation. n = 3 biological replicates. *P < .05, **P <.01, 2-tailed Student t test. IgG, immunoglobulin G.
SWI/SNF plays an essential role in chromatin remodeling and epigenetic regulation.31-33 To determine whether SWI/SNF facilitates hemogen activation of genes, we performed ChIP-qPCR for SWI/SNF components and observed that enrichment of BRG1, BAF170, and BAF47 at the LCR HS sites and γ-globin promoter was significantly reduced in hemogen-KO cells (Figure 3C-E). Consistent with the function of SWI/SNF as a nucleosome remodeler,33-35 decreased SWI/SNF binding upon hemogen loss resulted in increased nucleosome occupancy in the β-globin locus (Figure 3F).
So far, the data suggest that hemogen occupies the LCR and γ-globin promoter as part of the LDB1 complex and is required for proper recruitment of BRG1 to regulate nucleosome accessibility and DNA looping between them. These results raise the question whether hemogen globally affects target promoter activity in erythroid cells. We conducted H3K27ac ChIP-seq in WT and hemogen-KO cells as a measure of chromatin activation. Relative enrichment of H3K27ac was globally reduced at transcription start sites (TSSs) of annotated genes downregulated upon loss of hemogen, as illustrated for EPB42 and KEL (Figure 3G; supplemental Figure 5A-B). At the β-globin locus, decreased globin gene expression upon hemogen loss was associated with reduced H3K27ac at the γ-globin promoters and LCR component enhancers (Figure 3H), which was further confirmed by ChIP-qPCR (supplemental Figure 5C). Globally, enhancers called in K562 cells lost H3K27ac in hemogen-KO cells (supplemental Figure 5D). Overall, hemogen cooperates with SWI/SNF and influences H3K27ac, which marks active enhancers and promoters, to alter gene expression.
Hemogen promotes erythroblast maturation and hemoglobinization during mouse embryonic development
To establish an in vivo model to study hemogen function, we conducted CRISPR-Cas9 genome editing to generate Hemgn-KO and Hemgn hemagglutinin (HA)-3xFlag–KI mice (supplemental Figure 6A-E). Immunofluorescence verified the colocalization of signals detected by HA and hemogen antibodies (supplemental Figure 6F). At E14.5 and E16.5, the livers and embryos of Hemgn−/− mice were smaller than control mice, but hemogen-null mice were born at normal Mendelian ratios with no obvious defects (Figure 4A-B; supplemental Figure 7A-B). Hemogen was downregulated during fetal development, as reported previously36,37 (Figure 4C).
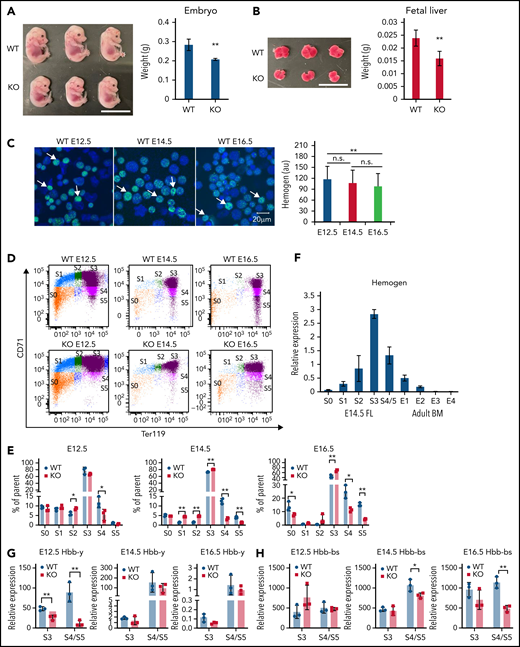
Maturational defect in erythropoiesis and reduction of globin transcription in Hemgn−/− mice.Hemgn−/− mouse E14.5 embryos (A) and livers (B) are smaller in size compared with control littermates. Scale bars, 1 cm. (C) Immunofluorescence indicating that hemogen protein is downregulated during fetal development (E12.5-E16.5) (white arrows). Quantification of hemogen fluorescence intensity in 25 cells (right panel). (D) Flow cytometry with Ter119 (glycophorin A, GYPA) and CD71 (transferrin receptor) staining to separate maturational stages S0-S5 fetal liver cells of Hemgn−/− mice and WT littermates. (E) Quantification of cell numbers in populations S0-S5 in (D). (F) Relative expression level of hemogen to actin in the S0-S5 population of E14.5 fetal liver (FL) and E1-E4 population of bone marrow (BM) cells. Reverse transcription quantitative PCR (RT-qPCR)showing expression of embryonic Hbb-y and adult Hbb-bs in fetal liver cell populations S3 and S4/5 at E12.5, E14.5, and E16.5. Error bars represent standard deviation. N = 3 biological replicates. *P < .05, **P < .01, 2-tailed Student t test. au, arbitrary units.
Maturational defect in erythropoiesis and reduction of globin transcription in Hemgn−/− mice.Hemgn−/− mouse E14.5 embryos (A) and livers (B) are smaller in size compared with control littermates. Scale bars, 1 cm. (C) Immunofluorescence indicating that hemogen protein is downregulated during fetal development (E12.5-E16.5) (white arrows). Quantification of hemogen fluorescence intensity in 25 cells (right panel). (D) Flow cytometry with Ter119 (glycophorin A, GYPA) and CD71 (transferrin receptor) staining to separate maturational stages S0-S5 fetal liver cells of Hemgn−/− mice and WT littermates. (E) Quantification of cell numbers in populations S0-S5 in (D). (F) Relative expression level of hemogen to actin in the S0-S5 population of E14.5 fetal liver (FL) and E1-E4 population of bone marrow (BM) cells. Reverse transcription quantitative PCR (RT-qPCR)showing expression of embryonic Hbb-y and adult Hbb-bs in fetal liver cell populations S3 and S4/5 at E12.5, E14.5, and E16.5. Error bars represent standard deviation. N = 3 biological replicates. *P < .05, **P < .01, 2-tailed Student t test. au, arbitrary units.
To examine maturational progression, fetal liver cells from Hemgn−/− and control mice were sorted by FACS after staining for CD71 and Ter119 (Figure 4D; supplemental Figure 7C). There was a significant impediment to erythroid maturation by the loss of hemogen, with a reduction in the more mature population S4 at all stages examined and reduction of S5 at E14.5 and E16.5 (Figure 4E). Interestingly, in WT fetal liver cells, hemogen expression peaks in the S3 population and is reduced by threefold in S4/5 cells (Figure 4F). By comparison, hemogen expression and protein in adult bone marrow was drastically lower than in fetal liver (Figure 4F; supplemental Figure 7D-E). Thus, hemogen is downregulated during erythroid maturation of mouse fetal liver cells and during fetal liver development: hemogen expression is dramatically reduced further in adult bone marrow compared with fetal liver. The paucity of hemogen in adult bone marrow suggests that it may exert its positive effect on erythroid differentiation primarily at fetal stages.
To determine whether hemogen loss affects hemoglobinization in mature erythroid cells, we determined the expression of globin genes in WT and Hemgn−/− S3-S5 populations. During differentiation, Hbb-y expression peaks and gradually diminishes, and Hbb-bs increases to 99.9% of total hemoglobin. At E12.5, Hbb-y expression in S3 and S4/S5 populations failed to be upregulated in Hemgn−/− cells compared with controls (Figure 4G). A deficit in Hbb-bs became significant at E14.5 and E16.5, when it becomes the predominant globin to be transcribed (Figure 4H). The impaired hemoglobinization in E16.5 KO cells was confirmed by benzidine staining and western blot experiments (supplemental Figure 7F-G). In summary, the essential role of hemogen in erythroblast maturation during embryonic development in the fetal liver is manifested by promotion of terminal erythrocyte differentiation and full activation of embryonic (Hbb-y) and adult (Hbb-bs) globin gene transcription.
Hemogen functions as a promoter/enhancer activator during murine erythrocyte maturation
We performed hemogen ChIP-seq in HA-tagged KI mice using an HA antibody to investigate whether hemogen plays a positive role in regulatory element activity in vivo. The genomic distribution of HA (hemogen) peaks in E14.5 fetal liver cells was similar at promoters and introns/intergenic regions, the sites of potential enhancers (Figure 5A). In agreement, 42% of hemogen peaks overlapped with TSSs of annotated genes and with enhancers called by EnhancerAtlas 2.0 in E14.5 fetal liver cells (Figure 5B). Hemogen peaks were enriched for motifs of erythroid-related regulators SP1/SP2, STAT1, and Id2 (Figure 5C), which play important roles in erythropoiesis and globin gene transcription.38-41 Notably, the most highly enriched motif at hemogen peaks was GATA1/TAL1, which is the motif recognized by the LDB1 complex.
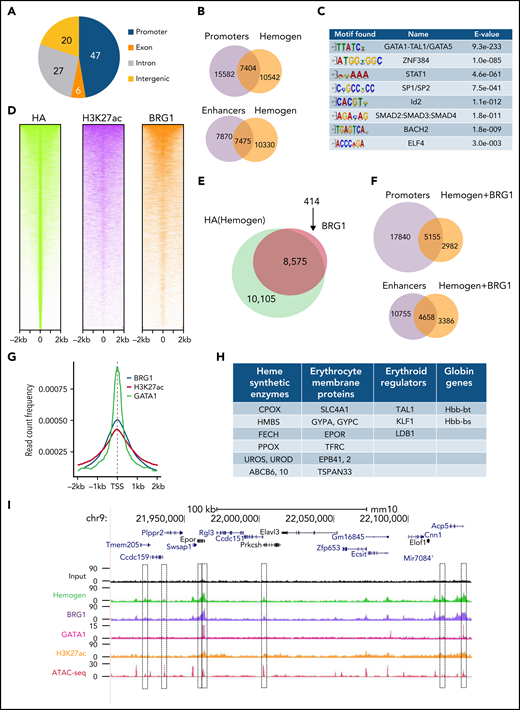
Hemogen is an enhancer and promoter regulator and cooperates with BRG1 in gene activation during mouse development. (A) ChIP-seq with HA antibody in E14.5 fetal liver cells showing the percentage of hemogen peaks at different genomic features (n = 2 biological replicates). (B) Venn diagram showing overlap of hemogen peaks from ChIP-seq with promoters and enhancers called by EnhancerAtlas 2.0. (C) Top motifs from Meme search of hemogen binding sites from ChIP-seq data. (D) Clustered heat maps displaying HA (hemogen)-, H3K27ac-, and BRG1-normalized ChIP-seq signals at hemogen peaks. Each row represents a 2-kb window centered around the peak signal in E14.5 fetal liver cells. (E) Venn diagram of global overlap of BRG1 and hemogen. (F) Overlap of hemogen/BRG1 co-occupied peaks from (E) with enhancers and promoters. (G) Peak density map for BRG1, GATA1, and H3K27ac aligned at HA (hemogen) peaks. (H) Erythroid genes whose promoters are bound by hemogen and BRG1. (I) Erythroid Epor gene showing ChIP-seq localization of hemogen, BRG1, GATA1, H3K27ac ChIP-seq signals, and ATAC-seq signal from ENCODE on the promoter and enhancers.
Hemogen is an enhancer and promoter regulator and cooperates with BRG1 in gene activation during mouse development. (A) ChIP-seq with HA antibody in E14.5 fetal liver cells showing the percentage of hemogen peaks at different genomic features (n = 2 biological replicates). (B) Venn diagram showing overlap of hemogen peaks from ChIP-seq with promoters and enhancers called by EnhancerAtlas 2.0. (C) Top motifs from Meme search of hemogen binding sites from ChIP-seq data. (D) Clustered heat maps displaying HA (hemogen)-, H3K27ac-, and BRG1-normalized ChIP-seq signals at hemogen peaks. Each row represents a 2-kb window centered around the peak signal in E14.5 fetal liver cells. (E) Venn diagram of global overlap of BRG1 and hemogen. (F) Overlap of hemogen/BRG1 co-occupied peaks from (E) with enhancers and promoters. (G) Peak density map for BRG1, GATA1, and H3K27ac aligned at HA (hemogen) peaks. (H) Erythroid genes whose promoters are bound by hemogen and BRG1. (I) Erythroid Epor gene showing ChIP-seq localization of hemogen, BRG1, GATA1, H3K27ac ChIP-seq signals, and ATAC-seq signal from ENCODE on the promoter and enhancers.
To better understand hemogen activation function at regulatory elements, we conducted ChIP-seq for active histone modification H3K27ac and for BRG1 in HA-tagged KI mice (supplemental Figure 8A-B). Hemogen sites were highly co-occupied by H3K27ac and BRG1 (Figure 5D). More than 95% of BRG1 peaks overlapped with hemogen binding sites, and about half of these co-occupied sites overlapped promoters and enhancers (Figure 5E-F). Hemogen peaks strongly correlated with GATA1 peaks from ENCODE, supporting hemogen/BRG1 coregulation of genes during erythropoiesis through sites occupied by the LDB1 complex (Figure 5G). Globally, BRG1 peaks (∼67%) were associated with H3K27ac (supplemental Figure 8C). In addition, BRG1 and hemogen co-occupied peaks were enriched in biological pathways of activating transcription factor binding (supplemental Figure 8D), consistent with their positive role in erythroid gene regulation. Moreover, we found that the promoters and/or enhancers of erythroid signature genes regulated by hemogen were co-occupied by BRG1, as illustrated for Epor, Gypa, and Slc4a1, which had been identified as hemogen/GATA1-occupied genes in CD34+ cells21 (Figure 5H-I; supplemental Figure 8E-F). Overall, ChIP-seq data suggest that hemogen is an activator of promoters and enhancers during erythrocyte maturation in vivo by recruiting BRG1 at LDB1 complex binding sites.
Hemogen/BRG1 cooperativity in enhancer/promoter activity during murine erythroid maturation
RNA-seq at E14.5 revealed that hemogen KO in mice resulted in dysregulation of 5629 genes and downregulation of important erythroid maturation genes, similar to results in human CD34+ cells and HUDEP2 erythroid cells (Figure 6A). GO term analysis indicated that genes downregulated after hemogen KO were enriched for erythroid gene processes (supplemental Figure 9A). BRG1 protein measured by immunofluorescence was unaffected by loss of hemogen (Figure 6B). However, BRG1 ChIP-seq for hemogen-KO and control fetal liver cells at E14.5 indicated the loss of almost all (87%) BRG1 peaks after hemogen KO (Figure 6C-D). The loss of BRG1 peaks was especially dramatic at hemogen-binding promoters and enhancers, and most of these had significant decreases in chromatin accessibility, as revealed by ATAC-seq in hemogen-KO and control fetal liver cells (Figure 6E).
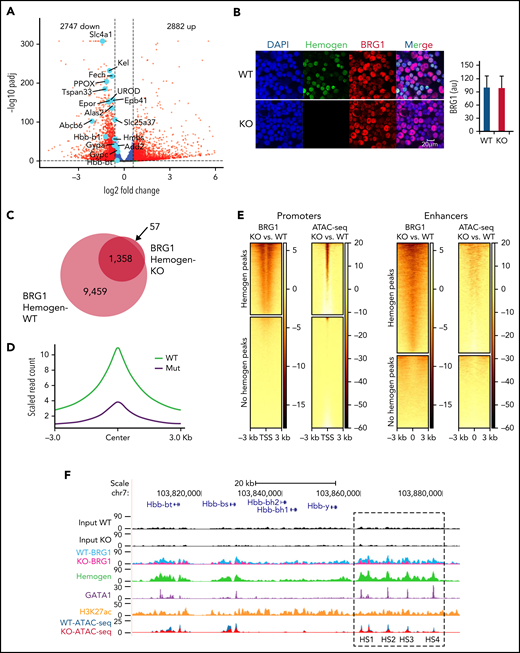
Hemogen regulates BRG1 recruitment and chromatin accessibility at promoters and enhancer for target gene activation. (A) Volcano plot showing differential gene expression in Hemgn−/− E14.5 fetal liver cells compared with WT littermates. Vertical dashed lines represent log2 fold change at −0. 6 and +0. 6. Dashed horizontal line is drawn at adjusted P value <.05. Light blue dots highlight erythroid genes that were significantly downregulated upon hemogen KO (n = 4 biological replicates). (B) Immunofluorescence indicating that loss of hemogen has no obvious effect on BRG1 protein level in E14.5 fetal liver cells (left panels). Quantification of BRG1 fluorescence intensity in 30 cells (right panel). (C) Venn diagram showing global changes in BRG1 occupied peaks upon loss of hemogen in E14.5 fetal liver cells. (D) Normalized peak density plot showing BRG1 signal at hemogen binding peaks in WT or Hemgn−/− (Mut) E14.5 fetal liver cells. (E) Heat map displaying changed BRG1 binding peaks and ATAC-seq signals between hemogen-KO and WT E14.5 fetal liver cells in 2 categories (hemogen-binding or no hemogen-binding promoters and enhancers). Each row represents a 3-kb window centered at TSS or enhancer center. N = 2 biological replicates for WT and KO ATAC-seq. (F) β-Globin locus showing ChIP-seq localization of hemogen, BRG1, GATA1, H3K27ac ChIP-seq signals, and ATAC-seq signals on the promoter and enhancers. au, arbitrary fluorescence units.
Hemogen regulates BRG1 recruitment and chromatin accessibility at promoters and enhancer for target gene activation. (A) Volcano plot showing differential gene expression in Hemgn−/− E14.5 fetal liver cells compared with WT littermates. Vertical dashed lines represent log2 fold change at −0. 6 and +0. 6. Dashed horizontal line is drawn at adjusted P value <.05. Light blue dots highlight erythroid genes that were significantly downregulated upon hemogen KO (n = 4 biological replicates). (B) Immunofluorescence indicating that loss of hemogen has no obvious effect on BRG1 protein level in E14.5 fetal liver cells (left panels). Quantification of BRG1 fluorescence intensity in 30 cells (right panel). (C) Venn diagram showing global changes in BRG1 occupied peaks upon loss of hemogen in E14.5 fetal liver cells. (D) Normalized peak density plot showing BRG1 signal at hemogen binding peaks in WT or Hemgn−/− (Mut) E14.5 fetal liver cells. (E) Heat map displaying changed BRG1 binding peaks and ATAC-seq signals between hemogen-KO and WT E14.5 fetal liver cells in 2 categories (hemogen-binding or no hemogen-binding promoters and enhancers). Each row represents a 3-kb window centered at TSS or enhancer center. N = 2 biological replicates for WT and KO ATAC-seq. (F) β-Globin locus showing ChIP-seq localization of hemogen, BRG1, GATA1, H3K27ac ChIP-seq signals, and ATAC-seq signals on the promoter and enhancers. au, arbitrary fluorescence units.
GO analysis showed that BRG1 peaks that are sensitive to hemogen loss were associated with RNA polymerase II complex binding and TBP-class protein binding, whereas those not sensitive to hemogen loss were associated with transcription factor coregulator activity pathways (supplemental Figure 9B). Globally, BRG1 recruitment was highly dependent on hemogen occupancy. At hemogen positively regulated genes, such as Hbb-bs, BRG1 occupancy and ATAC-seq signals were highly sensitive to hemogen loss (Figure 6F). In contrast to decreased BRG1 occupancy, NuRD components CHD4 and MTA2 exhibited increased binding to HS2 and the Hbb-bs promoter, consistent with antagonism between BRG1 and NuRD (supplemental Figure 9C). Together, these data support the conserved role of hemogen/BRG1 cooperativity in embryonic erythroid differentiation and hemoglobinization in humans and mice.
Discussion
Erythropoiesis is the process by which mature red blood cells develop from erythropoietic stem cells and requires significant body iron for heme synthesis and hemoglobin production. Heme synthesis and hemoglobin production are tightly coordinated, and defective heme synthesis results in severe erythroid disorders.42,43 We found that hemogen positively regulates the transcription of essential genes in biological pathways of heme and hemoglobin production, providing evidence that hemogen is an activator of human erythrocyte maturation. In vivo studies of mouse embryonic erythropoiesis revealed that hemogen is required for erythroblast maturation and globin gene regulation, suggesting that hemogen plays a conserved positive role in mammal erythropoiesis.
Our mechanistic studies in K562 cells indicated that hemogen interacts with GATA1, as well as regulates the occupancy of LDB1 and coactivator BRG1 at gene regulatory elements. Moreover, we suggest that hemogen influences the relative occupancy of coactivators/corepressors on chromatin and maintains the predominance of coactivators in the LDB1 complex context. Hemogen recruited SWI/SNF (BAF170, BRG1, and BAF47) and repelled NuRD (CHD4, MTA2, and HDAC1) in the β-globin locus, serving as a toggle switch between gene activation and gene repression. SWI/SNF influences acetylated histones on chromatin and increases accessibility to generate an open chromatin state for transcription activation.44 In contrast, NuRD complex mediates nucleosome invasion of regulatory DNA and removal of acetylation marks as a repressor of gene expression.44 Thus, NuRD and SWI/SNF act antagonistically and have opposite effects on nucleosome organization.45,46 Although the role of hemogen in this antagonism provides insight into erythroid coactivator/corepressor balance in control of gene expression in the GATA1/LDB1 network, further work is required to solidify the dynamic interrelationships involved.
The interaction between hemogen and SWI/SNF results in widespread H3K27ac enrichment and open chromatin at target promoters and enhancers. The importance of hemogen for enhancer/promoter looping in the β-globin locus was demonstrated by 3C and is consistent with data showing that LDB1 and BRG1 are required for LCR/β-globin looping.4,5,10,47 The recruitment of LDB1 by hemogen may directly affect gene contacts, whereas hemogen recruitment of BRG1 may indirectly affect gene contacts through nucleosome decompaction and maintenance of H3K27ac at enhancers and promoters. Our studies suggest that hemogen/LDB1/BRG1 cooperativity may be key factor for erythroid gene/enhancer looping regulation.
ChIP-seq studies of hemogen and BRG1 in E14.5 fetal liver cells revealed an almost-complete global dependence of BRG1 occupancy on hemogen. Previous studies revealed a crucial role for BRG1 in the development of primitive and definitive erythroid cells.7,48 We uncovered how BRG1 is dependent on hemogen to influence chromatin accessibility at promoters/enhancers for gene regulation. However, BRG1 is dispensable for transcription of the adult α-globin and heme biosynthesis enzyme gene Alas2 in primitive erythropoiesis.48 E14.5 RNA-seq data showed that these 2 genes are downregulated by loss of hemogen. This raises the possibility that hemogen can function with other erythroid transcription factors independent of BRG1. Motif analysis revealed a potential partnership between hemogen and STAT1 and Id2. STAT1 and Id2-deficient mice had impaired erythroid development.39,41 More importantly, the regulation of Id2 in erythroid development is mediated via PU.1 interaction and modulation of PU.1 and GATA-1 activities. It remains unclear whether interplay between hemogen/STAT1 or hemogen/Id2 is involved in hemogen/BRG1 cooperativity in embryonic erythropoiesis.
In vivo studies in mice demonstrate the importance of hemogen for the kinetics of embryonic erythropoiesis and erythroid cell maturation in the fetal liver. However, the cooperativity between hemogen and BRG1 at the embryonic stage may not extend to adult erythropoiesis. Similar to ETO2-KO mice, hemogen-KO mice are born at normal Mendelian ratios with no obvious defects. Therefore, the role of hemogen in recruiting coactivators to target genes may be restricted to embryonic developmental stages, which is when the LDB1 complex is known to influence gene expression.49 Interestingly, although hemogen expression is very low at mature stages in adult mouse bone marrow compared with fetal liver, human progenitors from umbilical cord blood and from adult bone marrow maintain similar levels of hemogen during maturation, suggesting a possible species difference for the role of hemogen in erythropoiesis (supplemental Figure 10).
In summary, our study revealed conserved mechanisms underlying the positive role of hemogen in mammalian embryonic erythropoiesis, including recruitment of SWI/SNF component BRG1 for chromatin accessibility (Figure 7), as well as interaction with the LDB1 complex to antagonize NuRD occupancy and promote chromatin looping. These data provide a broader insight into the transcription factor network interplay in the regulation of embryonic erythroid development and the maturation and hemoglobinization of erythroid cells.
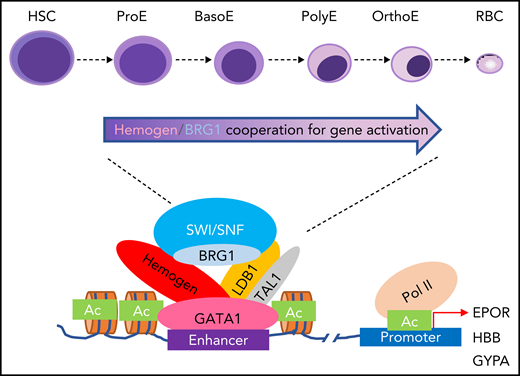
Model depicting hemogen function. The cooperativity of activating complex hemogen/BRG1/LDB1 establish open chromatin for enhancers (depicted) and promoters for key erythroid gene activation during mammal erythropoiesis. BasoE, basophilic erythroblasts; HSC, hematopoietic stem cell; OrthoE, orthochromatophilic erythroblasts; Pol II, RNA polymerase II; PolyE, polychromatic erythroblasts; ProE, proerythroblast; RBC, red blood cell.
Model depicting hemogen function. The cooperativity of activating complex hemogen/BRG1/LDB1 establish open chromatin for enhancers (depicted) and promoters for key erythroid gene activation during mammal erythropoiesis. BasoE, basophilic erythroblasts; HSC, hematopoietic stem cell; OrthoE, orthochromatophilic erythroblasts; Pol II, RNA polymerase II; PolyE, polychromatic erythroblasts; ProE, proerythroblast; RBC, red blood cell.
Acknowledgments
The authors thank Marjorie Brand for comments on the manuscript, Chen-yu Liu and Guoyun Yu for bioinformatics analysis, and Harold Smith and the NIDDK Genome Core for sequencing. This study used the computational resources of the National Institutes of Health Biowulf cluster (http://hpc.nih.gov).
This work was supported by the Intramural Program of the National Institutes of Health NIDDK (grant DK075033) (A.D.).
Authorship
Contribution: X.G. and A.D. designed the experiments and wrote the manuscript; and X.G., Y.Z., and J.K. performed experiments.
Conflict-of-interest disclosure: The authors declare no competing financial interests.
Correspondence: Xiang Guo, Laboratory of Cellular and Developmental Biology, National Institute of Diabetes and Digestive and Kidney Diseases, National Institutes of Health, 50 South Dr, Building 50, Room 3152, Bethesda, MD 20892; e-mail: xiang.guo2@nih.gov; and Ann Dean, Laboratory of Cellular and Developmental Biology, National Institute of Diabetes and Digestive and Kidney Diseases, National Institutes of Health, 50 South Dr, Building 50, Room 3154, Bethesda, MD 20892; e-mail: ann.dean@nih.gov.
The RNA-seq, ChIP-seq, and ATAC-seq data discussed in this article have been deposited in the Gene Expression Omnibus database (accession number GSE184606).
Data sharing requests should be sent to Xiang Guo (xiang.guo2@nih.gov) or Ann Dean (ann.dean@nih.gov).
The online version of this article contains a data supplement.
There is a Blood Commentary on this article in this issue.
The publication costs of this article were defrayed in part by page charge payment. Therefore, and solely to indicate this fact, this article is hereby marked “advertisement” in accordance with 18 USC section 1734.

This feature is available to Subscribers Only
Sign In or Create an Account Close Modal