

Key Points
Syndecan-2 expression enriches for LT-HSCs.
Syndecan-2 regulates HSC self-renewal via control of stem cell quiescence.

Abstract
The discovery of novel hematopoietic stem cell (HSC) surface markers can enhance understanding of HSC identity and function. We have discovered a population of primitive bone marrow (BM) HSCs distinguished by their expression of the heparan sulfate proteoglycan Syndecan-2, which serves as both a marker and a regulator of HSC function. Syndecan-2 expression was increased 10-fold in CD150+CD48–CD34–c-Kit+Sca-1+Lineage– cells (long-term HSCs [LT-HSCs]) compared with differentiated hematopoietic cells. Isolation of BM cells based solely on syndecan-2 surface expression produced a 24-fold enrichment for LT-HSCs and sixfold enrichment for α-catulin+c-kit+ HSCs, and yielded HSCs with superior in vivo repopulating capacity compared with CD150+ cells. Competitive repopulation assays revealed the HSC frequency to be 17-fold higher in syndecan-2+CD34–KSL cells compared with syndecan-2–CD34–KSL cells and indistinguishable from CD150+CD34–KSL cells. Syndecan-2 expression also identified nearly all repopulating HSCs within the CD150+CD34–KSL population. Mechanistically, syndecan-2 regulates HSC repopulating capacity through control of expression of Cdkn1c (p57) and HSC quiescence. Loss of syndecan-2 expression caused increased HSC cell cycle entry, downregulation of Cdkn1c, and loss of HSC long-term repopulating capacity. Syndecan-2 is a novel marker of HSCs that regulates HSC repopulating capacity via control of HSC quiescence.
Introduction
Hematopoietic stem cells (HSCs) comprise <0.01% of the total nucleated cells in the adult bone marrow (BM).1 Long-term HSCs (LT-HSCs) possess self-renewal capacity and unrestricted hematopoietic differentiation potential.2 Characterization of the immunophenotype of HSCs is important, both to understand the fundamental biology of HSCs and to facilitate the development of HSC-based regenerative therapies.
Murine HSCs display unique surface protein expression patterns, which enable the purification of HSCs using antibody staining and fluorescence-activated cell sorting (FACS). Seminal studies showed that Sca-13 and c-Kit4 expression enriched for hematopoietic stem and progenitor cells (HSPCs), whereas single c-Kit+Sca-1+Lineage– (KSL) CD34low/– cells were capable of long-term multilineage repopulation.5 Additional markers, including Flk2/Flt3,6,7 CD201,8,9 and endothelial cell–selective adhesion molecule 1 (Esam1),10 have been used to further enrich for murine HSCs. Notably, the expression pattern of the signaling lymphocyte activation molecule (SLAM) proteins (CD150, CD48, and CD244) can purify distinct subpopulations of LT-HSCs, short-term HSCs (ST-HSCs), and hematopoietic progenitor cells.11-16
HSC transcriptome studies have unveiled a molecular portrait of LT-HSCs.11,17 Expression of Sdc2, which encodes syndecan-2, a heparan sulfate proteoglycan (HSPG), was shown to be increased in LT-HSCs compared with multipotent progenitor cells (MPPs). However, the function of Sdc2 in HSCs has not been defined. Syndecan-2 is a member of the syndecan family of HSPGs and consists of a core protein decorated by heparan sulfate chains.18,19 Through their interactions with other proteins, syndecans regulate cell proliferation, survival, and adhesion/migration.18 The role of syndecans in stem cell regulation has been primarily confined to muscle stem cells20-23 and neural stem cells.24,25 However, inhibition of heparan sulfate synthesis by Mx1+ stromal cells or pharmacologic inhibition of heparan sulfate promoted HSPC egress from the BM into the peripheral blood (PB),26 whereas administration of heparan sulfate mimetics promoted LT-HSC mobilization.27 However, the nature of HSPG expression on HSCs is poorly understood, and the potential cell-autonomous functions of HSPGs on HSCs are unknown.
Here, we show that syndecan-2 expression enriches for HSCs with enhanced self-renewal capacity and syndecan-2 regulates HSC-repopulating capacity via control of HSC quiescence.
Methods
Detailed information on methods is presented in the supplemental Methods (available on the Blood Web site).
Mice
All mouse procedures were performed by using 8- to 12-week-old mixed gender mice in accordance with protocols approved by UCLA and Cedars Sinai Medical Center (Principal Investigator, J.P.C.).
Flow cytometry
BM cells were isolated from murine long bones, lineage depleted, and stained by using antibodies and/or 7-AAD/annexin-V for cell death analysis. Stained cells were analyzed by using a BD FACS Canto II or sorted by using a BD FACS Aria.
Competitive transplants
HSCs were resuspended in 10% fetal bovine serum/phosphate-buffered saline supplemented with 2 × 10⁵ competitor BM cells. Cells were transplanted into lethally irradiated (900 cGy) mice via tail vein injection. PB was analyzed every 4 weeks for donor chimerism by using flow cytometry. For secondary transplants, BM was harvested from primary transplanted mice 16 weeks posttransplant, and 3 × 10⁶ BM cells were transplanted along with 2 × 10⁵ competitor BM cells. PB was analyzed every 4 weeks for donor chimerism.
Homing assay
BM HSPCs were resuspended in 10% fetal bovine serum/phosphate-buffered saline and transplanted intravenously into lethally irradiated mice. At 24 hours, BM cells were harvested and analyzed for donor cells by using flow cytometry.
HSC cultures, lentiviral transduction, and colony assays
BM HSCs were sorted by using FACS, plated in Iscove Modified Dulbecco Medium (IMDM) supplemented with thrombopoietin, stem cell factor and flt-3 ligand (TSF media), and cultured in a humidified, 5% carbon dioxide incubator. Cultured cells were analyzed after 3 or 7 days of culture. Sorted 34–KSL cells were prestimulated for 48 hours in StemSpan media supplemented with mouse stem cell factor, interleukin-3, and interleukin-6. Cells were spin-oculated with short hairpin Control (shCtrl), shSdc2, shCdkn1c, murine stem cell virus (MSCV) control, or MSCV-Sdc2 viral supernatant and incubated for 48 hours. For colony-forming cell assays, BM cells were plated in MethoCult and incubated for 10 days before colony counts.
Gene expression and RNA sequence analysis
RNA was isolated by using the RNeasy Micro Kit. For quantitative reverse transcription polymerase chain reaction analysis, RNA was reverse transcribed into complementary DNA by using the High-Capacity cDNA Reverse Transcription Kit, and gene expression was analyzed by using an Applied Biosystems QuantStudio 6 PCR Machine. For RNA sequencing, a HiSeq3000 Sequencing System was used, and Ingenuity Pathway Analysis was performed. RNA sequencing data are available at GEO under accession number GSE151733.
Cell cycle analysis
BM cells were stained for surface markers using antibodies and then fixed, permeabilized, and stained for Ki-67 and 7AAD for flow cytometric analysis.
Confocal microscopy
Cells were plated on fibronectin-coated slides, fixed, permeabilized, and stained by using antibodies to p57, p16, p21, and p27. Imaging was performed by using the Leica Stellaris system and analyzed with ImageJ.
Results
Syndecan-2 is differentially expressed on LT-HSCs
We isolated murine LT-HSCs and hematopoietic progenitor populations to assess for Sdc gene expression in each population (Figure 1A).11,12,15,17 Using quantitative reverse transcription polymerase chain reaction, Sdc gene expression was quantified in adult BM LT-HSCs (CD150+CD48–CD34–c-Kit+Sca-1+Lineage– cells) (supplemental Table 1), CD34–c-Kit+Sca-1+Lineage– (34–KSL) HSCs, ST-HSCs (CD150+/−CD48–34+KSL cells), and MPPs (CD150–CD48+34+KSL cells). Sdc2 expression was significantly increased in LT-HSCs compared with 34–KSL HSCs, ST-HSCs, and MPPs, whereas expression of Sdc1, Sdc3, and Sdc4 did not differ between LT-HSCs and these other populations (Figure 1B). Surface expression of syndecan-1, syndecan-3, and syndecan-4 protein was low on MPPs, ST-HSCs, and LT-HSCs (supplemental Figure 1A-C). In contrast, the mean fluorescence intensity of syndecan-2 was increased on LT-HSCs and 34–KSL HSCs compared with MPPs (Figure 1C-D), and the percentages of LT-HSCs expressing syndecan-2 were increased compared with ST-HSCs and MPPs (Figure 1E). Consistent with this finding, syndecan-2+ BM cells were enriched for KSL, 34–KSL, and SLAM LT-HSCs12,15,28 compared with syndecan-2– BM cells (Figure 1F-G). Syndecan-2+Lin– cells also exhibited a 6-fold enrichment for α-catulin+c-kit+ HSCs29 compared with syndecan-2-Lin– cells (Figure 1H-I). Multiparameter Barnes-Hut Stochastic Neighbor Embedding analysis showed that syndecan-2+ BM cells overlay with regions of increased expression of c-Kit, Sca-1, and CD150 and decreased CD48 and CD34 (supplemental Figure 1D). Syndecan-2 expression is also increased on human cord blood CD34+ HSPCs compared with cord blood mononuclear cells (supplemental Figure 1E-F). Syndecan-2 expression is also increased on human BM CD34+CD38–CD45RA–CD90+ HSCs compared with BM mononuclear cells (supplemental Figure 1G).
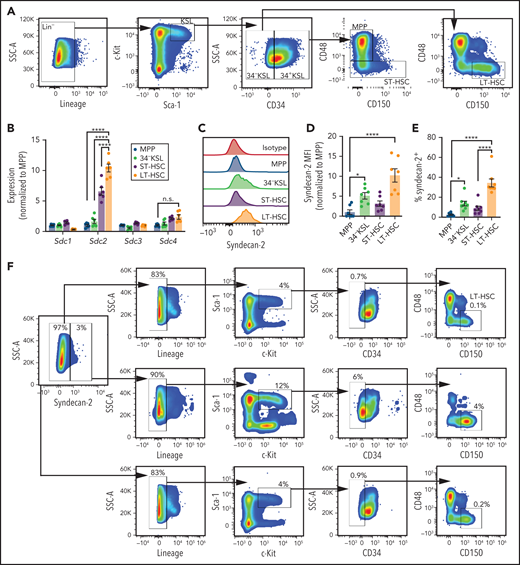

Syndecan-2 is differentially expressed by LT-HSCs. (A) Gating strategy used to isolate adult BM MPPs, ST-HSCs, 34–KSL HSCs, and LT-HSCs. (B) qRT-PCR analysis of Sdc1, Sdc2, Sdc3, and Sdc4 in BM HSPCs (n = 7 mice, pooled per replicate per group). (C) Representative histograms of syndecan-2 expression on HSPCs. Quantification of syndecan-2 mean fluorescence intensity (MFI) (D) and percentages of syndecan-2+ cells (n = 7 mice per group) (E). Sequential gating of lineage-depleted mouse BM cells based on syndecan-2 expression (F) and quantification of the percent KSL of Lin–, 34–KSL of KSL, and LT-HSCs of 34–KSL (n = 7 mice per group) (G). (H) Representative analysis of α-catulinGFP+c-kit+ cells within lineage-depleted BM from adult α-catulinGFP mice based on Syndecan-2 expression. (I) Quantification of percentage α-catulinGFP+c-kit+ LT-HSCs within each population (n = 6 mice per group). (J) Quantification of colony-forming cells from BM syndecan-2–Lin– and syndecan-2+Lin– cells and CD150+ Lin– cells (n = 5 mice, pooled, n = 4 replicates per group). (K) Schematic representation of competitive repopulation assay of CD45.1+ BM syndecan-2–Lin– cells, syndecan-2+Lin– cells, or CD150+ Lin– cells transplanted into CD45.2+ mice. (L) Percentages of total donor CD45.1+ cells in the BM at 16 weeks after competitive transplantation of BM syndecan-2–Lin– cells, syndecan-2+Lin– cells, and CD150+Lin– cells from CD45.1+ mice into CD45.2+ recipients (n = 5 SJL mice, pooled for donor cells, n = 3-5 recipient mice per group). Error bars = standard error of the mean; statistics denote 1- or 2-way analysis of variance followed by Holm-Sidak’s corrected unpaired Student t test. *P < .05, *** P < .001, **** P < .0001, for competitive transplant. SSC-A, side scatter area.
Syndecan-2 is differentially expressed by LT-HSCs. (A) Gating strategy used to isolate adult BM MPPs, ST-HSCs, 34–KSL HSCs, and LT-HSCs. (B) qRT-PCR analysis of Sdc1, Sdc2, Sdc3, and Sdc4 in BM HSPCs (n = 7 mice, pooled per replicate per group). (C) Representative histograms of syndecan-2 expression on HSPCs. Quantification of syndecan-2 mean fluorescence intensity (MFI) (D) and percentages of syndecan-2+ cells (n = 7 mice per group) (E). Sequential gating of lineage-depleted mouse BM cells based on syndecan-2 expression (F) and quantification of the percent KSL of Lin–, 34–KSL of KSL, and LT-HSCs of 34–KSL (n = 7 mice per group) (G). (H) Representative analysis of α-catulinGFP+c-kit+ cells within lineage-depleted BM from adult α-catulinGFP mice based on Syndecan-2 expression. (I) Quantification of percentage α-catulinGFP+c-kit+ LT-HSCs within each population (n = 6 mice per group). (J) Quantification of colony-forming cells from BM syndecan-2–Lin– and syndecan-2+Lin– cells and CD150+ Lin– cells (n = 5 mice, pooled, n = 4 replicates per group). (K) Schematic representation of competitive repopulation assay of CD45.1+ BM syndecan-2–Lin– cells, syndecan-2+Lin– cells, or CD150+ Lin– cells transplanted into CD45.2+ mice. (L) Percentages of total donor CD45.1+ cells in the BM at 16 weeks after competitive transplantation of BM syndecan-2–Lin– cells, syndecan-2+Lin– cells, and CD150+Lin– cells from CD45.1+ mice into CD45.2+ recipients (n = 5 SJL mice, pooled for donor cells, n = 3-5 recipient mice per group). Error bars = standard error of the mean; statistics denote 1- or 2-way analysis of variance followed by Holm-Sidak’s corrected unpaired Student t test. *P < .05, *** P < .001, **** P < .0001, for competitive transplant. SSC-A, side scatter area.
We next evaluated whether syndecan-2 as a sole marker could enrich for functional HSCs and HSPCs. Syndecan-2+Lin– cells produced significantly more colony-forming cells compared with CD150+Lin– cells (Figure 1J).12,15 Furthermore, mice transplanted with syndecan-2+Lin– cells displayed increased total donor cell chimerism and increased donor B-cell and myeloid cell chimerism in the BM at 16 weeks posttransplant compared with mice transplanted with CD150+Lin– BM cells or syndecan-2–Lin– BM cells (Figure 1K-L). Therefore, syndecan-2 surface expression alone enriches for HSCs with multilineage repopulating capacity.
Because terminally differentiated hematopoietic cells and HPCs comprise the majority of adult BM cells,1,30 we analyzed syndecan-2 expression on Lin–c-Kit+Sca-1–CD34–CD16/32– megakaryocyte-erythrocyte progenitors, Lin–c-Kit+Sca-1–CD34–CD16/32+ common myeloid progenitors, Lin–c-Kit+Sca-1–CD34+CD16/32+ granulocyte-macrophage progenitors, and Lin–Flt3+Il7rα+c-KitlowSca-1low common lymphoid progenitors. Syndecan-2 expression was minimally detected on common myeloid progenitor, megakaryocyte-erythrocyte progenitor, granulocyte-macrophage progenitor, and common lymphoid progenitor cells and terminally differentiated hematopoietic cells (supplemental Figure 1H-I). Syndecan-2+ BM cells contained small percentages of hematopoietic progenitor cells and terminally differentiated cells compared with syndecan-2– BM cells (supplemental Figure 1J-L).
Syndecan-2 expression enriches for HSCs with increased self-renewal capacity
Because syndecan-2 expression enriched for phenotypic LT-HSCs, we evaluated whether syndecan-2+ expression marked HSCs with increased self-renewal capacity. We sorted donor syndecan-2+34–KSL cells and syndecan-2–34–KSL cells (hereafter referred to as Sdc2+ HSCs and Sdc2– HSCs, respectively) from the BM of B6.SJL (CD45.1+) mice (Figure 2A) and transplanted 5 × 10² donor cells competitively with 2 × 10⁵ BM cells (CD45.2+) into lethally irradiated C57BL/6 (CD45.2+) mice (Figure 2B). Through 16 weeks posttransplant, mice transplanted with Sdc2+ HSCs displayed increased total and multilineage donor cell PB chimerism compared with mice transplanted with Sdc2– or 34–KSL HSCs (Figure 2C-D). We detected increased multilineage donor chimerism in the BM at 16 weeks without lineage skewing (supplemental Figure 2A-B), and increased donor KSL cells and donor CD150+CD48–KSL cells in mice transplanted with Sdc2+ HSCs compared with recipients of Sdc2– or 34–KSL HSCs (Figure 2E-F). We detected no differences in homing of Sdc2+Lin– cells and Sdc2–Lin– cells to the BM at 24 hours posttransplant (supplemental Figure 2C). We also analyzed whether isolation of 34–KSL HSCs based on high (Sdc2High) or medium (Sdc2Med) Sdc2 expression could distinguish HSCs with distinct repopulating capacities (supplemental Figure 2D). Mice transplanted with Sdc2High HSCs exhibited significantly higher total and multilineage donor chimerism after competitive transplantation compared with Sdc2Med or Sdc2– HSCs (supplemental Figure 2E).
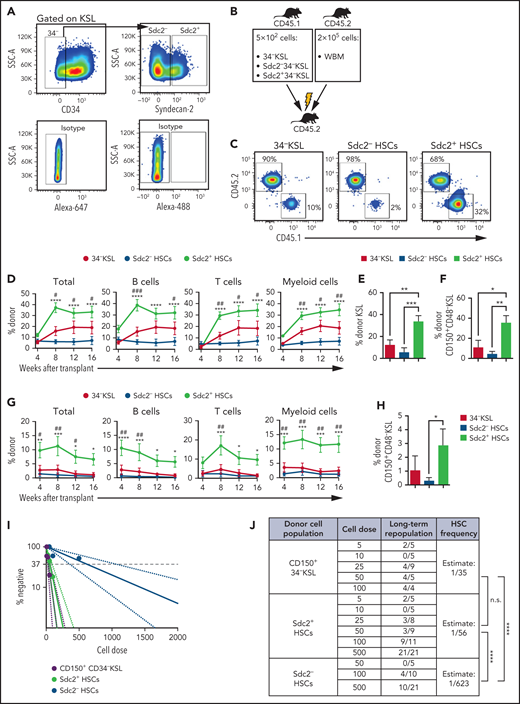
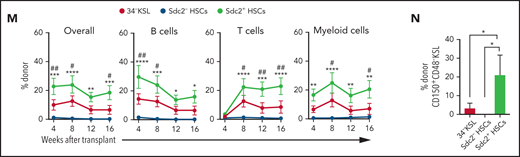
Sdc2+ HSCs exhibit increased self-renewal capacity. (A) Representative gating strategy to isolate 34–KSL cells (HSCs), Sdc2– HSCs, or Sdc2+ HSCs. (B) Experimental design for primary competitive repopulation assay of 500 Scd2+ HSCs, Sdc2– HSCs, and 34-KSL HSCs from CD45.1+ mice into CD45.2+ recipients. (C) Representative flow cytometric analysis of donor CD45.1+ engraftment in the PB of recipient CD45.2+ mice at 16 weeks posttransplant. (D) Percentages of total donor CD45.1+ cells, B cells, T cells, and myeloid cells in the PB over time in recipient CD45.2+ mice in the groups shown (n = 7 mice pooled for donor cell isolation; n = 10-17 recipient mice per group). (E-F) Percentages of donor CD45.1+ KSL cells and CD45.1+CD150+CD48–KSL cells at 16 weeks in the BM of recipient CD45.2+ mice (n = 10-17 recipient mice per group). (G) Percentages of total donor CD45.1+ cells, B cells, T cells, and myeloid cells in the PB over time after secondary competitive transplant in the treatment groups shown (n = 10-17 recipient mice per group). (H) Percentages of donor CD45.1+ CD150+CD48–KSL cells in the BM of recipient mice at 16 weeks postsecondary transplant (n = 10-17 recipient mice per group). (I) Graph of limiting dilution analysis of engraftment of Sdc2+ HSCs, Sdc2– HSCs, or CD150+ HSCs (CD45.1+) at 16 weeks after competitive transplant into lethally irradiated C57BL/6 (CD45.2+) mice. CD45.1+ donor engraftment ≥0.1% was considered positive for engraftment (n = 10 mice pooled for donor cell isolation; n = 4-21 recipient mice per dose). (J) HSC frequency estimates in CD150+ HSCs, Sdc2+ HSCs, and Sdc2– HSCs are displayed based on Poisson statistical analysis of engraftment data shown. (K) Representative gating strategy used to isolate CD150+34–KSL Sdc2+ cells and CD150+34–KSL Sdc2– cells for competitive transplantation of 300 isolated cells. (L) Percentages of total donor CD45.1+ cells, B cells, T cells, and myeloid cells in the PB over time after primary competitive transplant (n = 10 mice pooled for donor cell isolation; n = 8-10 recipient mice per condition). Error bars = standard error of the mean; statistics denote one- or two-way analysis of variance followed by Holm-Šidák’s corrected unpaired Student t test. *P < .05, **P < .01, ***P < .001, ****P < .0001 for comparison of Sdc2+ HSCs vs Sdc2– HSCs in panels D and G or comparison of CD150+34–KSL Sdc2+ cells vs CD150+34–KSL Sdc2– cells in panel L. #P < .05, ##P < .01, ###P < .001 for comparison of Sdc2+ HSCs and 34–KSL cells (HSCs) in panels D and G. IgG, immunoglobulin G; n.s., not significant; SSC-A, side scatter area.
Sdc2+ HSCs exhibit increased self-renewal capacity. (A) Representative gating strategy to isolate 34–KSL cells (HSCs), Sdc2– HSCs, or Sdc2+ HSCs. (B) Experimental design for primary competitive repopulation assay of 500 Scd2+ HSCs, Sdc2– HSCs, and 34-KSL HSCs from CD45.1+ mice into CD45.2+ recipients. (C) Representative flow cytometric analysis of donor CD45.1+ engraftment in the PB of recipient CD45.2+ mice at 16 weeks posttransplant. (D) Percentages of total donor CD45.1+ cells, B cells, T cells, and myeloid cells in the PB over time in recipient CD45.2+ mice in the groups shown (n = 7 mice pooled for donor cell isolation; n = 10-17 recipient mice per group). (E-F) Percentages of donor CD45.1+ KSL cells and CD45.1+CD150+CD48–KSL cells at 16 weeks in the BM of recipient CD45.2+ mice (n = 10-17 recipient mice per group). (G) Percentages of total donor CD45.1+ cells, B cells, T cells, and myeloid cells in the PB over time after secondary competitive transplant in the treatment groups shown (n = 10-17 recipient mice per group). (H) Percentages of donor CD45.1+ CD150+CD48–KSL cells in the BM of recipient mice at 16 weeks postsecondary transplant (n = 10-17 recipient mice per group). (I) Graph of limiting dilution analysis of engraftment of Sdc2+ HSCs, Sdc2– HSCs, or CD150+ HSCs (CD45.1+) at 16 weeks after competitive transplant into lethally irradiated C57BL/6 (CD45.2+) mice. CD45.1+ donor engraftment ≥0.1% was considered positive for engraftment (n = 10 mice pooled for donor cell isolation; n = 4-21 recipient mice per dose). (J) HSC frequency estimates in CD150+ HSCs, Sdc2+ HSCs, and Sdc2– HSCs are displayed based on Poisson statistical analysis of engraftment data shown. (K) Representative gating strategy used to isolate CD150+34–KSL Sdc2+ cells and CD150+34–KSL Sdc2– cells for competitive transplantation of 300 isolated cells. (L) Percentages of total donor CD45.1+ cells, B cells, T cells, and myeloid cells in the PB over time after primary competitive transplant (n = 10 mice pooled for donor cell isolation; n = 8-10 recipient mice per condition). Error bars = standard error of the mean; statistics denote one- or two-way analysis of variance followed by Holm-Šidák’s corrected unpaired Student t test. *P < .05, **P < .01, ***P < .001, ****P < .0001 for comparison of Sdc2+ HSCs vs Sdc2– HSCs in panels D and G or comparison of CD150+34–KSL Sdc2+ cells vs CD150+34–KSL Sdc2– cells in panel L. #P < .05, ##P < .01, ###P < .001 for comparison of Sdc2+ HSCs and 34–KSL cells (HSCs) in panels D and G. IgG, immunoglobulin G; n.s., not significant; SSC-A, side scatter area.
Secondary competitive repopulation assays to assess LT-HSC repopulating capacity revealed increased donor hematopoietic cell engraftment in the PB (Figure 2G) and BM (supplemental Figure 2F) of recipients of Sdc2+ HSCs, without lineage skewing, compared with mice transplanted with Sdc2– HSCs (supplemental Figure 2F-G). Secondary recipient mice also displayed increased donor BM CD45.1+CD150+CD48–KSL HSCs compared with recipients of Sdc2– HSCs (Figure 2H).
Surface expression of CD150 and absence of CD48 and CD41 expression select for HSCs with the highest demonstrated LT-HSC enrichment.12,15 Using a limiting dilution assay and Poisson statistical analyses, we compared the HSC frequency within Sdc2+34–KSL, Sdc2–34–KSL, and CD150+34–KSL HSCs based on donor hematopoietic engraftment in recipient mice at 16 weeks after transplantation of each population.31 Increased HSC frequency was detected in both Sdc2+34–KSL cells and CD150+34–KSL cells compared with Sdc2–34–KSL cells, and there was no significant difference in the HSC frequency between Sdc2+34–KSL cells and CD150+34–KSL cells (Figure 2I-J). Both Sdc2+34–KSL cells and CD150+34–KSL cells contained >1 log increased HSC frequency compared with Sdc2– HSCs (Figure 2J).
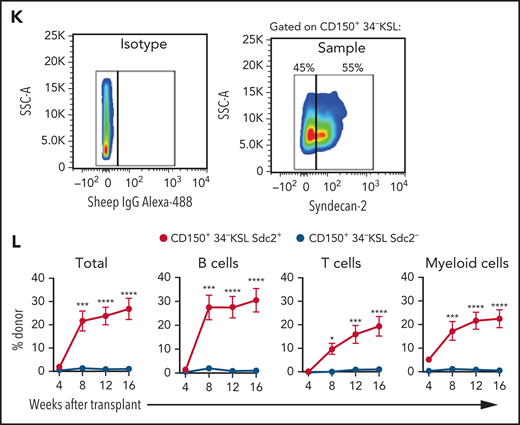
We next evaluated whether syndecan-2 expression could resolve heterogeneity within CD150+34–KSL HSCs.32 We sorted donor BM Sdc2+CD150+34–KSL cells and Sdc2–CD150+34–KSL cells from B6.SJL mice (Figure 2K) and transplanted 3 × 10² donor cells, along with 2 × 10⁵ BM competitor cells, into lethally irradiated C57BL/6 mice. Mice transplanted with Sdc2+CD150+34–KSL HSCs exhibited a 15-fold increased multilineage hematopoietic repopulation compared with mice transplanted with Sdc2–CD150+34–KSL HSCs (Figure 2L), suggesting that syndecan-2 expression resolves heterogeneity in a self-renewal capacity within CD150+34–KSL HSCs.
Syndecan-2 expression delineates HSCs with enhanced quiescence
Flow cytometric analysis revealed that Sdc2+ HSCs contain increased percentages of CD150+, CD48–, CD150+CD48–, α-catulin+, and Flt3– cells compared with Sdc2– HSCs or parent 34–KSL HSCs (Figure 3A-C). In addition, a subset of Lin– α-catulin+ and 34–KSL Flt-3– HSCs express syndecan-2, suggesting partial overlap between Sdc2+ HSCs and HSCs defined by other markers (supplemental Figure 2H). No differences were observed in percentages of apoptotic Sdc2+ and Sdc2– HSCs at baseline (supplemental Figure 2I-J). In contrast, significantly increased percentages of Sdc2+ HSCs were detected in G0 and decreased percentages in G1 at baseline compared with Sdc2– HSCs (Figure 3D).
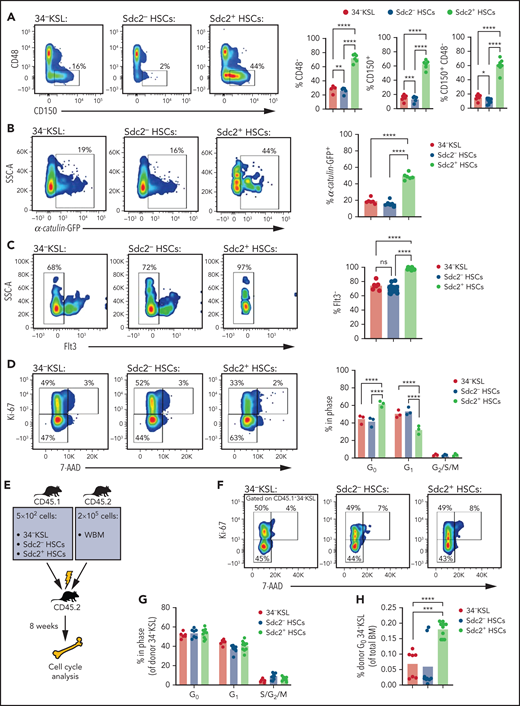
Sdc2+ HSCs display increased quiescence and proliferative capacity. (A) At left, representative flow cytometric analysis of CD150+CD48– cells within BM 34–KSL cells (HSCs), Sdc2– HSCs, and Sdc2+ HSCs; at right, percentages of CD48–, CD150+, and CD150+CD48– cells in each population are shown (n = 8 mice per group). (B) At left, α-catulin GFP expression in 34–KSL cells (HSCs), Sdc2– HSCs, and Sdc2+ HSCs; at right, percentages of ɑ-catulin+ cells in each population (n = 6 mice per group). (C) At left, Flt3 expression in 34–KSL cells (HSCs), Sdc2– HSCs, and Sdc2+ HSCs; at right, percentages of Flt3– cells in each population (n = 8 mice per group). (D) At left, representative flow cytometric analysis showing percentages of 34–KSL cells (HSCs), Sdc2– HSCs, and Sdc2+ HSCs in G0, G1, and G2/S/M phases; at right, percentages of cells in G0, G1, and G2/S/M phases (n = 3 mice per group). (E) Experimental design for primary competitive repopulation assay of Sdc2+ HSCs, Sdc2– HSCs, and HSCs from CD45.1+ mice into CD45.2+ recipients for cell cycle analysis. (F) Representative flow cytometric analysis showing percentages of 34–KSL cells (HSCs), Sdc2– HSCs, and Sdc2+ HSCs in G0, G1, and G2/S/M phases at 8 weeks posttransplant. (G) Quantification of the percentage of donor cells within each cell cycle phase (n = 7-10 mice per group). (H) Quantification of the percent donor 34–KSL HSCs in G0 relative to BM cells (n = 7-10 mice per group). Error bars = standard error of the mean; statistics denote Holm-Šidák’s post hoc unpaired Student t test following one-way ANOVA; *P < .05, **P < .01, ***P < .001, ****P < .0001. ns, not significant; SSC-A, side scatter area; WBM, whole BM.
Sdc2+ HSCs display increased quiescence and proliferative capacity. (A) At left, representative flow cytometric analysis of CD150+CD48– cells within BM 34–KSL cells (HSCs), Sdc2– HSCs, and Sdc2+ HSCs; at right, percentages of CD48–, CD150+, and CD150+CD48– cells in each population are shown (n = 8 mice per group). (B) At left, α-catulin GFP expression in 34–KSL cells (HSCs), Sdc2– HSCs, and Sdc2+ HSCs; at right, percentages of ɑ-catulin+ cells in each population (n = 6 mice per group). (C) At left, Flt3 expression in 34–KSL cells (HSCs), Sdc2– HSCs, and Sdc2+ HSCs; at right, percentages of Flt3– cells in each population (n = 8 mice per group). (D) At left, representative flow cytometric analysis showing percentages of 34–KSL cells (HSCs), Sdc2– HSCs, and Sdc2+ HSCs in G0, G1, and G2/S/M phases; at right, percentages of cells in G0, G1, and G2/S/M phases (n = 3 mice per group). (E) Experimental design for primary competitive repopulation assay of Sdc2+ HSCs, Sdc2– HSCs, and HSCs from CD45.1+ mice into CD45.2+ recipients for cell cycle analysis. (F) Representative flow cytometric analysis showing percentages of 34–KSL cells (HSCs), Sdc2– HSCs, and Sdc2+ HSCs in G0, G1, and G2/S/M phases at 8 weeks posttransplant. (G) Quantification of the percentage of donor cells within each cell cycle phase (n = 7-10 mice per group). (H) Quantification of the percent donor 34–KSL HSCs in G0 relative to BM cells (n = 7-10 mice per group). Error bars = standard error of the mean; statistics denote Holm-Šidák’s post hoc unpaired Student t test following one-way ANOVA; *P < .05, **P < .01, ***P < .001, ****P < .0001. ns, not significant; SSC-A, side scatter area; WBM, whole BM.
We next examined whether Sdc2+ HSCs display an alteration in cell cycle capacity after competitive transplant (Figure 3E). No difference was detected in the cell cycle status of BM donor CD34–KSL cells in mice at 8 weeks after transplantation with 34–KSL HSCs, Sdc2+ HSCs, or Sdc2– HSCs (Figure 3F-G). However, as a percentage of total BM cells, mice transplanted with Sdc2+ HSCs displayed increased percentages of donor 34–KSL cells in G0 at 8 weeks posttransplant compared with mice transplanted with Sdc2– HSCs or parent 34–KSL cells (Figure 3H).
Although quiescent HSCs are protected from exhaustion,33 HSCs must maintain the ability to enter the cell cycle to support hematopoietic demands. We isolated 34–KSL HSCs, Sdc2– HSCs, and Sdc2+ HSCs and plated these populations in complete Iscove modified Dulbecco medium supplemented with thrombopoietin, stem cell factor, and Flt3 ligand (TSF media) to promote cell cycling (Figure 4A). Total cell expansion was observed in all populations after 7 days, but Sdc2+ HSCs produced significantly more 34–KSL HSCs in culture compared with Sdc2– HSCs, which were nearly depleted of phenotypic HSCs (Figure 4B-E).

Sdc2+ HSCs generate HSCs in culture with increased self-renewal ability. (A) Experimental design for ex vivo culture of 34–KSL HSCs, Sdc2– HSCs, or Sdc2+ HSCs in TSF media (n = 4-5 replicates per group). (B) Mean numbers of total cells after 7-day culture (n = 4-5 replicates per group). (C) Representative flow cytometric analysis of KSL cells and 34–KSL cells at day 7 in each group (n = 4-5 replicates per group). Percentages (D) and numbers (E) of 34–KSL cells in each group at day 7 of culture (n = 4-5 replicates per group). Percentages of Syndecan-2+ cells of 34–KSL in each condition at day 3 (F) or day 7 (G) after culture (n = 4-5 replicates per group). Number of syndecan-2– (H) and syndecan-2+ (I) cells of 34–KSL in each condition at day 7 after culture (n = 4-5 replicates per group). (J) Percentages of syndecan-2+ cells of donor-derived 34–KSL cells at 8 weeks after transplantation of 500 Sdc2+ or Sdc2– HSCs (n = 4-5 replicates per group). (K) At left, representative flow cytometric analysis showing percentages of 34–KSL cells (HSCs) derived from Sdc2– HSCs or Sdc2+ HSCs in G0, G1, and G2/S/M phases at day 7; at right, percentages of cells in G0, G1, and G2/S/M phases (n = 3 replicates per group). (L) Percentages of 34–KSL cells derived from Sdc2– HSCs or Sdc2+ HSCs in G0 relative to total cell output (n = 3 replicates per group). (M) Percentages of total donor CD45.1+ cells, B cells, T cells, and myeloid cells in the PB of recipient CD45.2+ mice over time after transplantation of day 7 progeny of 34–KSL HSCs, Sdc2– HSCs, or Sdc2+ HSCs cultured with TSF media (n = 5-6 recipients per group). (N) Percentages of donor CD45.1+ CD150+CD48–KSL cells in the BM of recipient mice at 16 weeks posttransplant. Error bars = standard error of the mean; statistics denote Holm-Šidák’s post hoc unpaired Student t test after 1- or 2-way analysis of variance. *P < .05, **P < .01, ***P < .001, ****P < .0001 for Sdc2+ HSCs vs Sdc2– HSCs. #P < .01, ##P < .01, ###P < .001 for comparison between Sdc2+ HSCs and 34–KSL HSCs. Scf, stem cell factor; SSC-A, side scatter area; TPO, thrombopoietin.
Sdc2+ HSCs generate HSCs in culture with increased self-renewal ability. (A) Experimental design for ex vivo culture of 34–KSL HSCs, Sdc2– HSCs, or Sdc2+ HSCs in TSF media (n = 4-5 replicates per group). (B) Mean numbers of total cells after 7-day culture (n = 4-5 replicates per group). (C) Representative flow cytometric analysis of KSL cells and 34–KSL cells at day 7 in each group (n = 4-5 replicates per group). Percentages (D) and numbers (E) of 34–KSL cells in each group at day 7 of culture (n = 4-5 replicates per group). Percentages of Syndecan-2+ cells of 34–KSL in each condition at day 3 (F) or day 7 (G) after culture (n = 4-5 replicates per group). Number of syndecan-2– (H) and syndecan-2+ (I) cells of 34–KSL in each condition at day 7 after culture (n = 4-5 replicates per group). (J) Percentages of syndecan-2+ cells of donor-derived 34–KSL cells at 8 weeks after transplantation of 500 Sdc2+ or Sdc2– HSCs (n = 4-5 replicates per group). (K) At left, representative flow cytometric analysis showing percentages of 34–KSL cells (HSCs) derived from Sdc2– HSCs or Sdc2+ HSCs in G0, G1, and G2/S/M phases at day 7; at right, percentages of cells in G0, G1, and G2/S/M phases (n = 3 replicates per group). (L) Percentages of 34–KSL cells derived from Sdc2– HSCs or Sdc2+ HSCs in G0 relative to total cell output (n = 3 replicates per group). (M) Percentages of total donor CD45.1+ cells, B cells, T cells, and myeloid cells in the PB of recipient CD45.2+ mice over time after transplantation of day 7 progeny of 34–KSL HSCs, Sdc2– HSCs, or Sdc2+ HSCs cultured with TSF media (n = 5-6 recipients per group). (N) Percentages of donor CD45.1+ CD150+CD48–KSL cells in the BM of recipient mice at 16 weeks posttransplant. Error bars = standard error of the mean; statistics denote Holm-Šidák’s post hoc unpaired Student t test after 1- or 2-way analysis of variance. *P < .05, **P < .01, ***P < .001, ****P < .0001 for Sdc2+ HSCs vs Sdc2– HSCs. #P < .01, ##P < .01, ###P < .001 for comparison between Sdc2+ HSCs and 34–KSL HSCs. Scf, stem cell factor; SSC-A, side scatter area; TPO, thrombopoietin.
To determine if syndecan-2 surface expression is interchangeable on HSCs, Sdc2+ HSCs or Sdc2– HSCs were cultured with TSF media. By day 3 of culture, >80% of the 34–KSL cells in cultures initiated with Sdc2+ HSCs became Sdc2–, whereas >30% of the 34–KSL cells in cultures initiated with Sdc2– HSCs became Sdc2+ (Figure 4F; supplemental Figure 3A); these distributions persisted through day 7 (Figure 4G; supplemental Figure 3B). Cultures initiated with Sdc2+ HSCs produced significantly more Sdc2+ and Sdc2– HSCs (Figure 4H,I), consistent with increased total cell expansion in the cultures initiated with Sdc2+ HSCs (Figure 4B,E). We also sorted Sdc2+34–KSL cells and Sdc2–34–KSL cells from day 7 cultures, replated each population in TSF media, and quantified the percentages of Sdc2+34–KSL cells in each group after 14 total days of culture (supplemental Figure 3C). Both Sdc2+34–KSL cells and Sdc2–34–KSL cells derived from originating Sdc2– HSCs continued to produce a higher percentage of Sdc2+34–KSL cells in culture compared with the progeny of Sdc2+ HSCs (supplemental Figure 3D). These results suggest that a subset of Sdc2– HSCs can convert to Sdc2+34–KSL cells in response to cytokine stimulation.
In vivo analysis of Syndecan-2 expression on BM donor 34–KSL cells at 8 weeks after competitive transplantation of Sdc2+ or Sdc2– HSCs showed that donor Sdc2+ HSCs gave rise to significantly more Sdc2+ HSCs, whereas donor Sdc2– HSCs rarely produced Sdc2+ HSCs (Figure 4J; supplemental Figure 3E). We also quantified whether Syndecan-2 expression is retained upon hematopoietic differentiation after HSC transplantation. In the BM, <30% of donor-derived B, T, and myeloid cells retained Sdc2 surface expression (supplemental Figure 3F). Conversely, 10% to 30% of donor T, B, and myeloid cells produced by transplanted Sdc2– HSCs expressed surface syndecan-2, suggesting that Syndecan-2 expression is acquired upon differentiation of Sdc2– HSCs.
In cultures initiated with Sdc2– HSCs, >70% of 34–KSL cells were in G0 at day 7, compared with 40% of the Sdc2+ HSC cultures (Figure 4K). However, because the numbers of 34–KSL cells significantly increased in Sdc2+ HSC cultures compared with cultures of Sdc2– HSCs (Figure 4E), the overall percentages of G0 34–KSL cells increased in the Sdc2+ HSC cultures compared with the progeny of Sdc2– HSCs (Figure 4L). Mice transplanted with the progeny of cultured Sdc2+ HSCs exhibited increased donor multilineage hematopoietic cell repopulation compared with mice transplanted with the progeny of Sdc2– HSCs or 34–KSL HSCs (Figure 4M). We also detected increased percentages of donor CD150+CD48–KSL HSCs in the BM of mice transplanted with the progeny of Sdc2+ HSC cultures compared with mice transplanted with the progeny of Sdc2– HSCs or 34–KSL HSCs (Figure 4N). Secondary competitive transplantation assays using BM cells isolated at 16 weeks posttransplant from primary recipient mice confirmed that long-term engraftment potential was increased in the cultured progeny of Sdc2+ HSC cultures compared with the progeny of Sdc2– HSCs or 34–KSL HSCs (supplemental Figure 3G).
Syndecan-2 regulates HSC quiescence and repopulating capacity
We next used a Sdc2 global knockout mouse (Sdc2−/−) to assess the requirement for syndecan-2 in hematopoietic repopulation. Mice transplanted with BM cells from Sdc2−/− donor mice displayed modestly decreased total donor chimerism and T- and B-cell chimerism at 16 weeks compared with mice transplanted with BM cells from Sdc2+/+ mice (supplemental Figure 4). However, use of this global knockout approach did not allow direct examination of the role of syndecan-2 expressed by HSCs in mediating HSC function. We therefore used lentiviral short hairpin RNAs to silence Sdc2 expression in HSCs. Treatment with 2 unique short hairpin RNA clones targeting Sdc2 (shSdc2 Clone #1 and shSdc2 Clone #2) significantly decreased Sdc2 expression and Syndecan-2 surface expression in Sdc2+ HSCs (supplemental Figure 5A-C). We detected decreased percentages and numbers of CD150+CD48–34–KSL LT-HSCs in shSdc2-treated HSCs compared with shControl-treated Sdc2+ HSCs and no change in percentages of CD150+CD48–34–KSL LT-HSCs in Sdc2– HSCs treated with shSdc2 (Figure 5A-C). HSCs treated with shSdc2 also contained decreased total colony-forming cells and multilineage CFU-GEMMs compared with shControl-treated HSCs (Figure 5D-E).
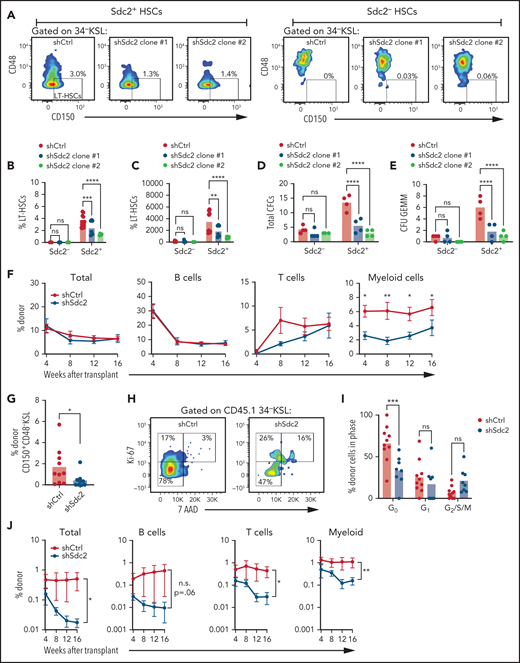
Syndecan-2 regulates HSC quiescence and self-renewal capacity. (A) Representative flow cytometric analysis of CD150+CD48– cells within the 34–KSL population treated for 48 hours with two Sdc2 short hairpin RNA clones (shSdc2 Clone #1 and shSdc2 Clone #2) or control short hairpin RNA (shCtrl, n = 3-6 replicates per group). (B) Percentages of CD150+CD48–34–KSL cells (LT-HSCs) in Sdc2– and Sdc2+ cells treated with shSdc2 or shCtrl (n = 3-6 replicates per group). (C) Numbers of phenotypic LT-HSCs after treatment with shSdc2 or shCtrl (n = 3-6 replicates per group). Numbers of total colony-forming cells (CFCs) (D) and CFU-GEMMs (E) in BM 34–KSL cells at 48 hours after treatment with shSdc2 or shCtrl (n = 4 replicates per group). (F) Percentages of total donor CD45.1+ cells in the PB of recipient CD45.2+ mice over time and percentages of donor cells within the B-cell, T-cell, and myeloid cell populations over time after competitive transplantation of shSdc2-treated BM 34–KSL cells or shCtrl-treated BM 34–KSL cells (n = 8-10 recipients per group). (G) Percentages of donor CD45.1+CD150+CD48– cells in the BM at 16 weeks posttransplant in each group (n = 8-10 recipients per group). (H) Representative cell cycle analysis of donor CD45.1+34–KSL cells in the BM of recipient mice at 16 weeks after transplantation of shSdc2-treated KSL cells or shCtrl-treated KSL cells. (I) Quantification of the percentages of donor cells in G0, G1, and G2/S/M phases in the groups shown (n = 8-10 replicates per group). (J) Percentages of total donor CD45.1+ cells, B cells, T cells, and myeloid cells in the PB over time after secondary competitive transplant in the treatment groups shown (n = 8-10 replicates per group). Error bars = standard error of the mean. Statistics denote Holm-Šidák’s post hoc unpaired Student t test after 1- or 2-way analysis of variance; for secondary competitive transplants, statistics denote the overall effect of shSdc2 treatment. *P < .05, **P < .01, ***P < .001, ****P < .0001. ns, not significant; SSC-A, side scatter area.
Syndecan-2 regulates HSC quiescence and self-renewal capacity. (A) Representative flow cytometric analysis of CD150+CD48– cells within the 34–KSL population treated for 48 hours with two Sdc2 short hairpin RNA clones (shSdc2 Clone #1 and shSdc2 Clone #2) or control short hairpin RNA (shCtrl, n = 3-6 replicates per group). (B) Percentages of CD150+CD48–34–KSL cells (LT-HSCs) in Sdc2– and Sdc2+ cells treated with shSdc2 or shCtrl (n = 3-6 replicates per group). (C) Numbers of phenotypic LT-HSCs after treatment with shSdc2 or shCtrl (n = 3-6 replicates per group). Numbers of total colony-forming cells (CFCs) (D) and CFU-GEMMs (E) in BM 34–KSL cells at 48 hours after treatment with shSdc2 or shCtrl (n = 4 replicates per group). (F) Percentages of total donor CD45.1+ cells in the PB of recipient CD45.2+ mice over time and percentages of donor cells within the B-cell, T-cell, and myeloid cell populations over time after competitive transplantation of shSdc2-treated BM 34–KSL cells or shCtrl-treated BM 34–KSL cells (n = 8-10 recipients per group). (G) Percentages of donor CD45.1+CD150+CD48– cells in the BM at 16 weeks posttransplant in each group (n = 8-10 recipients per group). (H) Representative cell cycle analysis of donor CD45.1+34–KSL cells in the BM of recipient mice at 16 weeks after transplantation of shSdc2-treated KSL cells or shCtrl-treated KSL cells. (I) Quantification of the percentages of donor cells in G0, G1, and G2/S/M phases in the groups shown (n = 8-10 replicates per group). (J) Percentages of total donor CD45.1+ cells, B cells, T cells, and myeloid cells in the PB over time after secondary competitive transplant in the treatment groups shown (n = 8-10 replicates per group). Error bars = standard error of the mean. Statistics denote Holm-Šidák’s post hoc unpaired Student t test after 1- or 2-way analysis of variance; for secondary competitive transplants, statistics denote the overall effect of shSdc2 treatment. *P < .05, **P < .01, ***P < .001, ****P < .0001. ns, not significant; SSC-A, side scatter area.
Primary competitive repopulation assays performed by using shSdc2-treated HSCs and shControl-treated HSCs displayed no differences in total donor cells, donor B-cell, or T-cell chimerism in primary recipient mice (Figure 5F; supplemental Figure 5D). However, donor myeloid cell chimerism was decreased in mice transplanted with shSdc2-treated HSCs. Donor cell engraftment within BM CD150+CD48–KSL HSCs was also decreased in mice transplanted with shSdc2-treated HSCs compared with control mice (Figure 5G). At 16 weeks, donor 34–KSL cells in the BM of recipient mice transplanted with shSdc2-treated HSCs displayed decreased percentages of cells in G0 compared with donor 34–KSL cells in mice transplanted with shControl-treated HSCs (Figure 5H-I). Secondary competitive repopulation assays using BM cells from primary recipient mice transplanted with shSdc2-treated HSCs exhibited significantly decreased donor multilineage chimerism in recipients compared with mice transplanted with BM cells from primary mice transplanted with shControl-treated HSCs (Figure 5J).
Syndecan-2 regulates HSC quiescence through control of Cdkn1c
Syndecans mediate context-specific effects on cell proliferation, whereas we have observed that syndecan-2 expression is associated with HSC quiescence.34,35 We next measured the cell cycle status of BM 34–KSL HSCs after treatment with lentiviral particles containing shControl or shSdc2. HSCs treated with shSdc2 displayed decreased percentages of cells in G0 compared with shControl-treated HSCs, indicating exit from quiescence in response to syndecan-2 silencing (Figure 6A-C). Because the Cip/Kip family of cyclin-dependent kinase (Cdk) inhibitors regulates HSC cell cycling,36,37 we measured the expression of Cdkn1c, which encodes the cell cycle inhibitor p57 in shSdc2-treated HSCs and shControl-treated HSCs. At baseline, Sdc2+ HSCs expressed nearly 10-fold increased levels of Cdkn1c compared with Sdc2– HSCs (Figure 6D). Silencing of Sdc2 suppressed Cdkn1c expression in BM 34–KSL cells. Sdc2 knockdown in BM 34–KSL cells also caused a moderate increase in the expression of Cdkn1a and p16 compared with control HSCs but did not affect Cdkn1b expression (Figure 6E). Microscopic protein expression analyses revealed decreased p57 and increased p16 protein expression in shSdc2-treated HSCs compared with shControl-treated HSCs (supplemental Figure 5E-H).
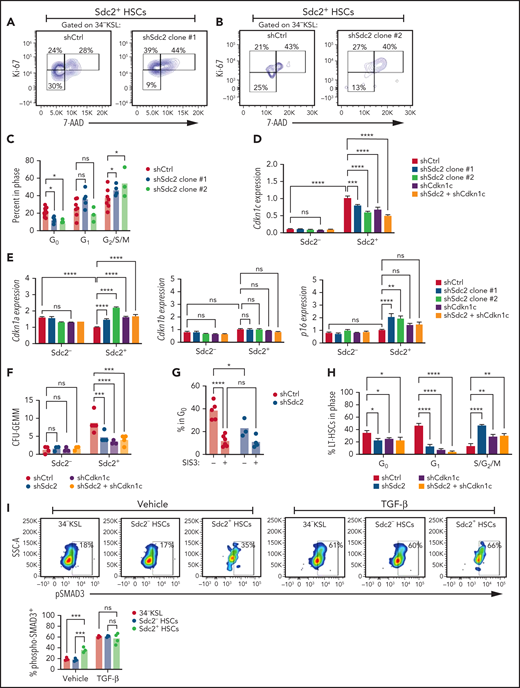

Syndecan-2 regulates HSC quiescence through Cdkn1c. Representative cell cycle analysis of shSdc2 Clone #1–treated (A) and shSdc2 Clone #2–treated (B) and shCtrl-treated Sdc2+34–KSL cells. (C) Percentages of 34–KSL cells in G0, G1, and G2/S/M phases in each group (n = 4-5 replicates per group). (D) Quantitative reverse transcription polymerase chain reaction analysis for the expression of Cdkn1c in Sdc2+ and Sdc2– BM 34–KSL cells treated with shCtrl, shSdc2, shCdkn1c, or shSdc2 and shCdkn1c (n = 3-12 replicates per group). (E) Quantitative reverse transcription polymerase chain reaction analysis for the expression of Cdkn1a, Cdkn1b, and p16 in Sdc2+ and Sdc2– BM 34–KSL cells treated with shCtrl, shSdc2, shCdkn1c, or shSdc2 and shCdkn1c (n = 3-12 replicates per group). (F) Numbers of CFU-GEMMs from 250 Sdc2+ HSCs treated with shCtrl, shSdc2, shCdkn1c, or shSdc2 + shCdkn1c. (G) Percentages of Sdc2+ HSCs in G0 after treatment with shSdc2 or shCtrl and 5 µM SIS3 or vehicle for 24 hours (n = 3-6 replicates per group). (H) Percentages of CD150+CD48–34–KSL LT-HSCs in G0, G1, and G2/S/M phases from Ki-67/7-AAD analysis (n = 3-4 replicates per group). (I) At left, representative flow cytometric analysis showing phospho-SMAD3 expression in 34–KSL, 34–KSL Sdc2–, and 34–KSL Sdc2+ HSCs as baseline and after TGFβ stimulation for 30 minutes; at right, quantification of the percent phospho-SMAD3 cells within each population. (J) Quantification of CFU-GEMMs from 100 Sdc2+ HSCs or Sdc2– HSCs treated with 5 µM SIS3 or vehicle (n = 5 mice, pooled for sort; n = 4 replicates per group). (K) Percent 34–KSL cells (percentage of live cells) after SIS3 treatment of Sdc2+ and Sdc2– HSCs for 7 days in TSF media (n = 3-6 replicates per group). (L) Volcano plots depicting differentially expressed genes in Sdc2+ HSCs vs Sdc2– HSCs. Differentially expressed genes were detected with parameters of P < .05, and fold change (FC) >2 or less than −2. (M) Heat map depicting Ingenuity Pathway Analysis comparing Sdc2+ HSCs and Sdc2– HSCs (n = 10 mice pooled to sort each population; n = 3 replicates per population; comparisons made between individual samples). (N) Heat map depicting selected differentially expressed genes within Hematological System Development, and (O) Cell Growth and Proliferation genes from Ingenuity Pathway Analysis of 34–KSL HSCs, Sdc2– HSCs, and Sdc2+ HSCs (n = 10 mice pooled to sort each population; n = 3 replicates per population). Error bars = standard error of the mean; statistics denote 2-way analysis of variance followed by unpaired Student t test. *P < .05, **P < .01, ***P < .001, ****P < .0001. FDR, false discovery rate; ns, not significant; SSC-A, side scatter area.
Syndecan-2 regulates HSC quiescence through Cdkn1c. Representative cell cycle analysis of shSdc2 Clone #1–treated (A) and shSdc2 Clone #2–treated (B) and shCtrl-treated Sdc2+34–KSL cells. (C) Percentages of 34–KSL cells in G0, G1, and G2/S/M phases in each group (n = 4-5 replicates per group). (D) Quantitative reverse transcription polymerase chain reaction analysis for the expression of Cdkn1c in Sdc2+ and Sdc2– BM 34–KSL cells treated with shCtrl, shSdc2, shCdkn1c, or shSdc2 and shCdkn1c (n = 3-12 replicates per group). (E) Quantitative reverse transcription polymerase chain reaction analysis for the expression of Cdkn1a, Cdkn1b, and p16 in Sdc2+ and Sdc2– BM 34–KSL cells treated with shCtrl, shSdc2, shCdkn1c, or shSdc2 and shCdkn1c (n = 3-12 replicates per group). (F) Numbers of CFU-GEMMs from 250 Sdc2+ HSCs treated with shCtrl, shSdc2, shCdkn1c, or shSdc2 + shCdkn1c. (G) Percentages of Sdc2+ HSCs in G0 after treatment with shSdc2 or shCtrl and 5 µM SIS3 or vehicle for 24 hours (n = 3-6 replicates per group). (H) Percentages of CD150+CD48–34–KSL LT-HSCs in G0, G1, and G2/S/M phases from Ki-67/7-AAD analysis (n = 3-4 replicates per group). (I) At left, representative flow cytometric analysis showing phospho-SMAD3 expression in 34–KSL, 34–KSL Sdc2–, and 34–KSL Sdc2+ HSCs as baseline and after TGFβ stimulation for 30 minutes; at right, quantification of the percent phospho-SMAD3 cells within each population. (J) Quantification of CFU-GEMMs from 100 Sdc2+ HSCs or Sdc2– HSCs treated with 5 µM SIS3 or vehicle (n = 5 mice, pooled for sort; n = 4 replicates per group). (K) Percent 34–KSL cells (percentage of live cells) after SIS3 treatment of Sdc2+ and Sdc2– HSCs for 7 days in TSF media (n = 3-6 replicates per group). (L) Volcano plots depicting differentially expressed genes in Sdc2+ HSCs vs Sdc2– HSCs. Differentially expressed genes were detected with parameters of P < .05, and fold change (FC) >2 or less than −2. (M) Heat map depicting Ingenuity Pathway Analysis comparing Sdc2+ HSCs and Sdc2– HSCs (n = 10 mice pooled to sort each population; n = 3 replicates per population; comparisons made between individual samples). (N) Heat map depicting selected differentially expressed genes within Hematological System Development, and (O) Cell Growth and Proliferation genes from Ingenuity Pathway Analysis of 34–KSL HSCs, Sdc2– HSCs, and Sdc2+ HSCs (n = 10 mice pooled to sort each population; n = 3 replicates per population). Error bars = standard error of the mean; statistics denote 2-way analysis of variance followed by unpaired Student t test. *P < .05, **P < .01, ***P < .001, ****P < .0001. FDR, false discovery rate; ns, not significant; SSC-A, side scatter area.
To further analyze how Sdc2 regulates p57, we used an MSCV overexpression system to generate Sdc2-overexpression (Sdc2-OE) or green fluorescent protein (GFP)-control HSCs (supplemental Figure 6A-B). We detected increased percentages of Sdc2-OE HSCs in G0 and decreased percentages in G1 compared with GFP-control HSCs, suggesting that Sdc2 expression induces HSC quiescence (supplemental Figure 6C-D). Furthermore, Sdc2-OE HSCs exhibited increased expression of Cdkn1c, suggesting that Sdc2 promotes Cdkn1c expression in HSCs (supplemental Figure 6E).
Given the role of Sdc2 in regulating Cdkn1c expression, we next knocked down both Sdc2 and Cdkn1c in Sdc2+ and Sdc2– HSCs. Silencing of Cdkn1c, Sdc2, or both in Sdc2– HSCs did not further decrease Cdkn1c levels, suggesting that Sdc2– HSCs minimally express Cdkn1c (Figure 6D). Silencing of Cdkn1c, Sdc2, or both in Sdc2– HSCs also did not affect the expression of Cdkn1a, Cdkn1b, or p16 (Figure 6E). In Sdc2+ HSCs, silencing of Cdkn1c and Sdc2 did not further decrease Cdkn1c expression or increase Cdkn1a expression compared with knockdown of Cdkn1c alone. Double knockdown of Sdc2 and Cdkn1c in Sdc2+ HSCs decreased CFU-GEMM colony production compared with shControl-treated HSCs, but this reduction was comparable to knockdown of either Sdc2 or Cdkn1c alone (Figure 6F). These results suggest that Sdc2 mediates molecular and hematopoietic effects through Cdkn1c.
The expression of Cdkn1c is regulated by transforming growth factor β (TGFβ)/SMAD signaling.38 Thus, we treated Sdc2+ HSCs with SIS3, a selective inhibitor of TGFβ-1–dependent SMAD3 phosphorylation, to determine if Sdc2-mediated HSC quiescence was dependent on Cdkn1c.39,40 Sdc2+ HSCs treated with SIS3 displayed a loss of quiescence compared with control Sdc2+ HSCs (Figure 6G). Silencing of Sdc2 expression decreased HSC quiescence in control Sdc2+ HSC cultures, but Sdc2 silencing had no significant effect on HSC quiescence in the presence of SIS3 treatment. We next assessed the cell cycle status of CD150+CD48–34–KSL Sdc2+ HSCs upon knockdown of Sdc2, Cdkn1c, or both. Silencing of Sdc2 alone, Cdkn1c alone, or both Sdc2 and Cdkn1c caused comparable reductions in the percentages of HSCs in G0 and G1, with concordant increases in percentages of HSCs in G2/S/M phase (Figure 6H). These data suggest that Syndecan-2 regulates HSC cell cycle status through Cdkn1c.
To understand why Sdc2+ HSCs are susceptible to inhibition of TGFβ-1–dependent SMAD3 phosphorylation whereas Sdc2– HSCs are not, we quantified phospho-SMAD3 expression in Sdc2+ and Sdc2– HSCs. Sdc2+ HSCs exhibited elevated SMAD3 activation at baseline compared with Sdc2– HSCs, but Sdc2+ and Sdc2– HSCs were equally sensitive to TGFβ stimulation (Figure 6I), suggesting that syndecan-2 expression marks HSCs with elevated basal SMAD3 signaling. We next treated HSCs with SIS3 to understand whether Sdc2+ or Sdc2– HSCs are dependent on SMAD3 signaling for HSC maintenance. SIS3 treatment of Sdc2+ HSCs significantly decreased CFU-GEMM generation compared with control-treated Sdc2+ HSCs (Figure 6J) and significantly decreased percentages of 34–KSL cells in culture (Figure 6K). Because TGFβ/SMAD signaling regulates Cdkn1c expression,41 these data are consistent with our genetic studies suggesting that Syndecan-2 regulates HSC quiescence and function through control of Cdkn1c.
To further evaluate the molecular basis through which syndecan-2 regulates HSC quiescence and repopulating capacity, we performed RNA sequence analysis of BM 34–KSL HSCs, Sdc2– HSCs, and Sdc2+ HSCs (supplemental Figure 7A-C). Differentially expressed genes (Figure 6L) were analyzed by using Ingenuity Pathway Analysis to assess diseases and functions and canonical pathways modulated based on Syndecan-2 expression. Our data revealed alterations in the hematopoietic system development and function pathway in Sdc2+ HSCs compared with Sdc2– HSCs (Figure 6M) and increased expression of genes associated with HSC function, including Hoxa10,42Hoxb4,43Gata1,44Gata3,45Esam,10Tek,46 and Slamf1,15Cttnal1,29Hoxb5,47Cd244, and Procr (CD201)15 and Fgd548 (Figure 6N). Given the interplay between Syndecans and integrins, we also analyzed alterations in integrin gene expression. Altered integrin signaling was detected in Sdc2+ HSCs compared with Sdc2– HSCs (supplemental Figure 7D), concordant with altered integrin protein expression (supplemental Figure 7E-F). Sdc2+ HSCs also displayed increased expression of Cdkn1c compared with Sdc2– HSCs (Figure 6O).
Discussion
Syndecan-2 is a member of the family of HSPGs, which, via their role as extracellular binding partners for secreted proteins,18,19 regulate morphogen gradients during development.26,49-52 Syndecans also modulate the differentiation, proliferation, and regeneration of adult neural stem cells.24,25 In hematopoiesis, HSPGs produced by stromal cells contribute to cytokine-mediated regulation of HSPC growth53-55 and HSPC retention in the BM.26 We discovered that BM HSCs are highly enriched for syndecan-2 expression, and isolation of BM cells based on syndecan-2 surface expression yields a 24-fold enrichment for CD150+48–KSL LT-HSCs and approximately sixfold enrichment for α-catulin+c-kit+ HSCs compared with syndecan-2– BM cells. Furthermore, mice transplanted competitively with 300 Syndecan-2+ BM lin– cells displayed enhanced BM engraftment of total cells, myeloid, and B cells through 16 weeks posttransplant, whereas the identical dose of CD150+ BM lin– cells or syndecan-2– BM lin– cells failed to engraft in recipient mice. Kiel et al13 reported the estimated HSC frequency in CD150+ BM cells to be 1 in 7600 cells, and our data suggest that syndecan-2 may provide unique advantages as a single marker to enrich for BM HSCs with in vivo repopulating capacity.
Previous landmark studies have shown that CD150+48–/41–KSL BM cells are the most highly enriched LT-HSC population, with an estimated HSC frequency of 1 in 3 to 4 cells based on competitive repopulation assays.12 Subsequently, Acar et al29 showed that ∼30% of BM α-catulin-GFP+c-Kit+ BM cells in α-catulin–GFP mice were bona fide LT-HSCs. Here, via limiting dilution analysis of competitive repopulation assays, we determined that the HSC frequency within Syndecan-2+34–KSL BM cells was indistinguishable from CD150+34–KSL BM cells and >10-fold increased compared with syndecan-2–34–KSL BM cells. Therefore, syndecan-2 represents a novel cell surface marker that can be used to enrich and purify HSC populations. Prior studies have also shown that CD150+ HSC populations are heterogeneous with regard to their myeloid or lymphoid potential,15,32 their rate of entry into cell cycle,56 and their self-renewal potential in vivo.57 Here, we showed that CD150+34–KSL Sdc2+ cells contain nearly all of the in vivo repopulating capacity of the CD150+34–KSL HSCs. Therefore, syndecan-2 surface expression may have utility toward resolving the heterogeneity in self-renewal capacity within the CD150+34–KSL HSC population. In keeping with this conclusion, we found that Sdc2+ HSCs are highly enriched for expression of numerous genes associated with enhanced hematopoietic cell stemness. Finally, our studies also suggest that syndecan-2 surface expression on phenotypic HSCs changes in response to cytokine stimulation and after competitive transplantation in mice; further studies will address whether loss or gain of syndecan-2 expression by phenotypic HSCs also reflects a change in self-renewal capacity.
Beyond its importance as a marker of LT-HSCs, syndecan-2 uniquely regulates HSC function via control of HSC quiescence. Silencing of syndecan-2 expression caused an increase in HSC cycling that persisted for several months after transplantation in mice. Commensurate with this finding, syndecan-2 silencing depleted HSCs with long-term in vivo repopulating capacity. The functional role of other HSC markers such as CD150 and endothelial protein C receptor has not been defined.8,12,15 Similarly, α-catulinGFP/GFP mice reportedly have normal hematopoiesis and normal HSC content and function.29 Surface expression of Esam1 and JAM-C has been shown to enrich for murine HSCs, and deletion of Esam1 was associated with lineage skewing, whereas JAM-C–deficient mice displayed increased myeloid cells.10,58 In our studies, selection of BM lin– cells or CD34–KSL HSCs for Sdc2 expression caused significant gain of HSC repopulating function in vivo, whereas silencing of Sdc2 expression in HSCs increased HSC cycling and depleted long-term repopulating HSCs. Syndecan-2 is uniquely modified by the addition of 3 heparan sulfate chains, whereas syndecan-1 and syndecan-3 are decorated by both chondroitin and heparan sulfate chains,59 which have been shown to have opposing physiological roles in other cell types.60,61 As such, our studies describing the unique self-renewal capacity of syndecan-2+ HSCs provide the basis for the development of strategies to increase heparan sulfate content on LT-HSCs.
Syndecan-2, expressed as a transmembrane HSPG, can serve as a coreceptor for TGFβ and either promote or inhibit TGFβ receptor–mediated signaling in a context-dependent manner.62,63 We have found that syndecan-2 promotes HSC quiescence and enhanced repopulating capacity through induction of Cdkn1c expression, which can be suppressed by inhibition of TGFβ signaling. These data suggest that syndecan-2 promotes HSC quiescence and enhanced repopulating capacity through activation of TGFβ receptor signaling and sustainment of Cdkn1c expression. TGFβ signaling and Smad pathway activation have also been shown to regulate p57 protein levels via control of proteolysis, and thus we will further explore this mechanism in regulating the quiescence of Syndecan-2+ HSCs.64 Because syndecans can regulate the activity of other growth factors, integrins, and extracellular matrix proteins that may act on HSCs,65 our findings also provide the basis for exploring additional syndecan-2–mediated pathways that regulate HSC quiescence and repopulating capacity. In summary, syndecan-2 expression enriches for HSCs and syndecan-2 regulates HSC repopulating capacity through control of HSC quiescence.
Acknowledgments
The authors acknowledge the generous technical support of Jeffrey Calimlim, Felicia Codrea, and Jessica Scholes of the UCLA Broad Stem Cell Center Flow Cytometry Facility; Edo Israley of Cedars Sinai Medical Center Pavilion Flow Cytometry; Xinmin Li and Lisa Uechi of the UCLA Technology Center for Genomics & Bioinformatics Core Facility; and Liman Zhao, Nicollette Setiawan, and Destiny Batton for animal colony management.
This work was supported by funding from the National Institutes of Health (NIH), National Heart, Lung, and Blood Institute (HL086998 [J.P.C.]; 1K08HL138305 [V.Y.C.]), NIH, National Institute of Allergy and Infectious Diseases (AI107333 and AI107333 [J.P.C.] and NIH, National Institute of Diabetes and Digestive and Kidney Diseases (1K01DK1126989-01A1 [C.M.T.]). This work was also supported by a California Institute for Regenerative Medicine (CIRM) Leadership Award (LA1-08014 [J.P.C.]), the Damon Runyon Cancer Research Foundation (DRG-2327-18 [C.M.T.]), the Burroughs Wellcome Fund (PDEP 1018686 [C.M.T.]), and the UC President’s Postdoctoral Fellowship (C.M.T.).
Authorship
Contribution: Project conceptualization was by J.P.C. and C.M.T.; experiments and analysis were performed by C.M.T., A.P., M.L., T.F., and V.Y.C.; C.M.T. and A.P. made figures; and C.M.T., A.P., and J.P.C. wrote the paper with input from all authors.
Conflict-of-interest disclosure: The authors declare no competing financial interests.
Correspondence: John P. Chute, Division of Hematology & Cellular Therapy, Regenerative Medicine Institute, Cedars Sinai Medical Center, 8700 Beverly Blvd, Los Angeles, CA 90048; e-mail: john.chute@cshs.org.
RNA sequencing data are available at Gene Expression Omnibus repository (accession number GSE151733).
Requests for original data may be submitted to john.chute@cshs.org or Christina.termini@cshs.org.
The online version of this article contains a data supplement.
There is a Blood Commentary on this article in this issue.
The publication costs of this article were defrayed in part by page charge payment. Therefore, and solely to indicate this fact, this article is hereby marked “advertisement” in accordance with 18 USC section 1734.

This feature is available to Subscribers Only
Sign In or Create an Account Close Modal