

Key Points
Higher c-20S proteasome and lower IGF-1 levels are associated with hemoglobin drops in children with P falciparum infections.
Known activities of c-20S proteasome and IGF-1 levels suggest roles in hemolysis and insufficient erythropoiesis.

Abstract
Anemia is common among young children infected with Plasmodium falciparum and severe malarial anemia (SMA) is a major cause of their mortality. Two major mechanisms cause malarial anemia: hemolysis of uninfected as well as infected erythrocytes and insufficient erythropoiesis. In a longitudinal birth cohort in Mali, we commonly observed marked hemoglobin reductions during P falciparum infections with a small proportion that progressed to SMA. We sought biomarkers of these processes using quantitative proteomic analysis on plasma samples from 9 P falciparum-infected children, comparing those with reduced hemoglobin (with or without SMA) vs those with stable hemoglobin. We identified higher plasma levels of circulating 20S proteasome and lower insulin-like growth factor-1 (IGF-1) levels in children with reduced hemoglobin. We confirmed these findings in independent enzyme-linked immunosorbent assay-based validation studies of subsets of children from the same cohort (20S proteasome, N = 71; IGF-1, N = 78). We speculate that circulating 20S proteasome plays a role in digesting erythrocyte membrane proteins modified by oxidative stress, resulting in hemolysis, whereas decreased IGF-1, a critical factor for erythroid maturation, might contribute to insufficient erythropoiesis. Quantitative plasma proteomics identified soluble mediators that may contribute to the major mechanisms underlying malarial anemia. This study was registered at www.clinicaltrials.gov as #NCT01168271.
Introduction
Anemia in young children is a major global health problem, especially in low- and middle-income countries, that impairs their health and development.1,2 Although severe malarial anemia (SMA) is an important cause of mortality, moderate anemia is more common in young children from high malaria transmission areas.3 Multiple factors contribute to anemia risk, including red blood cell abnormalities, nutritional deficiencies, helminthiasis, and malaria infections.1,3 Interventional trials of antimalarial chemoprevention or insecticide-treated bed nets showed malaria prevention reduces the risk of anemia.3,4 We previously reported that anemia including SMA episodes typically appear as an abrupt drop in hemoglobin during Plasmodium falciparum infection.5
Two major mechanisms contribute to SMA: (1) hemolysis of infected and uninfected erythrocytes and (2) insufficient erythropoiesis.6,7 Merozoite egress from infected red blood cells results in hemolysis, but the loss of red cells during malaria is typically out of proportion to the degree of parasitemia.8,9 Several studies proposed that hemolysis of uninfected red blood cells (URBCs) results from membrane protein and lipid modifications, including reduced CD55 and complement receptor 1 levels.6,10-15 Insufficient erythropoiesis has been associated with immune responses to malaria infection in some but not all studies.16-18 Bone marrow studies in patients with malaria anemia have revealed dyserythropoiesis.19,20 The proportion of hemozoin-containing macrophages in peripheral blood negatively correlated with hemoglobin levels in malaria-infected children, and free plasma hemozoin inhibited erythropoiesis in vitro.21
Here, we aimed to identify novel factors associated with acute hemoglobin loss during malaria infection using quantitative proteomics analysis of plasma samples. This approach is designed to profile global levels of plasma proteins and thereby identify pathways and proteins that associate with and thus might mediate hemolysis or insufficient erythropoiesis during malaria infection.
Methods
Study cohort and plasma sample selection
Samples were collected from children in a longitudinal birth cohort conducted in Ouélessébougou, Mali. The protocol and study procedures were approved by the National Institute of Allergy and Infectious Diseases Institutional Review Board at the US National Institutes of Health, and the Faculty of Medicine, Pharmacy and Dentistry Ethics Committee at the University of Bamako, Mali. Parents/guardians provided written informed consent for participation of the children in the study.
Study participants attended routine clinic visits monthly during the malaria transmission season and every 2 months during the dry season, as well as unscheduled visits anytime the child was sick. SMA was defined as parasitemia detected by blood smear microscopy and hemoglobin below 6 g/dL. Severe malaria (SM) syndromes other than SMA were defined as parasitemia detected by blood smear microscopy and 1 or more World Health Organization-defined criteria: ≥2 convulsions in the past 24 hours; prostration (inability to sit unaided or, in younger infants, inability to move/feed); respiratory distress (hyperventilation with deep breathing, intercostal recessions, and/or irregular breathing); coma (Blantyre score ≤3). Hemoglobin loss without SMA was defined as a reduction of >1.5 g/dL in hemoglobin compared with their previous measurement within 8 weeks. This represents a hemoglobin change greater than the 90th percentile (equal to δ of 1.4 g/dL) between 2 hemoglobin measurements among uninfected children. Stable hemoglobin among infected children was defined as a change of ≤1 g/dL in hemoglobin compared with the previous measurement within 8 weeks.
For the quantitative proteomic studies, 3 samples were randomly selected from children with a hemoglobin drop of >1.5 g/dL with SMA (hereafter called HDSMA) and 3 from those with a drop of >1.5 g/dL without SMA (HDNSMA), and these were matched for age and parasite density with an equal number of infected children with stable hemoglobin.
Quantitative proteomic analysis
A detailed description of sample preparation for proteomic analysis including Tandem Mass Tag (TMT) labeling, sample fractionation, liquid chromatography tandem mass spectometry and bioinformatic analysis is described in the supplemental Methods on the Blood Web site. Briefly, plasma samples depleted of 14 abundant proteins were reduced and alkylated followed by trypsin digestion. Peptides of each sample were then labeled with TMT reagents using TMT10plex Mass Tag Labeling Kit (Thermo Scientific). Equal amounts of labeled peptide samples were combined and fractionated on a C18 column. Peptide fractions were separated by nanoRP-HPLC (Ultimate 3000) connected to the Orbitrap Fusion Lumos Tribid mass spectrometer using a gradient of 5% to 30% of solvent B (0.1% formic acid, acetonitrile) for 75 minutes, and then to 85% solvent B for an additional 30 minutes. Acquired spectra analysis and protein quantification were performed using PEAKS Studio 8.5 and PEAKS Q module (Bioinformatics Solutions, Inc.).
Proteasome activity
Peptidase activity levels (caspase, trypsin, and chymotrypsin) in plasma were measured by continuous monitoring of production of 7-amino-4 methyl coumarin from fluorogenic peptides. The methods were based on Ma et al.22 Detailed assay information is described in the supplemental Methods.
ELISA validation studies
Circulating 20S proteasome, extracellular nicotinamide phosphoribosyltransferase (NAMPT), interleukin 18 (IL-18), α-1-antitrypsin, and insulin-like growth factor-1 (IGF-1) levels were measured in selected children’s plasma samples by the sandwich enzyme-linked immunosorbent assay (ELISA) method, according to manufacturers’ instructions. The following ELISA kits were used: 20S proteasome (Enzo Life Sciences, Farmingdale, NY); extracellular NAMPT (eNAMPT), DuoSet ELISA, human PBEF/Visfatin, IL-18, DuoSet ELISA, human total IL-18, IGF-1, quantikine ELISA (R&D Systems Minneapolis, MN); and A1AT (Aviva Systems Biology, San Diego, CA). Limit of detection for the different analytes were as follows: 20S proteasome, 0.05 μg/mL; eNAMPT, 4 ng/mL; IL-18, 23.4 pg/mL; A1AT, 1.09 ng/mL; IGF-1, 0.01 ng/mL.
Statistical analyses
Differences between groups in protein abundance (quantitative proteomics) were analyzed by a 2-sample t test of the log2 transformation of the abundance values. Proteins with a log2 fold change <−0.3 or >0.3, P < .05, and all proteins with a log2 fold change of ≤-1.0 or ≥1.0, were defined as differentially expressed proteins. Differences between groups in soluble mediator levels measured by ELISA and in proteasome activities were analyzed by the Wilcoxon method using JMP version 14 (SAS Institute, Cary, NC). P values were corrected for multiple comparisons by the Holm method, using R function p.adjust. Adjusted P values <.05 were considered significant.
Results
Study population
Study participants were selected from among participants in a longitudinal birth cohort conducted in Ouélessébougou, Mali.23 In the overall cohort, 10.7% and 7.6% of children had hemoglobin type AC and AS, respectively23; only children with hemoglobin type AA were included in the current study.
We speculated that processes associated with acute hemoglobin drop during P falciparum infections are shared between children that develop moderate and severe anemia. Therefore, for quantitative proteomics analysis, 3 samples from each of the following P falciparum-infected groups were included: (1) stable hemoglobin (<1.0 g/dL change in hemoglobin); (2) hemoglobin drop (>1.5 g/dL change in hemoglobin) without SMA (HDNSMA); and (3) hemoglobin drop with SMA (hemoglobin <6 g/dL) (HDSMA).
Age and parasite densities had been matched and were similar between children in the 3 groups (Table 1). By including P falciparum-infected children with stable hemoglobin as a comparator group, we sought to identify changes specifically related to reduction in hemoglobin, rather than changes associated with malaria infection per se.
Characteristics of children included in quantitative proteomic study
| Sample number | Group | Age (mo) | Parasite count/300 WBC | Hemoglobin (g/dL) | Change in hemoglobin (g/dL) |
|---|---|---|---|---|---|
| 1 | Stable hemoglobin | 34.8 | 3051 | 12.8 | −0.4 |
| 2 | Stable hemoglobin | 12.5 | 2213 | 11.7 | −0.8 |
| 3 | Stable hemoglobin | 20.1 | 8049 | 10.1 | −0.4 |
| 4 | Hemoglobin drop with SMA | 35.4 | 3726 | 5.3 | 2.7 |
| 5 | Hemoglobin drop with SMA | 9.6 | 1129 | 4.7 | 3.6 |
| 6 | Hemoglobin drop with SMA | 32.8 | 4231 | 5.6 | 3.3 |
| 7 | Hemoglobin drop without SMA | 37.1 | 4879 | 7.5 | 5.7 |
| 8 | Hemoglobin drop without SMA | 14.3 | 324 | 7.1 | 2.3 |
| 9 | Hemoglobin drop without SMA | 19.8 | 7609 | 6.7 | 3.2 |
WBC, white blood cell.
The validation study included plasma samples corresponding to the 3 groups of children included in quantitative proteomic analysis (stable hemoglobin, HDSMA, and HDNSMA) as well as samples from uninfected children and children with severe malaria syndromes other than SMA, indicated as SM (supplemental Table 1). Hemoglobin drop does not occur in every infection; thus, samples were selected from infected children including SM cases with stable hemoglobin, and uninfected children with stable hemoglobin, and these were matched for age and parasite density to those from HDSMA and HDNSMA children. All malaria-infected children presented with clinical symptoms and were treated with antimalarial drugs. Mild anemia is common among children in Africa.1 A total of 41.7%, 70.3%, 52.3%, and 57.1% of malaria-infected with stable hemoglobin, HDSMA, HDNSMA, and SM children had mild anemia in the prior visit.
Because of limitations in some sample volumes, 56% of samples had sufficient volume for testing in all assays; hence, the description of the study population is shown separately for the different analytes (supplemental Table 1).
Quantitative plasma proteome analysis of differentially expressed proteins associated with hemoglobin drop
We employed tandem mass spectrometry and TMT on samples collected at the time of infection to quantify the plasma proteome and associate variations with hemoglobin loss.
In the quantitative proteomics analysis of 9 samples, a total of 1205 human proteins were quantified with <1% false discovery rate, of which 856 proteins were identified and quantified with at least 2 unique peptides in all samples. The relative abundance of the 856 quantified proteins in children with hemoglobin drop were then calculated as log2 fold change relative to samples from children with stable hemoglobin (supplemental Table 2). Because quantitative proteomics was used as a discovery phase, 2 cutoffs were used to identify candidate proteins associated with acute hemoglobin drop in malaria-infected children: log2 fold change <−0.3 or >0.3 (P < .05), and log2 fold change ≤−1.0 or ≥1.0 (any P value). The number and details of proteins that met these criteria are shown in Figure 1, Table 2, and supplemental Table 2.
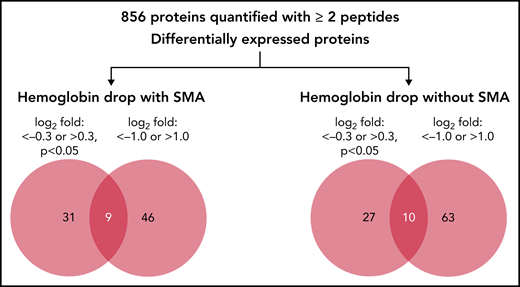
Quantitative proteomic of children’s plasma with hemoglobin drop. Venn diagram indicating the number of differentially expressed proteins in children with hemoglobin drop with and without SMA.
Quantitative proteomic of children’s plasma with hemoglobin drop. Venn diagram indicating the number of differentially expressed proteins in children with hemoglobin drop with and without SMA.
List of differential plasma proteins compared with control malaria-infected
| Symbol | Protein name | Fold change (log2) HGB drop with SMA | P value HGB drop with SMA | Fold change (log2) HGB drop without SMA | P value HGB drop without SMA |
|---|---|---|---|---|---|
| AHCY | Adenosylhomocysteinase | 0.35 | .04 | 1.18 | .06 |
| AK1 | Adenylate kinase 1 | −0.53 | .03 | −0.13 | .5 |
| ALPL | Alkaline phosphatase, liver/bone/kidney | −0.60 | .03 | −0.30 | .2 |
| AMBP | α-1-microglobulin | −0.35 | .3 | −0.66 | .04 |
| ANGPTL6 | Angiopoietin-like 6 | −0.55 | .04 | 0.07 | .7 |
| ANPEP | Alanyl (membrane) aminopeptidase | −0.50 | .05 | −0.63 | .04 |
| ATF6 | Activating transcription factor 6 | 0.30 | .2 | 0.52 | .04 |
| ATRN | Attractin | −1.02 | .01 | −0.78 | .04 |
| BPGM | 2,3-bisphosphoglycerate mutase | 0.22 | .5 | 1.25 | .04 |
| C4BPA | Complement component 4 binding protein, α | −2.08 | .02 | −1.81 | .1 |
| C4BPB | Complement component 4 binding protein, β | −1.36 | .03 | −0.93 | .2 |
| C8A | Complement component 8, α polypeptide | −0.45 | .01 | −0.36 | .1 |
| C8G | Complement component 8, γ polypeptide | −0.51 | .03 | −0.54 | .02 |
| CADM1 | Cell adhesion molecule 1 | −0.52 | .1 | −0.74 | .04 |
| CD59 | CD59 molecule, complement regulatory protein | 0.42 | .046 | 0.36 | .2 |
| CD84 | CD84 molecule | −0.24 | .4 | −0.35 | .02 |
| CR2 | Complement component (3d/Epstein Barr virus) receptor 2 | −1.23 | .03 | −0.71 | .1 |
| CRISP3 | Cysteine-rich secretory protein 3 | −0.50 | .1 | −0.57 | .001 |
| ECM1 | Extracellular matrix protein 1 | −0.29 | .02 | −0.21 | .1 |
| ENO2 | Enolase 2 (γ, neuronal) | −0.80 | .04 | −0.29 | .5 |
| FAT1 | FAT atypical cadherin 1 | −0.20 | .03 | 0.10 | .2 |
| FGFBP2 | Fibroblast growth factor binding protein 2 | 0.45 | .3 | 1.03 | .03 |
| GCLC | Glutamate-cysteine ligase, catalytic subunit | −0.11 | .6 | 0.78 | .04 |
| HABP2 | Hyaluronan binding protein 2 | 0.56 | .03 | 0.19 | .4 |
| HNRNPA2B1 | Heterogeneous nuclear ribonucleoprotein A2/B1 | 0.38 | .07 | 0.53 | .02 |
| HPX | Hemopexin | −0.47 | .07 | −0.59 | .01 |
| ICOSLG | Inducible T-cell co-stimulator ligand | −0.63 | .002 | −0.44 | .004 |
| IGFALS | Insulin-like growth factor binding protein, acid labile subunit | −1.45 | .01 | −1.45 | .07 |
| IGFBP1 | Insulin-like growth factor binding protein 1 | 1.05 | .2 | 1.70 | .02 |
| IGFBP3 | Insulin-like growth factor binding protein 3 | −0.91 | .06 | −0.95 | .01 |
| IGKC | Immunoglobulin κ constant | −1.26 | .04 | −1.06 | .07 |
| IL6ST | Interleukin 6 signal transducer | −0.40 | .3 | −0.42 | .01 |
| KLKB1 | Kallikrein B, plasma (Fletcher factor) 1 | −0.94 | .004 | −0.89 | .01 |
| LIPG | Lipase, endothelial | −0.18 | .2 | −0.33 | .02 |
| LMAN2 | Lectin, mannose-binding 2 | 0.40 | .001 | 0.16 | .5 |
| MBL2 | Mannose-binding lectin (protein C) 2, soluble | −1.42 | .2 | −1.99 | .03 |
| MELTF | Melanotransferrin OS=Homo sapiens GN=MFI2 PE=1 SV=2 | 0.20 | .02 | 0.11 | .5 |
| MFI2 | antigen p97 | 0.20 | .02 | 0.11 | .5 |
| NAMPT | Nicotinamide phosphoribosyltransferase | 0.57 | .046 | 1.09 | .1 |
| NBL1 | Neuroblastoma 1, DAN family BMP antagonist | −0.34 | .4 | −0.37 | .02 |
| NCAM1 | Neural cell adhesion molecule 1 | −0.19 | .6 | −0.48 | .03 |
| PLS3 | Plastin 3 | −0.99 | .02 | −0.34 | .3 |
| PLTP | Phospholipid transfer protein | 0.45 | .02 | 0.58 | .03 |
| PON3 | Paraoxonase 3 | −1.01 | .04 | 0.05 | .9 |
| PRAP1 | Proline-rich acidic protein 1 | 1.06 | .046 | 0.99 | .01 |
| PROCR | Protein C receptor, endothelial | −0.80 | .04 | −0.70 | .2 |
| PRSS3P2 | Putative trypsin-6 | −0.37 | .04 | −0.22 | .5 |
| PSMA1 | Proteasome subunit α 1 | 0.43 | .02 | 0.83 | .047 |
| PSMA2 | Proteasome subunit α 2 | 0.50 | .02 | 1.05 | .03 |
| PSMA4 | Proteasome subunit α 4 | 0.39 | .03 | 0.86 | .03 |
| PSMA6 | Proteasome subunit α 6 | 0.46 | .02 | 0.99 | .05 |
| PSMA7 | Proteasome subunit α 7 | 0.34 | .01 | 0.77 | .07 |
| PSMB1 | Proteasome subunit β 1 | 0.31 | .1 | 0.74 | .02 |
| PSMB10 | Proteasome subunit β 10 | 0.74 | .03 | 0.87 | .03 |
| PSMB3 | Proteasome subunit β 3 | 0.51 | .05 | 1.05 | .02 |
| PSMB4 | Proteasome subunit β 4 | 0.42 | .005 | 1.00 | .04 |
| PSMB5 | Proteasome subunit β 5 | 0.26 | .4 | 1.06 | .01 |
| PSMB6 | Proteasome subunit β 6 | 0.36 | .5 | 1.20 | .04 |
| PZP | Pregnancy-zone protein | −1.67 | .04 | −1.65 | .02 |
| SERPINA7 | Serpin peptidase inhibitor, clade A | −0.43 | .03 | −0.58 | .02 |
| TGFBI | Transforming growth factor, β-induced, 68kDa | 0.62 | .2 | 0.39 | .02 |
| TNFAIP6 | Tumor necrosis factor, α-induced protein 6 | −0.41 | .01 | −0.01 | 1.0 |
| ZYX | Zyxin | −0.35 | .2 | −0.61 | .04 |
HGB, hemoglobin. P values <0.05 are bolded, and P values 0.05-0.09 are italicized.
Pathway analysis of differentially expressed proteins
To infer functional associations between plasma protein abundance and hemoglobin drop, the data set of differentially expressed proteins (Table 2; supplemental Table 2) was used to identify protein interaction networks using Ingenuity Pathway Analysis. The networks inferred from the subset of proteins that met the cutoff for log2 fold change <−0.3 or >0.3, P < .05, included 2 interconnected subnetworks. In both HDSMA and HDNSMA children, 1 subnetwork comprised multiple 20S proteasome subunits that were significantly more abundant compared with malaria-infected children with stable hemoglobin (Figure 2A,C). The other subnetwork in both HDSMA and HDNSMA comprised protein families associated with the response to infection (acute phase response proteins, cytokine activity), blood coagulation, and lipid metabolism (Figure 2A,C). Proteins associated with complement activity and those associated with heme binding (hemopexin and α-1-microglobulin) were lower in both HDSMA and HDNSMA compared with malaria-infected children with stable hemoglobin; however, these differences in abundance only achieved statistical significance for complement-associated proteins in HDSMA and for heme binding proteins in HDNSMA (Table 2).

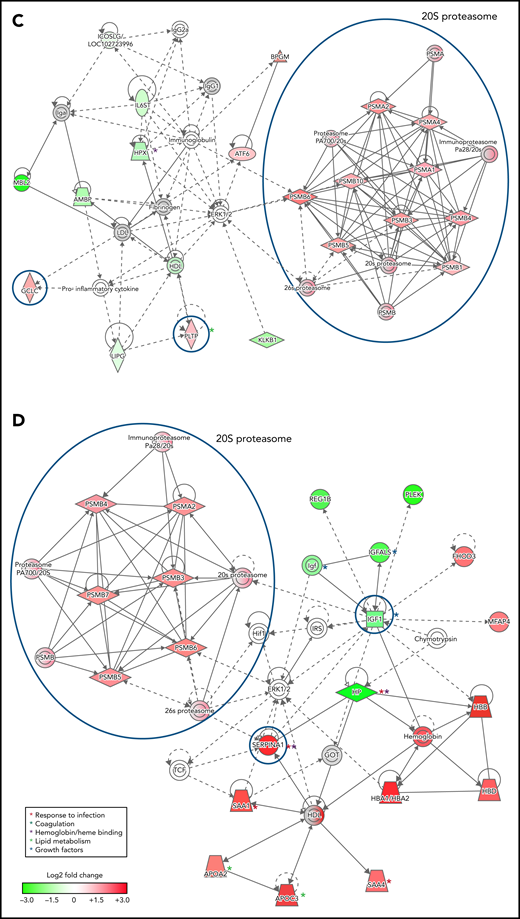
Networks of differentially expressed plasma proteins in children with reduced hemoglobin. Comparison of differentially expressed plasma proteins in children with hemoglobin drop (A,B) with SMA and (C,D) without SMA to control malaria-infected children by Ingenuity Pathway Analysis. Analyses in panels A and C included differentially expressed proteins defined as log2 fold change <−0.3 or >0.3, P < .05, and analyses displayed in panels B and D included differentially expressed proteins defined as log2 fold change ≤-1.0 or ≥1.0. Green and red symbols represent proteins that were down- and upregulated, and gray symbols represent similarly expressed proteins identified in the study. Solid and broken lines represent direct and indirect interactions respectively. Proteins selected for validation study are marked with blue circles.
Networks of differentially expressed plasma proteins in children with reduced hemoglobin. Comparison of differentially expressed plasma proteins in children with hemoglobin drop (A,B) with SMA and (C,D) without SMA to control malaria-infected children by Ingenuity Pathway Analysis. Analyses in panels A and C included differentially expressed proteins defined as log2 fold change <−0.3 or >0.3, P < .05, and analyses displayed in panels B and D included differentially expressed proteins defined as log2 fold change ≤-1.0 or ≥1.0. Green and red symbols represent proteins that were down- and upregulated, and gray symbols represent similarly expressed proteins identified in the study. Solid and broken lines represent direct and indirect interactions respectively. Proteins selected for validation study are marked with blue circles.
The networks inferred from the subset of proteins that met the cutoff for log2 fold change <−1.0 or >1.0 (Figure 2B,D) included acute phase response proteins and growth factor-associated proteins in both HDSMA and HDNSMA groups. In the HDSMA group, the network also included complement components, whereas in the HDNSMA group, the network included 20S proteasome subunits.
Differentially expressed proteins selected for validation studies
Based on Ingenuity Pathway Analysis network analysis, we selected 20S proteasome, NAMPT, phospholipid transfer protein (PLTP), glutamate-cysteine ligase (GCLC), α-1-antitrypsin (SERPINA1, A1AT), IL-18, and IGF-1 for validation studies in an independent subset of children from the same cohort.
Circulating 20S proteasome
Several components of 20S proteasome were associated with hemoglobin loss in the quantitative proteomics analyses, represented by 7 and 9 subunits overexpressed in HDSMA and HDNSMA groups, respectively. This is the first report describing an increase in 20S proteasome in malarial anemia. Increased circulating 20S proteasome (c-20S proteasome) levels in plasma have been previously observed with other acute and chronic diseases.24 In both groups of children with a substantial hemoglobin drop studied here, proteasome subunits represented more than 1/3 of the differentially expressed plasma proteins included in the primary network. As was seen in the quantitative proteomics analysis, c-20S proteasome concentrations measured by ELISA also significantly differed between groups (P < .0001). Pairwise comparisons to identify the group driving the difference showed that children with HDSMA or HDNSMA had similar c-20S proteasome levels (Figure 3A) that were higher than uninfected control children (P = .0004 and P = .001, respectively) and those with stable hemoglobin (P = .006 and P = .04, respectively). Children with SM (who had stable hemoglobin) had similar c-20S proteasome as uninfected controls and infected children with stable hemoglobin. c-20S proteasome levels negatively correlated with the hemoglobin levels, r = -0.54, P = .0001.

Comparison of c-20S proteasome concentrations and activity between plasma samples of malaria-infected and uninfected children. (A) C-20S proteasome concentration, (B) caspase-like, (C) chymotrypsin-like, and (D) trypsin-like activities were measured in plasma samples from children with hemoglobin drop with and without SMA, stable hemoglobin, SM, and uninfected children (n = 17, 20, 19, 6, and 9 respectively). Significant differences (Holm adjusted P value) are indicated in the figure.
Comparison of c-20S proteasome concentrations and activity between plasma samples of malaria-infected and uninfected children. (A) C-20S proteasome concentration, (B) caspase-like, (C) chymotrypsin-like, and (D) trypsin-like activities were measured in plasma samples from children with hemoglobin drop with and without SMA, stable hemoglobin, SM, and uninfected children (n = 17, 20, 19, 6, and 9 respectively). Significant differences (Holm adjusted P value) are indicated in the figure.
We further measured proteasomal proteolytic activities (caspase-like, chymotrypsin-like, and trypsin-like) in the plasma samples using fluorogenic peptides. Caspase-like activity levels were significantly higher in children with HDNSMA and those with SM compared with uninfected children (P = .03, and P = .03, respectively; Figure 3B, supplemental Table 3). Plasma chymotrypsin-like activity levels were significantly higher in children with HDSMA or HDNSMA compared with uninfected children (P = .04 and P = .006, respectively; Figure 3C, supplemental Table 3) but not malaria-infected children with stable hemoglobin, whereas activity was similar between malaria-infected children with stable hemoglobin with and without SM and uninfected children (supplemental Table 3). Plasma trypsin-like activity levels were similar between groups (P = .4; Figure 3D). Of the 3 proteinase activities, only chymotrypsin-like activity correlated with c-20S proteasome concentration (r = 0.55, P = .0001).
Response to infection and oxidative stress
eNAMPT, previously named pre-B enhancing factor, is an adipocytokine that plays a role in promoting pre-B-cell colony formation and in macrophage activation.25 eNAMPT is secreted by various cell types via nonclassical secretion pathways.26,27 In the quantitative plasma proteome analysis, eNAMPT was significantly higher in samples from children with HDSMA vs stable hemoglobin (log2 fold change 0.567, P = .046), but not in children with HDNSMA vs stable hemoglobin (log2 fold change 1.09, P = .1). By ELISA, eNAMPT levels were higher in children with HDNSMA vs children with stable hemoglobin and uninfected children, but the differences did not achieve significance after correcting for multiple comparisons (Figure 4A; supplemental Table 3).
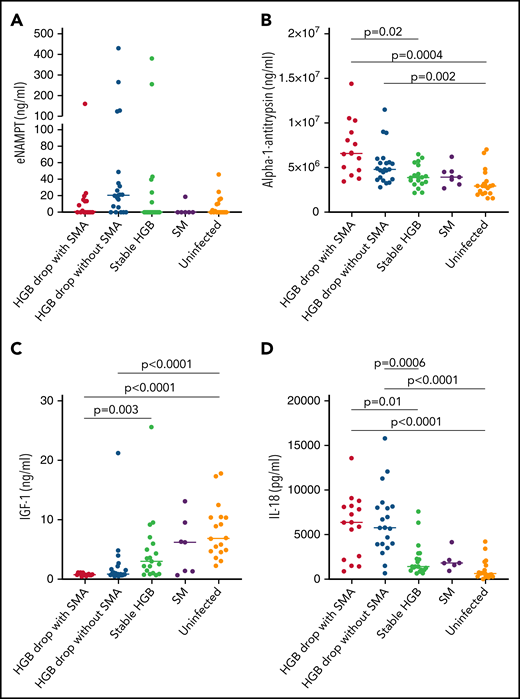
ELISA analysis of (A) eNAMPT, (B) IL-18, (C) α-1-antitrypsin, and (D) IGF-1 levels in plasma samples of malaria-infected and uninfected children. Plasma levels were compared between plasma samples from children with hemoglobin drop with and without SMA, stable hemoglobin, SM, and uninfected children (eNAMPT and IL-18: n = 16, 20, 19, 6, and 18; AIAT and IGF-1: n = 14, 21, 18, 7, and 18, respectively). Significant differences (Holm adjust P value) are indicated in the figure.
ELISA analysis of (A) eNAMPT, (B) IL-18, (C) α-1-antitrypsin, and (D) IGF-1 levels in plasma samples of malaria-infected and uninfected children. Plasma levels were compared between plasma samples from children with hemoglobin drop with and without SMA, stable hemoglobin, SM, and uninfected children (eNAMPT and IL-18: n = 16, 20, 19, 6, and 18; AIAT and IGF-1: n = 14, 21, 18, 7, and 18, respectively). Significant differences (Holm adjust P value) are indicated in the figure.
α-1-antitrypsin is a pleiotropic protein that plays a role as a protease inhibitor and also controls inflammatory responses independent of protease inhibition.28,29 By ELISA, levels were significantly higher in HDSMA compared with infected children with stable hemoglobin and uninfected children, and higher in HDNSMA compared with uninfected children (Figure 4B; supplemental Table 3). α-1-antitrypsin levels negatively correlated with hemoglobin, and positively with IL-18 and c-20S proteasomes levels (r = -0.49, P = .02; r = 0.46, P = .03; and r = 0.43, P = .08, respectively).
In quantitative proteomic analysis, IL-18 was more abundant in samples from children with reduced hemoglobin, but it was identified with 1 peptide and therefore excluded from the network analysis (supplemental Table 2). Cytokines like IL-12, IL-18, IL-23, and interferon-γ levels are known to be elevated during SMA.30-32 Cytokine detection by mass spectrometry is challenging because of the generally low concentrations, large dynamic range of plasma protein levels, and low molecular weight.33 Even after depleting the most abundant proteins such as albumin and IgG, cytokine levels in the picogram range are poorly detected vs plasma proteins expressed at the nanogram to microgram range.34 Low-molecular-weight proteins produce fewer peptides and are more difficult to detect and quantify than larger proteins.33 Because IL-18 was previously reported to play a role in the development of SMA,31 we included it in the validation study. By ELISA (Figure 4D), IL-18 levels were higher in children with HDNSMA or HDSMA, compared with stable hemoglobin and uninfected children. IL-18 levels negatively correlated with hemoglobin levels (r = -0.59, P = .0001) and positively with c-20S proteasome concentration (r = 0.6, P < .0001).
GCLC is a critical enzyme in the synthesis of the antioxidant glutathione. GCLC was more abundant by quantitative proteomics in HDNSMA but not HDSMA compared with stable hemoglobin. In validation ELISA assays, GCLC levels were similar between groups (supplemental Figure 1A).
Lipid metabolism
PLTP is a lipid transfer protein, and its activity increases during inflammatory responses.35 In recent years, it has been proposed that PLTP also plays a role in shifting the balance between proinflammatory and anti-inflammatory immune responses toward a proinflammatory response.36 Although in quantitative proteomics, PLTP was more abundant in HDSMA and HDNSMA compared with malaria-infected children with stable hemoglobin, ELISA studies showed levels were similar between groups (supplemental Figure 1B).
Growth factor: IGF-1
By quantitative proteomics, IGF-1 levels were lower in HDSMA and HDNSMA compared with malaria-infected children with stable hemoglobin (Figure 1B,D). IGF-1 is part of the growth hormone axis that also plays a role in erythroid maturation.37 Inflammatory immune responses during chronic and acute infections are associated with reduced levels of IGF-1.38 In ELISA studies of the validation cohort, IGF-1 levels were significantly lower in HDSMA and HDNSMA compared with uninfected children. IGF-1 levels were lower in HDSMA and HDNSMA compared with infected children with stable hemoglobin; after correcting for multiple comparisons, differences remained significant for the comparison with HDSMA (Figure 4C; supplemental Table 3). IGF-1 levels positively correlated with hemoglobin levels (r = 0.63, P = .0002) and negatively with IL-18 (r = -0.54, P = .004).
Based on pathway analysis, chymotrypsin acts on IGF-1.39 We therefore examined the correlation between IGF-1, c-20S proteasome levels, and enzymatic activity. IGF-1 levels negatively correlated with c-20S proteasome levels (r = -0.57, P = .002) and chymotrypsin activity level (r = -0.50, P = .02).
Discussion
Young children are most susceptible to severe malaria, with SMA being the most common presentation in areas with high malaria transmission. During acute malaria infection, children often experience abrupt reductions in hemoglobin levels resulting in varying degrees of anemia, including SMA in a small proportion of episodes.3 We used quantitative proteomics to study 9 malaria-infected children and identify networks of differentially expressed plasma proteins associated with substantial drops in hemoglobin in children with or without SMA, compared with children with stable hemoglobin levels. We identified significant increases in c-20S proteasome concentrations in both groups of children with hemoglobin drops compared with children with stable hemoglobin levels. We then validated these differences by ELISA measurements in an expanded set of samples.
Increased c-20S proteasome concentrations have been observed in both acute and chronic diseases24 and under oxidative stress conditions.40 Recently, a comparative plasma proteome analysis described similar levels of circulating c-20S proteasome or the subunit PSMB9 in plasma samples from children who survived or died of cerebral malaria.41 Among children with cerebral malaria, however, PSMB9 levels correlated with the number of convulsions.41
Whether c-20S proteasome in plasma plays a role in protein degradation (as does intracellular proteasome) is unknown. Purified plasma c-20S proteasome has catalytic activity that is blocked by proteasome-specific inhibitors.42 Similarly, c-20S proteasome in bronchoalveolar lavage has catalytic activity (indicated by extensive degradation of albumin) that is specifically blocked by proteasome inhibitors.43 Because levels of circulating c-20S proteasome increase under stress conditions, others have proposed it may act to clear damaged proteins in the extracellular space, similar to the role of intracellular proteasome, but this remains to be determined.40 A recent in vitro study44 described that P falciparum-derived extracellular vesicles (EVs) play a role in modifying URBC membrane for merozoite invasion. Specifically, URBC cytoskeleton proteins are phosphorylated by EV-derived kinases that are then subjected to degradation by EV-derived 20S proteasome.44 Separately, malaria infection is associated with increased plasma EVs, and EV counts increase with disease severity.45
Here, c-20S proteasome levels were significantly higher in samples of children with acute hemoglobin drop compared with levels in uninfected children and infected children with stable hemoglobin. Similarly, chymotrypsin-like activity was significantly higher in plasma of children with acute hemoglobin drop compared with uninfected children. It is possible that children with an acute drop in hemoglobin may have excessive secretion of infected red blood cells-EVs, leading to an increase in modified URBC that could result in hemolysis and acute hemoglobin drop. Separately, malaria infection is associated with oxidative stress especially in severe anemia cases,18 and increased EVs derived from different cell types46 could be a source for c-20S proteasome.47 In addition to URBC changes associated with P falciparum-EV, it is also possible that URBC membrane proteins modified under oxidative stress might be subjected to degradation by c-20S proteasome elevated during proinflammatory conditions, resulting in hemolysis (Figure 5). To validate the model, additional studies are needed relating oxidative stress biomarkers with c-20S proteasome and its activity on plasma proteins and URBC membrane proteins.
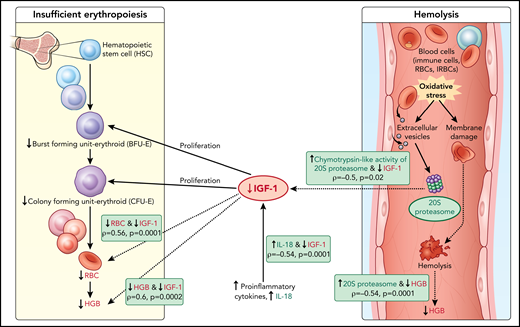
Model of acute hemoglobin drop. Based on quantitative plasma proteomic and validation studies, an acute drop in hemoglobin during malaria is associated with changes in levels of several soluble mediators. These observations were integrated with processes described in the literature and presented in the model. C-20S proteasome levels are significantly higher in malaria-infected children with hemoglobin drop vs children with stable hemoglobin, and 20S proteasome chymotrypsin-like activity is higher compared with uninfected children. Previously, malaria infection has been associated with oxidative stress, in particularly among children with SMA, which results in red blood cell membrane modification. In this model, we propose that modified membrane proteins are then subjected to degradation by c-20S proteasome, leading to hemolysis and decreased hemoglobin. In parallel, levels of IGF-1, one of the growth factors required for erythroid proliferation, are significantly reduced, which may be due to increased IL-18 levels, to increased chymotrypsin-like activity, or to both. The reduction in erythroid proliferation results in reduced hemoglobin levels, in addition to that caused by hemolysis. Factors associated with hemoglobin drops in the study are in green (increased) or red (decreased); dashed lines indicate associations described here and solid lines indicate previously described relationships.
Model of acute hemoglobin drop. Based on quantitative plasma proteomic and validation studies, an acute drop in hemoglobin during malaria is associated with changes in levels of several soluble mediators. These observations were integrated with processes described in the literature and presented in the model. C-20S proteasome levels are significantly higher in malaria-infected children with hemoglobin drop vs children with stable hemoglobin, and 20S proteasome chymotrypsin-like activity is higher compared with uninfected children. Previously, malaria infection has been associated with oxidative stress, in particularly among children with SMA, which results in red blood cell membrane modification. In this model, we propose that modified membrane proteins are then subjected to degradation by c-20S proteasome, leading to hemolysis and decreased hemoglobin. In parallel, levels of IGF-1, one of the growth factors required for erythroid proliferation, are significantly reduced, which may be due to increased IL-18 levels, to increased chymotrypsin-like activity, or to both. The reduction in erythroid proliferation results in reduced hemoglobin levels, in addition to that caused by hemolysis. Factors associated with hemoglobin drops in the study are in green (increased) or red (decreased); dashed lines indicate associations described here and solid lines indicate previously described relationships.
IL-18 is secreted by macrophages and acts synergistically with IL-12 to induce production of interferon-γ and other proinflammatory cytokine by immune cells.48,49 Previous studies reported increased IL-18 levels in patients with uncomplicated malaria and severe malaria (excluding cerebral malaria) compared with uninfected individuals.50,51 Among malaria patients, those with severe malaria including SMA have higher levels of IL-18 compared with uncomplicated malaria cases.50,51 Further, increased IL-18 gene expression was associated with a reduced hemoglobin levels among Kenyan children.31 Consistent with these results, IL-18 levels were significantly higher in children with HDSMA or HDNSMA, compared with infected children with stable hemoglobin or other severe malaria syndromes, and with uninfected children (Figure 4D; supplemental Table 3). C-20S proteasome levels correlated with IL-18 levels (r = 0.6, P < .0001), which could potentially result from increased EVs under proinflammatory conditions. α-1-antitrypsin levels were higher in children with HDSMA or HDNSMA. The increase in inflammatory markers is consistent with a recent finding that severe anemia is associated with increased levels of C-reactive protein and ferritin.52 Conversely, increasing immunity acquired as children age may limit inflammation and oxidative stress during infection and thus limit the change in soluble factors like 20S proteasome and IGF-1 that contribute to anemia. α-1-antitrypsin is an acute phase protein that inhibits elastase and reduces proinflammatory responses independent of protease inhibition.29,53 Although hemopexin is the major heme scavenger in plasma, under hemolytic conditions when hemopexin becomes saturated, other plasma proteins like albumin, α-1-antitrypsin, and α-1-microglobulin bind heme.54,55 The increased α-1-antitrypsin seen in infected children with hemoglobin drops may play 2 roles: (1) to counterbalance proinflammatory responses and (2) to clear free heme as hemopexin levels were lower in HDSMA and HDNSMA.
IGF-1 levels were significantly lower in children with reduced hemoglobin. IGF-1 plays a role in erythropoiesis, and malarial anemia is associated with insufficient erythropoiesis. Proinflammatory cytokines like tumor necrosis factor α (TNF-α) and IL-1β impair IGF-1 activity.56 In children with acute infections including febrile malaria, IGF-1 levels were significantly reduced compared with healthy children.57-59 IGF-1 and erythropoietin are essential for the complete development of erythroid progenitors.37,60,61 Several studies reported increased levels of erythropoietin in children with SMA8,62,63 and in a nonhuman primate model of SMA.64 These observations suggest that SMA is not caused by low erythropoietin but rather by a depressed bone marrow response to erythropoietin.
Based on the data described here, we propose that the lower IGF-1 level in children with hemoglobin drop has hindered the proliferation of erythroid progenitors, thereby contributing to anemia (Figure 5). The reduction in IGF-1 levels may be related to increased c-20S proteasome levels and increased chymotrypsin-like activity; an in vitro study demonstrated that IGF-1 is degraded by chymotrypsin and trypsin, with a much shorter half-life in the presence of chymotrypsin.39,65 Here, IGF-1 levels negatively correlated with c-20S proteasome and chymotrypsin-like activity. Further studies are needed to examine whether IGF-1 is a substrate of c-20S proteasome, especially under oxidative stress conditions. Alternatively, IGF-1 levels may have been lower in children with HDSMA and HDNSMA because of increased inflammation. Studies in animal models reported negative associations between IGF-1 expression and proinflammatory cytokines including IL-1β, TNF-α, and IL-18.66,67 Here, IGF-1 levels negatively correlated with IL-18.
Overall, the pattern observed in HDSMA and HDNSMA was similar: both groups had higher levels of c-20S proteasome compared with uninfected and malaria-infected children with stable hemoglobin. Similarly, IGF-1 levels were lower in both groups with hemoglobin loss compared with uninfected children or to malaria-infected children with stable hemoglobin, albeit the difference between HDNSMA and infected children with stable hemoglobin lost significance after correcting for multiple comparisons. These results suggest that similar mechanisms are associated with moderate and severe malarial anemia.
Limitations include analyzing samples collected during infection only. Future studies should also analyze samples collected before the event and estimate parasite biomass before and during the infection.
In summary, quantitative proteomics of plasma samples from children with an acute hemoglobin drop (with and without severe anemia) identified changes in multiple soluble mediators. Taken together, the increased c-20S proteasome and chymotrypsin-like activity observed here, along with a recent study describing the role of c-20S proteasome in modifying URBC for merozoite invasion in vitro44 as well as the known increase in EVs related to increased inflammation and oxidative stress during infection, support the hypothesis that the confluence of these factors contributes to URBC hemolysis and malarial anemia. The results also suggest a new mechanism for insufficient erythropoiesis during malaria, whereby reduced IGF-1 levels result in a reduction in the proliferation of erythroid progenitors.
Acknowledgments
The authors thank Ethan Tyler and Alan Hoofring from National Institutes of Health Medical Arts for illustrating Figure 5; the women and children in Ouélessébougou, Mali, for participation in the study; Rathy Mohan and the data management team in Ouélessébougou; and staff at the community health centers. The authors also thank J. Patrick Gorres for editing the manuscript and Jonathan Kurtis of the Center for International Health Research, Rhode Island Hospital, Brown University Medical School, for critical review of the manuscript.
This work was supported by the Intramural Research Program of the National Institutes of Health National Institute of Allergy and Infectious Diseases (grant ZIA AI001153-09).
Authorship
Contribution: A.M. and P.A.G.H. performed the quantitative proteomic and validation experiments; R.M. performed bioinformatic analysis; R.B. performed validation experiments; A.M., O.A., and B.S.D. performed clinical laboratory tests and human sample processing; S.G. and D.I. provided clinical care; A.D., P.E.D., and M.F. designed the longitudinal cohort study; M.F. conceived and designed the project; M.F. wrote the manuscript with contributions from P.A.G.H. and P.E.D.; and all authors have approved the manuscript.
Conflict-of-interest disclosure: The authors declare no competing financial interests.
Correspondence: Michal Fried, 29 Lincoln Dr, Room 4NN16, Molecular Pathogenesis and Biomarkers Section, Laboratory of Malaria Immunology and Vaccinology, National Institute of Allergy and Infectious Diseases, National Institutes of Health, Bethesda, MD 20892; e-mail: michal.fried@nih.gov.
The online version of this article contains a data supplement.
There is a Blood Commentary on this article in this issue.
The publication costs of this article were defrayed in part by page charge payment. Therefore, and solely to indicate this fact, this article is hereby marked “advertisement” in accordance with 18 USC section 1734.

This feature is available to Subscribers Only
Sign In or Create an Account Close Modal