

Key Points
Granulocyte MV from septic shock patients displays a heterogeneous profile of plasmin generation capacity driven by the uPA/uPAR system.
High level of PGC confers to granulocyte MVs the capacity to reduce clot formation and improves survival in a mouse model of septic shock.

Abstract
Microvesicles (MVs) have previously been shown to exert profibrinolytic capacity, which is increased in patients with septic shock (SS) with a favorable outcome. We, therefore, hypothesized that the plasmin generation capacity (PGC) could confer to MVs a protective effect supported by their capacity to lyse a thrombus, and we investigated the mechanisms involved. Using an MV-PGC kinetic assay, ELISA, and flow cytometry, we found that granulocyte MVs (Gran-MVs) from SS patients display a heterogeneous PGC profile driven by the uPA (urokinase)/uPAR system. In vitro, these MVs lyse a thrombus according to their MV-PGC levels in a uPA/uPAR-dependent manner, as shown in a fluorescent clot lysis test and a lysis front retraction assay. Fibrinolytic activators conveyed by MVs contribute to approximately 30% of the plasma plasminogenolytic capacity of SS patients. In a murine model of SS, the injection of high PGC Gran-MVs significantly improved mouse survival and reduced the number of thrombi in vital organs. This was associated with a modification of the mouse coagulation and fibrinolysis properties toward a more fibrinolytic profile. Interestingly, mouse survival was not improved when soluble uPA was injected. Finally, using a multiplex array on plasma from SS patients, we found that neutrophil elastase correlates with the effect of high-PGC-capacity plasma and modulates the Gran-MV plasmin generation capacity by cleaving uPA-PAI-1 complexes. In conclusion, we show that the high PGC level displayed by Gran-MVs reduces thrombus formation and improves survival, conferring to Gran-MVs a protective role in a murine model of sepsis.
Introduction
Septic shock (SS) is defined as a systemic response to an infection associated with vasoactive molecule-resistant hypotension and organ failure.1 SS occurs in 10% to 20% of patients in intensive care units, with a high mortality rate (30% to 50%).2 SS is characterized by intense systemic inflammation and exaggerated coagulation activation with defective fibrinolysis, ultimately leading to disseminated intravascular coagulation (DIC). SS-induced DIC results in the widespread development of fibrin clots, microvascular occlusion, and reduced oxygen delivery to tissues, leading to multiple organ failure and death.3 Accordingly, plasma levels of plasminogen activator inhibitor-1 (PAI-1), prothrombin/antithrombin ratio, and fibrinogen have been found to be associated with SS patient outcomes.4-6
Cell-derived microvesicles (MVs) are subcellular particles shed by activated or apoptotic cells that participate in the hemostatic equilibrium.7,8 MVs share a procoagulant potential that relies on the exposure of anionic phospholipids, especially phosphatidylserine, and the presence of tissue factor (TF),9 according to their cellular origin. MVs also harbor molecules that regulate their procoagulant activity, such as TF pathway inhibitor,10 endothelial protein C receptor,11 and thrombomodulin12 found on circulating MVs.13,14 Consistent with the cellular activation and apoptosis in SS, elevated levels of MVs have been reported in patients with sepsis.15-17 These MVs play a role in tissue injury and organ dysfunction by exerting deleterious procoagulant and proinflammatory effects and inducing endothelial dysfunction.18-21 Converging animal and clinical studies have emphasized this deleterious procoagulant role of MVs in sepsis and SS,22-24 whereas a series of unexpected observations have suggested a potential beneficial effect of selected MV subpopulations.25-29 However, the mechanisms underlying their protective effects are not fully understood.
Previous data have shown that the plasmin activation system is carried by MVs originating from leukocytic and endothelial cells.30 MV-dependent plasmin generation capacity (MV-PGC) involves the binding and activation of plasminogen in plasmin by its activator urokinase (uPA) or tissue plasminogen activator (t-PA), present at the MV surface. The MV-PGC is measurable on circulating MVs in healthy donors and is altered in various pathological settings.31 We recently showed that SS patients with a higher level of MV-PGC have a higher survival compared with patients with a lower level of MV-PGC.32 We, therefore, hypothesized that an increased MV-PGC could confer to MVs a protective role via the capacity to lyse a thrombus and investigated the mechanisms involved.
Methods
Blood collection and MV preparation and analysis
Blood samples were collected from patients with a diagnosis of SS according to the guidelines of the International Sepsis Definitions Conference within the first 24 hours after admission in the intensive care unit, along with age- and sex-matched healthy controls.33 Samples were collected and processed for MV purification and analysis according to international guidelines.34,35
MVs that mimic MVs from SS patients were also generated as a model by stimulating whole blood with lipopolysaccharide (LPS) and purifying them the same way as the patient-derived MVs (LPS-MVs). In certain experiments, the uPA receptor (uPAR) present on the MV surface was saturated by the addition of exogenous uPA as previously described.36 Granulocyte MVs (Gran-MVs) were also prepared from granulocytes isolated from healthy donors. MVs were characterized using immunomagnetic separation, flow cytometry, fibrin zymography, ELISA, and plasmin generation assays; the details are described in the supplemental Methods.
Thrombolysis experiments
The lytic effect of MVs, isolated from the blood of SS patients or LPS-stimulated normal blood, was investigated using 2 different in vitro lysis tests: (1) a fluorescent clot was incubated in MV-free platelet-free plasma (PFP) with increasing concentrations of MVs, and the released fluorescence was monitored with a plate reader, and; (2) the retraction of a fluorescent lysis front was measured by fluorescence microscopy. When needed, the euglobulin fraction was prepared by the acidification of citrated plasma, as previously described.37 The lytic effect of the euglobulin fraction containing or not containing MVs isolated from SS patients or healthy donors was evaluated by measuring the absorbance of the thrombus. The details are provided in the supplemental Methods.
Mouse sepsis model
Pathogen-free female CD-1 mice (Envigo Society France, Gannat, France) were operated (Day 0 [D0]) and divided into 3 groups receiving either Gran-MVs saturated with exogenous uPA (uPA-Gran-MVs), Gran-MVs, or the wash supernatant of uPA-Gran-MVs as control (SPN uPA-Gran-MVs). Sepsis was induced by cecal ligation and puncture as previously described38 with some modifications. Twenty-four hours after surgery, each animal group received a daily IV tail injection (D1 to D4) of uPA-Gran-MVs (107), Gran-MVs (107), or SPN uPA-Gran-MVs From D0 to D5, mortality was recorded, and each living animal was monitored to establish a clinical score.39,40 At D5, all animals were sacrificed. The kidney and lung tissues were analyzed for fibrin deposits as described in the supplemental Methods.
Statistical analysis
All statistical analyses were performed with GraphPad Prism software v.5.0 (GraphPad Software, San Diego, CA). The tests are detailed in the supplemental Methods.
Results
Gran-MVs from SS patients display a heterogeneous profile of PGC driven by the uPA/uPAR system
When the MV-PGC of SS patients (n = 34) was compared with that of healthy donors (n = 18), we found no significant difference; however, the range of values in SS patients was much wider than that in normal subjects, with 53% of the SS patients falling outside the normal range (10th to 90th percentile, [0.8-43] vs [1.6-3.6] A405nm × 10−3/min) (Figure 1A). Patients were therefore stratified according to their MV-PGC levels, as having low (<1.5 A405nm × 10−3/min; 30th percentile; L-SS), high (>5 A405nm × 10−3/min; 70th percentile; H-SS), or intermediate (1.5 A405nm × 10−3/min < MV-PGC < 5 A405nm × 10−3/min) capacity. These 2 groups of patients were not different regarding demographics, medication, and source of infection. But H-MV-PGC showed as expected lower severity scores and a better outcome compared with L-MV-PGC (supplemental Table 1). To investigate their cellular origin, MV subpopulations were enumerated by flow cytometry. As expected from our previous work,32 Gran-MVs were significantly increased in H-SS vs L-SS (460 [308-1336] vs 180 [0-360] Gran-MVs/µL; P = .01) (Figure 1B) and moderately correlated with the MV-PGC (r2= 0.34; P = .05) (Table 1), whereas no significant difference was observed for the other subsets. In addition to this quantitative difference in Gran-MVs, we looked for an MV qualitative difference to investigate the molecular basis of this distinct PGC profile. Using flow cytometry, we compared the expression of uPA and its receptor uPAR on Gran-MVs in L-SS and H-SS patients compared with platelet-derived MVs used as negative controls. Gran-MVs from the H-SS patients exhibited higher surface expression of both uPA and uPAR than those from L-SS patients (Figure 1C). Moreover, ELISA measurement of lysed MVs showed higher amounts of uPAR in MVs from H-SS vs L-SS patients (0.56 ± 0.28 vs 0.15 ± 0.05 ng/mL; P < .05) (Figure 1D). However, the total amount of uPA and PAI-1 levels did not differ between the 2 groups (0.09 ± 0.04 vs 0.1 ± 0.07 ng/2 × 106 MVs; P = .8 [Figure 1E]; 6.3 ± 7 vs 8 ± 6.2 ng/2 × 106 MVs; P = .6 [Figure 1F], respectively). It suggests that the higher MV-PGC from H-SS patients is mainly due to a higher level of uPAR which increases the capacity of the MVs to capture uPA released into the local environment.

Gran-MVs from SS patients display a heterogeneous profile of PGC driven by the uPA/uPAR system. (A) The microvesicle-dependent plasmin generation capacity (MV-PGC) of MVs isolated from SS patient platelet-free plasma, with a low MV-PGC (blue circle), an intermediate MV-PGC (green circle), and a high MV-PGC (red circle), compared with the MV-PGC of MVs isolated from healthy donor plasma (n = 18, purple square). Each patient and healthy control were evaluated in duplicate. (B) Counts of Gran-MVs (annV/CD15), P-MVs (annV/CD41), Ery-MVs (annV/CD235a), and E-MVs (annV/CD146) by flow cytometry in PFP from SS patients with low (<1.5 A405nm × 10−3/min, n = 12, blue square) or high (>5 A405nm × 10−3/min, n = 10; red square) MV-PGC values. Data are mean ± SEM. (C) Flow cytometric detection of uPA (upper graphs) and uPAR (lower graphs) on the surface of CD15+ MVs from SS patients with low (L-SS-MV) or high (H-SS-MV) PGC values (yellow traces). The expression of uPA or uPAR on CD41+ platelet-derived MV was used as a negative control (gray traces). (D-F) Detection by ELISA of uPAR, uPA, and PAI-1 on purified total MVs from SS patients (SS-MVs) divided into 2 groups: patients with low (<1.5 A405nm × 10−3/min, n = 11, L-SS-MV, blue circle) and high (>5 A405nm × 10−3/min, n = 11, H-SS-MV, red circle) MV-PGC values. *P < .05. annV: annexin V; NS: not significant.
Gran-MVs from SS patients display a heterogeneous profile of PGC driven by the uPA/uPAR system. (A) The microvesicle-dependent plasmin generation capacity (MV-PGC) of MVs isolated from SS patient platelet-free plasma, with a low MV-PGC (blue circle), an intermediate MV-PGC (green circle), and a high MV-PGC (red circle), compared with the MV-PGC of MVs isolated from healthy donor plasma (n = 18, purple square). Each patient and healthy control were evaluated in duplicate. (B) Counts of Gran-MVs (annV/CD15), P-MVs (annV/CD41), Ery-MVs (annV/CD235a), and E-MVs (annV/CD146) by flow cytometry in PFP from SS patients with low (<1.5 A405nm × 10−3/min, n = 12, blue square) or high (>5 A405nm × 10−3/min, n = 10; red square) MV-PGC values. Data are mean ± SEM. (C) Flow cytometric detection of uPA (upper graphs) and uPAR (lower graphs) on the surface of CD15+ MVs from SS patients with low (L-SS-MV) or high (H-SS-MV) PGC values (yellow traces). The expression of uPA or uPAR on CD41+ platelet-derived MV was used as a negative control (gray traces). (D-F) Detection by ELISA of uPAR, uPA, and PAI-1 on purified total MVs from SS patients (SS-MVs) divided into 2 groups: patients with low (<1.5 A405nm × 10−3/min, n = 11, L-SS-MV, blue circle) and high (>5 A405nm × 10−3/min, n = 11, H-SS-MV, red circle) MV-PGC values. *P < .05. annV: annexin V; NS: not significant.
Correlations between the MV-PGC and MV subsets
| r (Spearman) | P | |
|---|---|---|
| AnnV+ MVs | 0.43 | .01 |
| Gran-MVs (annV/CD15) | 0.34 | .05 |
| P-MVs (annV/CD41) | 0.16 | .5 |
| Ery-MVs (annV/CD235a) | 0.08 | .7 |
| E-MVs (annV/CD146) | 0.03 | .9 |
| r (Spearman) | P | |
|---|---|---|
| AnnV+ MVs | 0.43 | .01 |
| Gran-MVs (annV/CD15) | 0.34 | .05 |
| P-MVs (annV/CD41) | 0.16 | .5 |
| Ery-MVs (annV/CD235a) | 0.08 | .7 |
| E-MVs (annV/CD146) | 0.03 | .9 |
P ≤ .05 was considered a significant nonparametric correlation (Spearman’s correlation).
annV+ MVs, annexin V+ microvesicles; E-MVs, endothelial-derived MVs; Ery-MVs, erythrocyte-derived MVs; Gran-MVs, granulocyte-derived MVs; P-MVs, platelet-derived MVs.
Gran-MVs from SS patients lyse a thrombus according to their MV-PGC level in a uPA/uPAR-dependent manner
To mimic the inflammatory conditions of SS, MVs were generated from human whole blood stimulated with LPS. In a fluorescent clot lysis test, we observed a significant dose- and time-dependent increase in the fluorescence released by LPS-MVs compared with the MV SPN used as a negative control (3520 ± 1540 AU vs 1050 ± 40 AU at 5 × 10⁶ LPS-MVs/24 hours, respectively; P < .05) (Figure 2A). This lysis effect was associated with a 44 ± 7% (P < .05) loss of thrombus weight (Figure 2B). These results were confirmed by those of a lysis front retraction assay (Figure 2C) showing a significant MV-dependent lysed area in the presence of LPS-MVs compared with the MV SPN (63 ± 42% vs 9 ± 4% area of lysis, at 1 × 10⁷ LPS-MV/48 hours; P < .05) (Figure 2C-D). Interestingly, the lytic effect was amplified when uPAR on the MV surface was saturated by the addition of exogenous uPA (uPA-LPS-MV) containing MVs from SS patients with high MV-PGC (Figure 2C-D [upper panel]). Notably, the lytic response was not always complete, and a thin layer of thrombus remained undissolved, as shown by confocal microscopy (supplemental Figure 1). The clot lysis experiments were repeated using the same amount of MVs from SS patients stratified according to their MV-PGC levels. As shown in Figure 2E-F, the retraction of the lysis front was significantly higher in H-SS patients compared with L-SS patients. These data indicate that clot lysis efficiency is driven by the MV-PGC level.
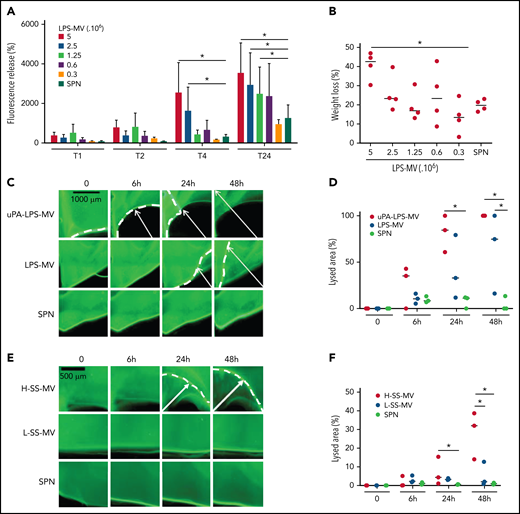
MVs from SS patients lyse a thrombus according to their MV-PGC level. (A-B) MVs purified from blood stimulated with LPS (LPS-MVs) lyse a fluorescent human thrombus suspended in plasma in a dose-dependent manner (5-0.3 × 10⁶ MVs). Thrombolysis was monitored by measuring the fluorescence released in the thrombus supernatant at 1, 2, 4, and 24 hours (A) and the loss of thrombus weight after 48 hours (B). The results are expressed as the percentage of fluorescence increase and weight loss compared with their initial values at 0 (n = 5). (C-D) Thrombolysis mediated by LPS-MVs (107 MVs) in a lysis front retraction model. Lysis is amplified by the saturation of uPAR with exogenous uPA (uPA-LPS-MVs) on the MV surface. Representative fluorescence microscopy images (C) display the retraction of the lysis front (white arrows) at 0, 6h, 24h, and 48 hours; black bar = 1000 µm. The lysis area (D) was calculated considering the whole thrombus surface (4.3 mm2) using ImageJ software. uPA-LPS-MV: red circle; LPS-MV: blue circle; and SPN: green circle. (E-F) Thrombolysis mediated by MVs from SS patients in a lysis front retraction model. Representative fluorescence microscopy images (E) display thrombolysis in the presence of SS-MVs (2 × 10⁷ MVs) purified from a pool of SS patients with low (<1.5 A405nm × 10−3/min, L-SS-MV: blue circle) or high (>5 A405nm × 10−3/min, H-SS-MV: red circle) MV-PGC; n = 3. For each experiment, the negative control was represented by the last MV wash supernatant (SPN: green circle). Black bar = 500 µm. The lysis area (F) was calculated considering the whole thrombus surface (4.3 mm2) using ImageJ software. Low-SS-PGC: blue circle; high-SS-PGC: red circle; and SPN: green circle. *P < .05
MVs from SS patients lyse a thrombus according to their MV-PGC level. (A-B) MVs purified from blood stimulated with LPS (LPS-MVs) lyse a fluorescent human thrombus suspended in plasma in a dose-dependent manner (5-0.3 × 10⁶ MVs). Thrombolysis was monitored by measuring the fluorescence released in the thrombus supernatant at 1, 2, 4, and 24 hours (A) and the loss of thrombus weight after 48 hours (B). The results are expressed as the percentage of fluorescence increase and weight loss compared with their initial values at 0 (n = 5). (C-D) Thrombolysis mediated by LPS-MVs (107 MVs) in a lysis front retraction model. Lysis is amplified by the saturation of uPAR with exogenous uPA (uPA-LPS-MVs) on the MV surface. Representative fluorescence microscopy images (C) display the retraction of the lysis front (white arrows) at 0, 6h, 24h, and 48 hours; black bar = 1000 µm. The lysis area (D) was calculated considering the whole thrombus surface (4.3 mm2) using ImageJ software. uPA-LPS-MV: red circle; LPS-MV: blue circle; and SPN: green circle. (E-F) Thrombolysis mediated by MVs from SS patients in a lysis front retraction model. Representative fluorescence microscopy images (E) display thrombolysis in the presence of SS-MVs (2 × 10⁷ MVs) purified from a pool of SS patients with low (<1.5 A405nm × 10−3/min, L-SS-MV: blue circle) or high (>5 A405nm × 10−3/min, H-SS-MV: red circle) MV-PGC; n = 3. For each experiment, the negative control was represented by the last MV wash supernatant (SPN: green circle). Black bar = 500 µm. The lysis area (F) was calculated considering the whole thrombus surface (4.3 mm2) using ImageJ software. Low-SS-PGC: blue circle; high-SS-PGC: red circle; and SPN: green circle. *P < .05
To confirm the molecular partners responsible for this heterogeneous thrombolytic effect, lysis front retraction experiments were conducted with specific inhibitors. As illustrated in Figure 3A-B, thrombolysis was significantly reduced in the presence of α2-antiplasmin or an anti-uPA antibody. The involvement of uPAR in this MV thrombolytic effect was assessed using LPS-MVs treated with phosphatidylinositol-specific phospholipase C (PI-PLC). Under these conditions, the MV-PGC and lysis area were dramatically reduced (Figure 3C-E). Finally, the cellular origin of the subset of MV involved in the fibrinolytic effect was identified by showing that the depletion of CD15+MVs monitored by flow cytometry (Figure 4A) was associated with a decrease of more than 90% in both MV-PGC capacity and lysis front retraction (Figure 4B-D), whereas the depletion of erythrocyte and platelet subsets had no effect. The fibrinolytic effect of Gran-MVs was confirmed by a significantly larger lysed area compared with SPN (10 ± 4% vs 4 ± 2% area of lysis, at 5 × 10⁶ Gran-MV/48 hours; P < .05) (Figure 4E-F). Additionally, the lytic effect was observed with uPA-Gran-MVs (Gran-MVs with uPAR saturated by exogenous uPA) as early as 24 hours and amplified at 48 hours (Figure 4E-F). The absence of residual soluble uPA was confirmed by ELISA (supplemental Figure 2). Altogether, these data identify Gran-MVs as the MV subset that mediates the thrombolytic capacity driven by the uPA/uPAR system.
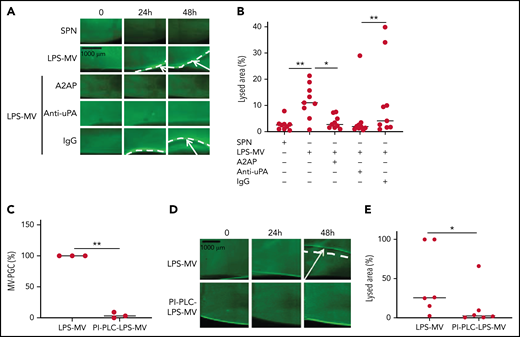
MVs lyse a thrombus in a uPA/uPAR-dependent manner. (A-B) Lysis front retraction experiments were performed with MVs purified from blood and stimulated with LPS (LPS-MVs, 2 × 10⁷) in the presence or absence of α2-antiplasmin (A2AP) at 0.5 µM, an inhibitory anti-uPA antibody at 50 µg/mL and isotype control (IgG) at 50 µg/mL; n = 9. Representative images for each time point (0, 24h, and 48 hours) are displayed in (A); black bar = 1000 µm. The lysis area was calculated at 48 hours, considering the entire thrombus surface (4.3 mm2) using ImageJ software (B). The negative control was represented by the SPN. (C-E) LPS-MVs were treated with phosphatidylinositol-specific phospholipase C (PI-PLC; 2 IU/mL). (C) The MV-PGC of the PI-PLC-treated LPS-MVs (PI-PLC-LPS-MVs) was compared with that of the untreated LPS-MVs (2.5 × 10⁶ MVs). (D) The thrombolytic effect of both types of LPS-MVs was evaluated in the lysis front retraction model at 0, 24h, and 48 hours in the presence of 107 MVs. (E) The lysis area was calculated at 48 hours, considering the entire thrombus surface (4.3 mm2), using ImageJ software; n = 6. *P < .05; **P<.01.
MVs lyse a thrombus in a uPA/uPAR-dependent manner. (A-B) Lysis front retraction experiments were performed with MVs purified from blood and stimulated with LPS (LPS-MVs, 2 × 10⁷) in the presence or absence of α2-antiplasmin (A2AP) at 0.5 µM, an inhibitory anti-uPA antibody at 50 µg/mL and isotype control (IgG) at 50 µg/mL; n = 9. Representative images for each time point (0, 24h, and 48 hours) are displayed in (A); black bar = 1000 µm. The lysis area was calculated at 48 hours, considering the entire thrombus surface (4.3 mm2) using ImageJ software (B). The negative control was represented by the SPN. (C-E) LPS-MVs were treated with phosphatidylinositol-specific phospholipase C (PI-PLC; 2 IU/mL). (C) The MV-PGC of the PI-PLC-treated LPS-MVs (PI-PLC-LPS-MVs) was compared with that of the untreated LPS-MVs (2.5 × 10⁶ MVs). (D) The thrombolytic effect of both types of LPS-MVs was evaluated in the lysis front retraction model at 0, 24h, and 48 hours in the presence of 107 MVs. (E) The lysis area was calculated at 48 hours, considering the entire thrombus surface (4.3 mm2), using ImageJ software; n = 6. *P < .05; **P<.01.
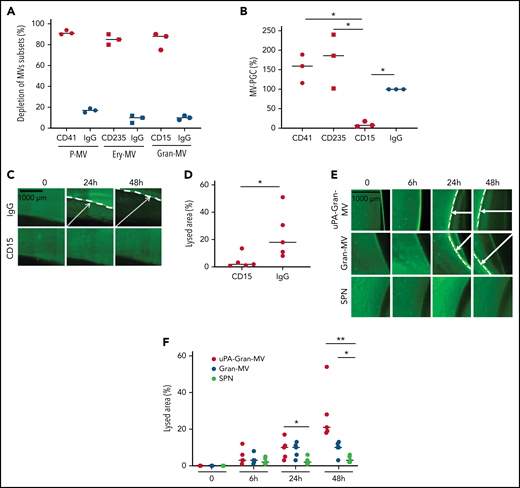
Gran-MVs are the MV subset that mediates the thrombolytic activity. (A) Flow cytometric monitoring of MVs after selective depletion of MV subsets: platelet-derived MVs (P-MVs), erythrocyte-derived MVs (ery-MVs), and granulocyte-derived MVs (Gran-MVs). Immunomagnetic separation was performed using beads coated either with CD41 (red circle), CD235a (red square), or CD15 (red rhombus). Negative control experiments were performed in parallel using beads coated with an irrelevant antibody (IgG, blue symbols); n = 3. (B) The MV-PGC test was performed on MVs after the selective depletion of CD41+, CD235a+, or CD15+ MV subpopulations or after a control IMS (IgG); n = 3, CD41: red circle; CD235a: red square; CD15: red rhombus; IgG: blue circle. (C) The thrombolytic effect of MVs depleted of CD15-MVs or those subjected to a control IMS depletion (IgG) was evaluated in the lysis front retraction model at 0, 24h, and 48 hours in the presence of 107 MVs. (D) The lysis area was calculated at 48 hours, considering the entire thrombus surface (4.3 mm2), using ImageJ software. *P < .05; **P < .01. (E-F) Thrombolysis mediated by Gran-MVs (5 × 10⁶ MVs) in a lysis front retraction model. Lysis is amplified by the saturation of uPAR with exogenous uPA (uPA-Gran-MVs) on the MV surface. Representative fluorescence microscopy images (E) display the retraction of the lysis front (white arrows) at 0, 6, 24h, and 48 hours; black bar = 1000 µm. The lysis area (F) was calculated considering the whole thrombus surface (150 mm2) using ImageJ software; uPA-Gran-MV: red circle; Gran-MV: blue circle; SPN: green circle; n = 5. *P < .05; **P<.01
Gran-MVs are the MV subset that mediates the thrombolytic activity. (A) Flow cytometric monitoring of MVs after selective depletion of MV subsets: platelet-derived MVs (P-MVs), erythrocyte-derived MVs (ery-MVs), and granulocyte-derived MVs (Gran-MVs). Immunomagnetic separation was performed using beads coated either with CD41 (red circle), CD235a (red square), or CD15 (red rhombus). Negative control experiments were performed in parallel using beads coated with an irrelevant antibody (IgG, blue symbols); n = 3. (B) The MV-PGC test was performed on MVs after the selective depletion of CD41+, CD235a+, or CD15+ MV subpopulations or after a control IMS (IgG); n = 3, CD41: red circle; CD235a: red square; CD15: red rhombus; IgG: blue circle. (C) The thrombolytic effect of MVs depleted of CD15-MVs or those subjected to a control IMS depletion (IgG) was evaluated in the lysis front retraction model at 0, 24h, and 48 hours in the presence of 107 MVs. (D) The lysis area was calculated at 48 hours, considering the entire thrombus surface (4.3 mm2), using ImageJ software. *P < .05; **P < .01. (E-F) Thrombolysis mediated by Gran-MVs (5 × 10⁶ MVs) in a lysis front retraction model. Lysis is amplified by the saturation of uPAR with exogenous uPA (uPA-Gran-MVs) on the MV surface. Representative fluorescence microscopy images (E) display the retraction of the lysis front (white arrows) at 0, 6, 24h, and 48 hours; black bar = 1000 µm. The lysis area (F) was calculated considering the whole thrombus surface (150 mm2) using ImageJ software; uPA-Gran-MV: red circle; Gran-MV: blue circle; SPN: green circle; n = 5. *P < .05; **P<.01
Fibrinolytic activators carried by MVs significantly contribute to the plasma fibrinolytic capacity of SS patients
To assess the relevance of the fibrinolytic mechanism driven by MVs, we compared the relative contributions of MV- and non-MV-derived plasma fibrinolytic capacity using a euglobulin clot lysis assay41 to reduce the concentration of fibrinolysis inhibitors (supplemental Figure 3A). We first found that most (90 ± 1.9%) of the Gran-MVs previously labeled with CD15+ and annexin V-specific antibodies coprecipitated with fibrinolysis activators (supplemental Figure 3B). Then, we used the euglobulin test with PFP and MV-free PFP from SS patients with high and low MV-PGC and healthy donors, and we tested the activator fraction for its plasmin activity or for its capacity to lyse a thrombus in vitro. In healthy subjects, we did not observe any significant difference in either the PGC or the time to 50% lysis between the PFP and the MV-free PFP (supplemental Figure 3C-D). In contrast, in H-SS patients, when MVs were removed from plasma, we measured a significant decrease in the PGC (−35 ± 37%; P = .048) (supplemental Figure 3E) and a significant increase in the time to 50% lysis (+25 ± 15%; P = .003) (supplemental Figure 3F). Interestingly, these data are not observed in SS patients with low MV-PGC (supplemental Figure 3G-H). These results indicate that in SS patients with high MV-PGC, fibrinolytic activators carried by MVs contribute to approximately 30% of the plasma fibrinolytic activity.
Injection of MVs with a high level of PGC improves survival and reduces clot formation in a murine model of sepsis
To investigate whether the fibrinolytic potential of MVs is protective in vivo, we used a murine sepsis model42 with a daily IV caudal injection (D1 to D4) of uPA-Gran-MVs, Gran-MVs derived from granulocytes of human healthy donors or the SPN of the uPA-Gran-MVs (SPN uPA-Gran-MVs) as a negative control (Figure 5A). The MV-PGC values were 4 ± 6 and 1 ± 1 A405nm × 10−3/min for uPA-Gran-MVs and Gran-MVs, corresponding to the capacity of H-SS and L-SS patients, respectively. The severity of sepsis was similar between the groups before the first injection, as shown by similar temperature variations (Figure 5B) and clinical scores (Figure 5C). The plasmin generation capacity of uPA-Gran-MVs was significantly higher than that of Gran-MVs (7.9 ± 0.6 vs 1.9 ± 0.2 A405nm × 10−3/min, respectively; P = .0008) and predominant compared with the procoagulant activity, which could be considered negligible (MV-TF = 14.7 ± 6.5 fM) by reference to the procoagulant activity of Mono-MVs (MV-TF = 353 ± 311 fM) (Figure 5D). Consequently, the injection of uPA-Gran-MVs compared with Gran-MVs or SPN uPA-Gran-MVs significantly improved the survival rate of SS mice at D5 (92% vs 50% and 58%, respectively; Gehan-Breslow-Wilcoxon test P = .05 and P = .02, respectively) (Figure 5E). Moreover, fibrin clot staining revealed a significant reduction in the number of thrombi in the kidneys of mice injected with uPA-Gran-MVs compared with the 2 other types (3.7 ± 0.9 vs 7.7 ± 1.9 thrombi/2.4 mm2; P = .001; and 6.9 ± 2.5 thrombi/2.4 mm2; P = .015, respectively) (Figure 5Fa-b). This observation was confirmed in lung tissues (Figure 5Fc-d). Complementary experiments using fibrin/fibrinogen immunolabeling (supplemental Figure 4) confirmed that the fibrin-positive areas (supplemental Figure 4A) are superimposed with the lacquered blue stained areas with PTAH (supplemental Figure 4B) and demonstrates that the material in the vessels contains fibrins.
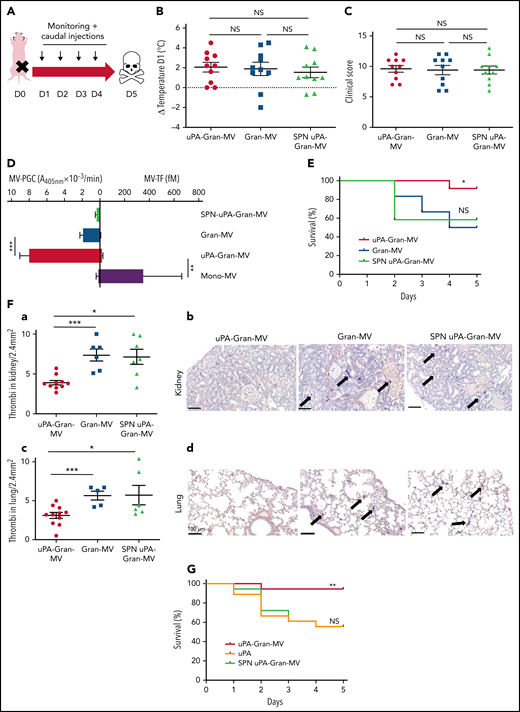
Injection of MVs with a high level of PGC improves survival and reduces clot formation in a murine model of sepsis. (A) Cecal ligation was performed on CD-1 mice (n = 36 animals). Each group of animals received a daily IV tail injection (D1 to D4) of uPA-Gran-MVs or Gran-MVs or SPN uPA-Gran-MVs from D1 (24 hours after surgery). Once sepsis was established, mice were observed daily to assess spontaneous mortality and monitored to measure their heart rate, oxygen saturation, breathing rate, and body temperature. The animals were sacrificed at D5. (B-C) Temperature amplitude at D1 (°C) and the clinical score of 3 groups of animals injected with uPA-Gran-MVs (red circle), Gran-MVs (blue square), or SPN uPA-Gran-MVs (green triangle) (n = 12 animals per group). Data are mean ± SEM. (D) Coagulolytic balance (MV-PGC and MV-TF) of uPA-Gran-MVs (107) (red), Gran-MVs (107) (blue), supernatant (SPN-uPA-Gran-MVs) (green), and Mono-MVs (107) (purple); n = 3. (E) Survival curve of animals (n = 12 in each group). The results are presented as the percent survival. (Fa,c) Count of microthrombi in kidney and lung tissues after hematoxylin-eosin and phosphotungstic acid-hematoxylin staining (PTAH; uPA-Gran-MVs n = 10, red circle; Gran-MVs n = 6, blue square; SPN uPA-Gran-MVs n = 7, green triangle). Data are mean ± SEM. (Fb,d) Histopathology of lung and kidney tissue samples from different groups of mice. Injected with uPA-Gran-MVs (n = 11); injected with Gran-MVs (n = 6); control group injected with SPN uPA-Gran-MVs (n = 6). Microthrombi are indicated by black arrows; black bar = 100 µm. (G) Survival curve of animals injected in uPA-Gran-MVs (107) (red), soluble uPA (orange), or SPN-uPA-Gran-MVs (green) (n = 12 in each group). The results are presented as the percent survival. *P < .05; **P < .01; ***P < .001; NS: not significant.
Injection of MVs with a high level of PGC improves survival and reduces clot formation in a murine model of sepsis. (A) Cecal ligation was performed on CD-1 mice (n = 36 animals). Each group of animals received a daily IV tail injection (D1 to D4) of uPA-Gran-MVs or Gran-MVs or SPN uPA-Gran-MVs from D1 (24 hours after surgery). Once sepsis was established, mice were observed daily to assess spontaneous mortality and monitored to measure their heart rate, oxygen saturation, breathing rate, and body temperature. The animals were sacrificed at D5. (B-C) Temperature amplitude at D1 (°C) and the clinical score of 3 groups of animals injected with uPA-Gran-MVs (red circle), Gran-MVs (blue square), or SPN uPA-Gran-MVs (green triangle) (n = 12 animals per group). Data are mean ± SEM. (D) Coagulolytic balance (MV-PGC and MV-TF) of uPA-Gran-MVs (107) (red), Gran-MVs (107) (blue), supernatant (SPN-uPA-Gran-MVs) (green), and Mono-MVs (107) (purple); n = 3. (E) Survival curve of animals (n = 12 in each group). The results are presented as the percent survival. (Fa,c) Count of microthrombi in kidney and lung tissues after hematoxylin-eosin and phosphotungstic acid-hematoxylin staining (PTAH; uPA-Gran-MVs n = 10, red circle; Gran-MVs n = 6, blue square; SPN uPA-Gran-MVs n = 7, green triangle). Data are mean ± SEM. (Fb,d) Histopathology of lung and kidney tissue samples from different groups of mice. Injected with uPA-Gran-MVs (n = 11); injected with Gran-MVs (n = 6); control group injected with SPN uPA-Gran-MVs (n = 6). Microthrombi are indicated by black arrows; black bar = 100 µm. (G) Survival curve of animals injected in uPA-Gran-MVs (107) (red), soluble uPA (orange), or SPN-uPA-Gran-MVs (green) (n = 12 in each group). The results are presented as the percent survival. *P < .05; **P < .01; ***P < .001; NS: not significant.
The measurement of plasmatic parameters in surviving mice, including AST, ALT, creatinine, and LDH, did not show a significant difference between the 3 groups of mice. The survival benefit is maintained at D10 with no additional death with or without MVs injection between D5 and D10. The injection of 3 different levels of uPA-Gran-MVs (5, 10, 20 × 106) for 5 days showed no significant difference between the groups. These data indicated that a daily 5 × 10⁶ dose is sufficient to observe a survival benefit after injection of fibrinolytic MVs with no additional benefit from higher doses. Taken together, these data show that the elevated PGC of Gran-MVs improves survival sustainably and reduces the number of thrombi in the vital organs in a mouse sepsis model. Interestingly, the survival benefit was not observed when an equivalent amount (25 pg) of soluble uPA was injected for 5 days compared with the injection of uPA-Gran-MVs, indicating that conveying uPA by MVs is essential for the protective effect of uPA in sepsis (Figure 5G). To better understand the protection afforded to septic mice injected with uPA-Gran-MVs, we measured the impact of the MV injection on the mouse hemostatic balance (Figure 6A). As illustrated in Figure 6Bb, we observed a significant increase in PAP at D2 in the group injected with uPA-Gran-MVs compared with the other groups (124 ± 24 ng/mL vs 55 ± 27 ng/mL; P = .034; and 51.5 ± 25.8 ng/mL; P = .036). This was followed by a lesser decrease in MV-PGC at D5 in this group, compared with the groups injected with Gran-MVs and SPN uPA-Gran-MVs (5.9 ± 0.6 vs 3.2 ± 0.5; P = .0016; and 3.4 ± 0.4 A405nm × 10−3/min; P = .0016, respectively) (Figure 6Cc). On the other hand, the injection of MVs did not significantly modify the mouse procoagulant activity. Indeed, as illustrated in Figure 6D-E, thrombin-anti-thrombin complex (TAT) and MV-TF levels were not different between the septic mice at D1 and D3 but were increased compared with nonseptic mice (control). Interestingly, the D-dimers normalized at D5 only in the uPA-Gran-MV group (Figure 6F). Altogether, these data indicate that the injection of fibrinolytic MVs (uPA-Gran-MVs) modified the hemostatic balance of mice toward a more fibrinolytic profile.
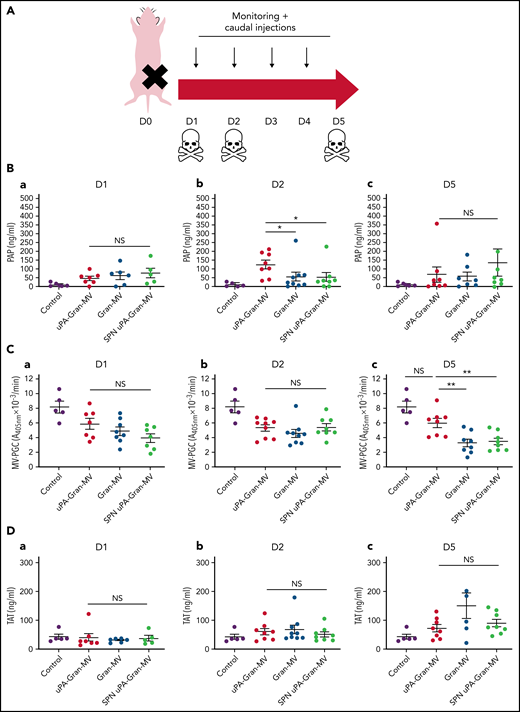
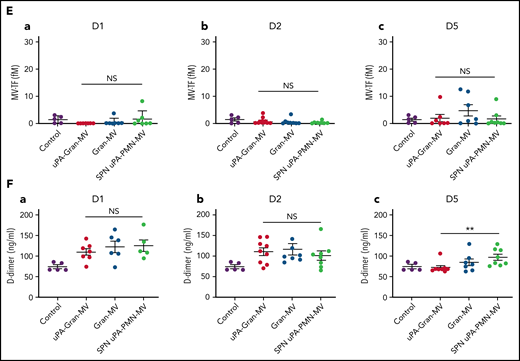
Impact of the MV injection on the mouse hemostatic balance. (A) Cecal ligation was performed on CD-1 mice on 3 kinetic, D1: 24 hours after sepsis induction; D2: 48 hours after sepsis induction; D5: 5 days after sepsis induction; n = 36 per group. Each group of animals received a daily IV tail injection of uPA-Gran-MVs (red), Gran-MVs (blue), or SPN uPA-Gran-MVs (green) from D1 (24 hours after surgery) and compared to a group of healthy mice (control) (purple). Once sepsis was established, the mice were observed daily to assess spontaneous mortality and monitored to measure their heart rate, oxygen saturation, breathing rate, and body temperature. In according to the kinetic, the animals were sacrificed at D1, D2, or D5. (B-F) Measure of fibrinolytic and procoagulant parameters at D1, D2, and D5: plasmin-anti-plasmin complex (PAP), MV dependent plasmin generation capacity (MV-PGC), thrombin-anti-thrombin complex (TAT), MV dependent tissue factor activity (MV-TF), and d-dimer, respectively. Data are mean ± SEM. *P < .05; **P < .01; NS: not significant.
Impact of the MV injection on the mouse hemostatic balance. (A) Cecal ligation was performed on CD-1 mice on 3 kinetic, D1: 24 hours after sepsis induction; D2: 48 hours after sepsis induction; D5: 5 days after sepsis induction; n = 36 per group. Each group of animals received a daily IV tail injection of uPA-Gran-MVs (red), Gran-MVs (blue), or SPN uPA-Gran-MVs (green) from D1 (24 hours after surgery) and compared to a group of healthy mice (control) (purple). Once sepsis was established, the mice were observed daily to assess spontaneous mortality and monitored to measure their heart rate, oxygen saturation, breathing rate, and body temperature. In according to the kinetic, the animals were sacrificed at D1, D2, or D5. (B-F) Measure of fibrinolytic and procoagulant parameters at D1, D2, and D5: plasmin-anti-plasmin complex (PAP), MV dependent plasmin generation capacity (MV-PGC), thrombin-anti-thrombin complex (TAT), MV dependent tissue factor activity (MV-TF), and d-dimer, respectively. Data are mean ± SEM. *P < .05; **P < .01; NS: not significant.
Soluble molecules from SS patient plasma modulate Gran-MV plasmin generation capacity in SS
To better understand how the plasma environment can modulate Gran-MV PGC capacity, we investigated the potential role of the surrounding plasma factors. To this end, we performed incubation assays using granulocytes from healthy donors and plasma (depleted or not of MVs) from L-SS and H-SS patients (Figure 7A). MVs generated by granulocytes were called “Gran-induced MVs” (Gran-iMVs). We observed that the quantities of Gran-iMVs were not significantly different between the L-SS and H-SS patients. In contrast, the Gran-iMV-PGC was significantly increased by stimulation with plasma from H-SS patients compared with plasma from L-SS patients (1.36 ± 0.84 vs 0.85 ± 0.60 A405nm × 10−3/min, for 4 × 10⁵ Gran-iMV; P = .02) (Figure 7B). Interestingly, this result remained similar when the stimulation was performed with MV-free plasma (Figure 7C), suggesting the presence of soluble factors triggering distinct MV-PGC profiles in patients.

Soluble molecules from SS patient plasma modulate Gran-MV plasmin generation capacity in SS. (A) Granulocytes (Gran) were purified from healthy individuals and then incubated with complete or MV-depleted plasma (PFP or MVFP) from SS patients with low (L-SS) or high (H-SS) plasmin capacity. Then, “Gran-induced MVs” (Gran-iMVs) were purified by ultracentrifugation and quantified by flow cytometry, and plasmin generation capacity was measured. (B) MV-PGC of Gran-iMVs (4 × 10⁵) after stimulation with PFP from selected SS patients with low (<1.5 A405nm × 10−3/min, n = 11, L) (blue) or high (>5 A405nm × 10−3/min, n = 10, H) (red). (C) MV-PGC of Gran-iMVs (4 × 10⁵) after stimulation with MVFP from selected SS patients with low (<1.5 A405nm × 10−3/min, n = 11, L) (blue) or high (>5 A405nm × 10−3/min, n = 10, H) (red). (D) MV-PGC of Gran-iMVs (4 × 10⁵) after stimulation with MV-depleted plasma from SS plasma treated with a human neutrophil elastase (NE) blocking antibody or isotype control (n = 11). (E) MV-PGC of Gran-iMVs (4 × 10⁵) after stimulation with MV-depleted plasma enriched with NE (at a concentration range of 0.008-0.3 nM), from selected L-SS patient MV-PGC values (n = 11). Data are mean ± SEM. (F) PGC of MVs extract with CD15 immunomagnetic beads (IMS-MV-PGC) from LPS-treated blood spiked with a range of NE concentrations (0.008-0.3 nM; n = 4). Data are mean ± SEM. (G) Effect of a range of NE concentrations (0.008-0.3 nM) on the uPA/PAI-1 complex (95 kDa and 110 kDa) by zymography (n = 3; lytic zone in percent, image digitally inverted). Data are mean ± SEM. (H) Effect of a range of NE concentrations (0.008-0.3 nM) in the presence of PAI-1 (440 ng/mL) on the MV-PGC of purified Gran-MVs (2 × 10⁶; n = 6). Data are mean ± SEM. *P < .05; **P < .01.
Soluble molecules from SS patient plasma modulate Gran-MV plasmin generation capacity in SS. (A) Granulocytes (Gran) were purified from healthy individuals and then incubated with complete or MV-depleted plasma (PFP or MVFP) from SS patients with low (L-SS) or high (H-SS) plasmin capacity. Then, “Gran-induced MVs” (Gran-iMVs) were purified by ultracentrifugation and quantified by flow cytometry, and plasmin generation capacity was measured. (B) MV-PGC of Gran-iMVs (4 × 10⁵) after stimulation with PFP from selected SS patients with low (<1.5 A405nm × 10−3/min, n = 11, L) (blue) or high (>5 A405nm × 10−3/min, n = 10, H) (red). (C) MV-PGC of Gran-iMVs (4 × 10⁵) after stimulation with MVFP from selected SS patients with low (<1.5 A405nm × 10−3/min, n = 11, L) (blue) or high (>5 A405nm × 10−3/min, n = 10, H) (red). (D) MV-PGC of Gran-iMVs (4 × 10⁵) after stimulation with MV-depleted plasma from SS plasma treated with a human neutrophil elastase (NE) blocking antibody or isotype control (n = 11). (E) MV-PGC of Gran-iMVs (4 × 10⁵) after stimulation with MV-depleted plasma enriched with NE (at a concentration range of 0.008-0.3 nM), from selected L-SS patient MV-PGC values (n = 11). Data are mean ± SEM. (F) PGC of MVs extract with CD15 immunomagnetic beads (IMS-MV-PGC) from LPS-treated blood spiked with a range of NE concentrations (0.008-0.3 nM; n = 4). Data are mean ± SEM. (G) Effect of a range of NE concentrations (0.008-0.3 nM) on the uPA/PAI-1 complex (95 kDa and 110 kDa) by zymography (n = 3; lytic zone in percent, image digitally inverted). Data are mean ± SEM. (H) Effect of a range of NE concentrations (0.008-0.3 nM) in the presence of PAI-1 (440 ng/mL) on the MV-PGC of purified Gran-MVs (2 × 10⁶; n = 6). Data are mean ± SEM. *P < .05; **P < .01.
To identify these factors, SS plasma was screened by a multiplex array for 23 different molecules known to modulate the uPA/uPAR system (supplemental Table 2). A correlation analysis identified that among these factors, human neutrophil elastase (NE), CD40L, PDGF-AB/BB, and TGF-α were the ones most associated with the Gran-iMV-PGC (r2= 0.6, 0.56, 0.48, and 0.46, respectively) (Table 2; supplemental Figure 5). When granulocytes were directly incubated with these factors, no significant difference in the Gran-iMV-PGC was observed with CD40L, PDGF-AB/BB, and TGF-α. In contrast, the effect of NE was demonstrated first by a significant decrease in the MV-PGC by blocking NE with the addition of a specific inhibitory antibody to the plasma (Figure 7D) and second by a significant increase in the Gran-iMV-PGC after the supplementation of L-SS plasma with 0.3 nM NE (no increase was found in the H-SS plasma; +101%; P = .02) (Figure 7E). Altogether, these data identify NE as an MV-PGC modulator present in the plasma of SS patients.
Correlations between the MV-PGC and SS patient plasma inflammatory molecule concentrations
| Soluble molecule | r (Spearman) | P |
|---|---|---|
| Elastase | 0.6 | .005 |
| sCD40L | 0.56 | .01 |
| PDGF-AB/BB | 0.48 | .03 |
| TGF-α | 0.46 | .04 |
| TSP-1 | 0.28 | .23 |
| FGF-2 | 0.21 | .37 |
| IL-10 | 0.17 | .48 |
| Resistin | 0.15 | .53 |
| TNF-α | 0.1 | .66 |
| IL-8 | −0.04 | .84 |
| G-CSF | 0.03 | .88 |
| IL-6 | 0.03 | .91 |
P ≤ .05 was considered a significant nonparametric correlation (Spearman’s correlation). Only significant correlations were included in the table.
To further decipher the role of NE, we measured the impact of a range of NE concentrations on the PGC of Gran-MVs isolated from the plasma of LPS-treated blood by CD15-IMS. As shown in Figure 7F, NE concentrations of 0.04 nM and above significantly increased the MV-PGC. Because neither direct cleavage of the plasmin substrate nor direct plasminogen activation by NE was observed,32 these data demonstrate that NE indirectly acts on the MV-PGC. Because PAI-1 is a known target of NE,43,44 we hypothesized that the MV-PGC might be regulated by NE in a PAI-1-dependent manner. First zymography confirmed (Figure 7G) that the uPA/PAI-1 complex was significantly reduced in the presence of NE without any impact on the uPA bands (supplemental Figure 6). Second, if Gran-MVs incubated with PAI-1 in the absence or presence of NE, we observed a significant decrease in the MV-PGC after incubation with PAI-1, which was partially restored by the presence of 0.3 nM NE (Figure 7H). Collectively, these data demonstrate that NE is one of the components of the plasma environment of SS patients which modulates the Gran-MV-PGC in a PAI-1-dependent manner.
Discussion
In this study, we demonstrate that MVs from SS patients display a heterogeneous pattern of PGC driven by the uPA/uPAR system carried by MVs of granulocytic origin. Interestingly, Gran-MVs with a high PGC reduce clot formation via a mechanism involving elastase and improve survival in a mouse model of SS. These data demonstrate that high MV-PGC levels confer to MV a fibrinolytic protective response that may counterbalance the procoagulant state associated with SS.
As described in the literature, MV-dependent hemostatic activities (their procoagulant and fibrinolytic activities) can be modulated depending on the stimuli triggering their formation and cellular origin.45,46 Converging animal and clinical studies have emphasized the deleterious role procoagulant MVs play in sepsis and SS,15,24,47-50 whereas a series of unexpected observations indicate a potential beneficial effect of selected MV subpopulations.25,27,28,51-55 Accordingly, in severe sepsis, in some studies, elevated levels of Gran-MVs were found to be associated with a more favorable outcome, as shown by reduced mortality rates and organ dysfunction.27,52 Consistent with these data, in patients with acute respiratory distress syndrome, Gran-MVs were the unique subset whose level in bronchoalveolar lavages was associated with an improved prognosis.25 In a mouse sepsis model, Gran-MVs enriched in α2-macroglobulin were shown to improve the resolution of infection by enhancing bacterial clearance.27 Moreover, the dissemination of anti-inflammatory or antibacterial molecules such as TGFβ, annexin-1, or endothelial protein C receptor by Gran-MVs has also been reported.28,51,53-55 In the present work, we propose a new protective mechanism based on MV-associated high fibrinolytic capacity driven by the uPA/uPAR system through which Gran-MVs from SS patients impact survival in a mouse model of sepsis and reduce thrombus formation both in vitro and in vivo.
In SS, fibrinolysis is classically described as being dramatically impaired, thus leading to a procoagulant state responsible for widespread fibrin deposition.3 In fact, this inhibition is heterogeneous among patients according to the levels of PAI-156 and the levels of cell- or MV-PGC.32 However, whether this capacity is indirectly associated with survival or may be a significant contributor to a rescue mechanism is unknown. Here, we identified the uPA/uPAR system as the key plasminogen activator involved in this mechanism. The critical involvement of uPAR was demonstrated by the suppression of the fibrinolytic effect when uPAR was enzymatically removed from the MV surface and its enhancement when uPAR was saturated with exogenous uPA. To our knowledge, apart from matrix metalloproteinase (MMP)-17 and MMP-25, uPAR is the only GPI-anchored protein described to be involved in the fibrinolysis system.57,58 Because of their substrate profiles, MMP-17 and MMP-25 are unlikely to be involved in the MV-PGC. In addition, we found that circulating Gran-MVs contribute to the plasma fibrinolysis in H-SS patients by carrying a significant proportion of the fibrinolysis activators in addition to their soluble fraction, in contrast to L-SS patients or healthy donors. Based on these results, we propose a protective mechanism that may counterbalance the procoagulant state associated with sepsis by contributing to the removal of microthrombi. This hypothesis is supported by our results in the murine SS model, where the injection of Gran-MVs enriched with uPA was associated with a more fibrinolytic profile (increase PAP and MV-PGC), without inducing a change of MV-TF that is considered as a risk factor of thrombus formation in TAT that reflects the activation of the coagulation cascade. More importantly, these hemostatic changes were associated with decreased thrombus formation in vital organs and increased mouse survival. The absence of a beneficial effect from soluble uPA compared with uPA vectorized by MVs may reflect better protection against physiological inhibitors or better targeting of thrombi when uPA is associated with the vesicular membrane.
These data identify granulocytes or, more specifically, neutrophils as the key actors in this protective mechanism because they are the source of both the fibrinolytic MVs and the NE. This mechanism remains to be demonstrated in vivo. In sepsis, neutrophils are considered to play a paradoxical role, both protective and deleterious. By facilitating the recognition, entrapment, and disposal of pathogens, neutrophils protect the host without inducing major collateral damage, as long as they function properly. However, when these reactions occur systemically and are sustained for a long period, they can lead to DIC followed by multiorgan failure and even death.59,60 Through the formation of neutrophil extracellular traps and their components (DNA, histones, and granules), neutrophils can propagate prothrombotic effects.61,62 However, in subsequent stages, neutrophils seem to restrict thrombus growth by releasing fibrinolytic proteases such as NE.63,64 The release of fibrinolytic MVs by granulocytes in SS patients may therefore represent an additional regulatory mechanism contributing to the maintenance of a vascular hemostasis equilibrium favorable to organ perfusion.
A similar duality can be seen for NE. Following bacterial infection, the recruitment of vast numbers of neutrophils is associated with the extracellular release of NE, which is recognized as a key factor in the granulocyte anti-infection arsenal. Indeed, the absence of NE in mouse models of sepsis worsens the prognosis.65,66 However, at the same time, NE propagates persistent neutrophilic inflammation by accelerating proinflammatory cytokine production, encouraging the development of anti-NE inhibitors as a therapeutic strategy in sepsis.67-69 Similarly, NE generated by activated neutrophils may contribute to thrombus formation via inactivation of TFPI.61 However, this procoagulant activity is balanced by other studies showing that cleavage of active PAI-1 by NE also supports a fibrinolytic activity,43 which is in agreement with the ex vivo observations of the present work.
Our data illustrate that heterogeneous populations of Gran-MVs can be generated in response to distinct inducers of vesiculation. As illustrated in the present study, we identified NE as an inducer able to promote the formation of Gran-MVs with a high MV-PGC. Additionally, we showed that the fibrinolytic and procoagulant activities are modulated depending on the inducers triggering MVs derived from a myelocyte cell line (HL-60) (supplemental Figure 7). In agreement, other studies in the literature have provided evidence that different stimuli induced granulocytes to release MVs with different biological properties. Accordingly, neutrophilic granulocytes stimulated with opsonized particles produced MVs that are able to impair bacterial growth.54 More recently, using a set of 14 distinct inducers, neutrophils were found to generate different subtypes of extracellular vesicles: neutrophil-derived trails (NDTRs) generated by neutrophils migrating toward inflammatory foci, whereas neutrophil-derived macrovesicles were generated by neutrophils that have arrived at the inflammatory foci. NDTRs contain proinflammatory miRNAs, induce proinflammatory macrophages polarization, and show protective effects in murine models of acute and chronic inflammation.70
One of the key features of our data is the heterogeneous profile of MV-PGC driven by the qualitative differences in the Gran-MVs among SS patients, in line with the heterogeneous profile of sepsis patients.71 Indeed, sepsis patients have wide variations in their genetic background, age, gender, accompanying diseases, chronically prescribed medications, source of infection, pathogens involved, and the sites of infection. This heterogeneity has been one of the major hindrances in sepsis research, particularly affecting the development of therapies. Because MVs are a miniature version of cells reflecting the fluctuating status of patients,72 they form a complex signature reflecting the multifaceted responses of patients driven by their septic environment. Accordingly, as shown by the sepsis literature, MVs can have both protective and detrimental effects, either locally or at distant sites, and can take the shape of either a friend or a foe according to the cellular origin and/or the cargo they carry. Our data suggest that patients who are able to produce MVs with high PGC potential are better protected from this lethal complication. Thus, a number of promising speculations can be drawn, proposing MVs as multifaceted mediators useful in patient-tailored therapy.
In conclusion, this work demonstrates that Gran-MVs from SS patients convey a uPA-dependent MV-PGC that promotes clot lysis. This mechanism indicates that fibrinolytic MVs are key players in the thrombolytic process and an efficient protective response that may counterbalance the procoagulant state associated with sepsis. Thus, this “bloodborne fibrinolytic capacity of Gran-MVs” may be a new subcellular mechanism that could play a key role in the outcome of SS patients.
Acknowledgments
The authors thank J. Sampol and G. Contant for scientific advice; and Genentech Inc. (San Francisco, CA), who kindly provided the rat anti-mouse TF monoclonal antibody (1H1). We thank S. Roffino from the AMU Mecabio platform (Institue of Movement Science, Marseille) for her expertise and her help in histology experiments.
Authorship
Contribution: S.C. and L.V. performed the research, analyzed and interpreted the data, and wrote the manuscript; P.E., C.J., S.R., D.F., C.C., M.D., S.H., N.M., and A.B. performed the research, collected the data, and analyzed and interpreted the data; M.-C.A., P.P., K.H.S., and J.A. designed the research and reviewed the manuscript; F.D.-G. supervised the work and helped write the manuscript; and R.L. designed the research, analyzed and interpreted the data, and helped write the manuscript.
Conflict-of-interest disclosure: This work received financial support from Stago Company, which has an exclusive license (patent N°07/04060) to the above-mentioned patent, and C.J. and P.P. are full-time employees of BioCytex, a Stago Group company. The remaining authors declare no competing financial interests.
Correspondence: Françoise Dignat-George, C2VN-UMR-INSERM 1263, INRA 1260, Faculté de Pharmacie, 27 Bd Jean Moulin, 13010 Marseille, France; e-mail: francoise.dignat-george@univ-amu.fr.
The online version of this article contains a data supplement.
There is a Blood Commentary on this article in this issue.
The publication costs of this article were defrayed in part by page charge payment. Therefore, and solely to indicate this fact, this article is hereby marked “advertisement” in accordance with 18 USC section 1734.

This feature is available to Subscribers Only
Sign In or Create an Account Close Modal