

Key Points
Structural racism assessed by census tract variables accounts for nearly all Black-White and Hispanic-White disparity in AML survival.
Structural racism is a stronger mediator of survival disparities than molecular features, comorbidities, health care access, and treatment.

Abstract
Non-Hispanic Black (NHB) and Hispanic patients with acute myeloid leukemia (AML) have higher mortality rates than non-Hispanic White (NHW) patients despite more favorable genetics and younger age. A discrete survival analysis was performed on 822 adult patients with AML from 6 urban cancer centers and revealed inferior survival among NHB (hazard ratio [HR] = 1.59; 95% confidence interval [CI]: 1.15, 2.22) and Hispanic (HR = 1.25; 95% CI: 0.88, 1.79) patients compared with NHW patients. A multilevel analysis of disparities was then conducted to investigate the contribution of neighborhood measures of structural racism on racial/ethnic differences in survival. Census tract disadvantage and affluence scores were individually calculated. Mediation analysis of hazard of leukemia death between groups was examined across 6 composite variables: structural racism (census tract disadvantage, affluence, and segregation), tumor biology (European Leukemia Network risk and secondary leukemia), health care access (insurance and clinical trial enrollment), comorbidities, treatment patterns (induction intensity and transplant utilization), and intensive care unit (ICU) admission during induction chemotherapy. Strikingly, census tract measures accounted for nearly all of the NHB-NHW and Hispanic-NHW disparity in leukemia death. Treatment patterns, including induction intensity and allogeneic transplant, and treatment complications, as assessed by ICU admission during induction chemotherapy, were additional mediators of survival disparities in AML. This is the first study to formally test mediators for observed disparities in AML survival and highlights the need to investigate the mechanisms by which structural racism interacts with known prognostic and treatment factors to influence leukemia outcomes.
Introduction
Acute myeloid leukemia (AML) is the most common acute leukemia in adults, with an estimated 19 520 new cases and 10 670 deaths in 2018.1 Two-thirds of patients with AML die of their disease within 5 years. Clinical history, cytogenetics and well-validated mutations are currently used to identify patients at high risk of relapse and direct them to allogenic stem cell transplantation (ASCT). Although racial and socioeconomic differences have been identified as prognostic factors in many solid organ malignancies,2 their impact in hematologic cancers is understudied. A retrospective review of patients with AML in the Surveillance, Epidemiology, and End Results (SEER) database showed higher mortality rates for non-Hispanic Black (NHB) and Hispanic patients despite more favorable cytogenetics and a younger age at presentation compared with non-Hispanic White (NHW) patients.3,4 Nonbiologic factors including insurance status, marital status and county-level income have been shown to independently affect survival in AML using SEER data5 and the National Cancer Database.6 This may be partly linked to treatment patterns, as demonstrated in the California Cancer Registry, where lower rates of chemotherapy and stem cell transplantation were observed in patients with lower socioeconomic status (SES),7 as well as increased in-hospital mortality in patients with AML from low-income neighborhoods.8
The term structural racism refers to systematic disadvantage experienced by certain groups of people. Neighborhood segregation, a widely studied form of structural racism, has been shown to directly influence racial disparities in health outcomes (www.nimhd.nih.gov/resources/understanding-health-disparities/srd.html). In the current study, we operationalize structural racism using a composite variable incorporating racial segregation, disadvantage, and affluence at the census tract level. Census tracts, defined as relatively permanent geographic units that are fairly homogenous in social and economic characteristics (US Census Bureau 2010), have been used to investigate disparities in health outcomes.9,10 Neighborhood and built environment have been examined across the cancer continuum and were found to be linked to late-stage diagnosis and higher mortality rates.11 AML has a dramatic presentation and lacks early detection tools, which presents unique challenges in exploring the impact of structural racism on outcomes. While acknowledging that census tract level data are a narrow indicator of structural racism, this study is a first attempt to empirically examine structural racism as a determinant of leukemia outcome inequities. We performed a multilevel analysis to determine the extent to which tract-level SES and segregation mediated outcome disparities for NHB patients specifically and for ethnic minority patients more generally (Figure 1).
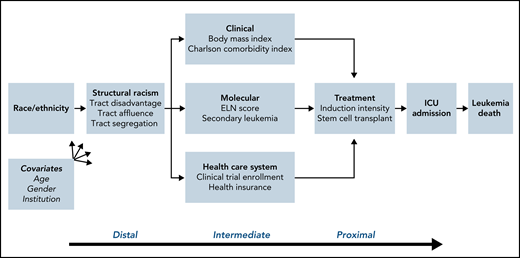
Mediating factors of death in AML. Causal diagram demonstrating the interplay of elements that impact leukemia death. These include the distal factor of structural racism, intermediate factors including clinical and molecular characteristics and health care access, and proximal factors of treatment patterns and complications. The impact of these in turn are adjusted by age, sex, and institution.
Mediating factors of death in AML. Causal diagram demonstrating the interplay of elements that impact leukemia death. These include the distal factor of structural racism, intermediate factors including clinical and molecular characteristics and health care access, and proximal factors of treatment patterns and complications. The impact of these in turn are adjusted by age, sex, and institution.
Methods
Data collection
This was a multi-institutional study evaluating adult patients diagnosed with AML between January 2012 and January 2018. Patient data were collected from 6 academic cancer centers in the metropolitan Chicago region: the University of Illinois at Chicago (n = 126), Loyola University (n = 229), Northwestern University (n = 151), the University of Chicago (n = 150), Rush University (n = 100), and the John H. Stroger, Jr. Hospital of Cook County (n = 66). Data were collected in Redcap using an Institutional Review Board (IRB)-approved protocol and data use agreement per each institution’s regulatory requirements. Data points collected included patient demographics (age, sex, self-reported race, ethnicity), health history (components of the Charlson Comorbidity Index [CCI], body mass index (BMI), and treatment of prior malignancies), disease characteristics (hematologic and metabolic profile at the time of diagnosis), and genomic profile (cytogenetics, mutational profile and European Leukemia Network [ELN] 2010 classification12). ELN 2010 was used because a significant percentage of patients lacked molecular data for accurate ELN 2017 classification. Data on insurance status were also collected. The 4% of our patients aged 65+ (age-eligible for Medicare) who were dual eligible were all coded as Medicaid patients, whereas the 10% of patients <65 years were coded as having Medicare. Details of treatment were also collected, including intensity and characteristics of frontline therapy, utilization of ASCT in first remission, overall response rate to first-line therapy by ELN criteria,13 relapse within the study period, and need for intensive care unit (ICU) admission during hospitalization for intensive induction chemotherapy. Transplant utilization data were restricted to first remission given that this timepoint has the strongest clinical evidence for impacting survival. Rates of secondary AML were also examined across racial/ethnic groups. The definition of secondary AML includes AML with myelodysplasia-related changes (AML-MRC) and those described by the World Health Organization 2016 definition of therapy-related AML (t-AML), which is AML arising from prior cytotoxic chemotherapy or ionizing radiation.14 For survival analysis, date of leukemia death or last follow-up were recorded. Leukemia death was defined as death that was determined by investigator to be attributable to AML. Among all deaths, 78% (318 of 406) were attributed to leukemia.
Statistical analysis
The Federal Financial Institutions Examination Council’s Geocoding/Mapping System was used to geocode patients to their residential census tract (supplemental Figure 2 available on the Blood Web site). Using data from the American Community Survey for years 2006 to 2010, the following measures were used to define a measure of tract disadvantage: proportion of families with incomes below the poverty line, proportion of families receiving public assistance, proportion of adults that were unemployed and proportion of households that were female-headed households with children. Tract affluence was defined as follows: proportion of families with incomes greater than $75 000, proportion of adults with at least a college education, and proportion of adults employed in professional or managerial occupations.15 For both tract disadvantage and tract affluence, we created an equally weighted sum across the relevant measures and standardized each to have a mean of 0 and a standard deviation of 1. Two additional tract level measures were defined: Proportion of individuals that were NHB and proportion of individuals that were NHW. As a group, these tract-level measures were conceptualized as measures of structural racism. Tract segregation of NHB and NHW were categorized into tertiles to create roughly equivalent sample sizes to maximize precision of our results. The 80% cut point for NHB patients reflects the known distribution of NHB population in Chicago, where a high concentration of NHB residents live in tracts with >80% black residents, whereas NHW patients were more evenly distributed. Because of limited information on household income and education in the electronic health record, we were unable to calculate a full socioeconomic position score15; however, we considered measures of tract segregation to complement tract SES data, because tracts with higher proportion NHW might have greater access to opportunities and resources.
We conducted discrete time survival analysis models to estimate associations of race/ethnicity, structural racism (disadvantage, affluence, proportion NHB, proportion NHW), patient and clinical factors (BMI, comorbidities, payer source, clinical trial enrollment), tumor biology (secondary leukemia, ELN risk classification), and treatment (induction intensity, transplant) on the hazard of leukemia death. We divided the time at risk into 90 day intervals and modeled risk of leukemia death using complementary log-log regression, which produces estimates that, when exponentiated, can be interpreted as hazard ratios.16 Discrete-time models are more appropriate for mediation analyses compared with Cox models on theoretical grounds, because the proportional hazards assumption can never be satisfied for both models with and without the mediator.17 Mediation analyses18 were performed to explore the underpinnings for racial/ethnic disparities in leukemia death. Addition of potential confounders was guided by Figure 1. To improve the stability of our mediation proportion estimates with respect to structural racism, we first conducted principal components analysis and extracted the predicted score for the first component which accounted for approximately 70% of the variance across the four tract measures. We used this first component as a mediator variable for structural racism in our analyses.
First, individual discrete time survival models for each risk factor were estimated, both unadjusted and while controlling for age at diagnosis, sex, and diagnosing hospital. Next, we compared the hazard ratio (HR) for racial/ethnic disparities in leukemia death before (baseline HR [HRB]) and after (mediated HR [HRM]) controlling for each of the following domains: structural racism (using the first principal component); tumor biology (ELN prognostic score and secondary leukemia); health care access (health insurance status and type; enrollment in clinical trial); treatment patterns (systemic therapy and allogeneic transplant); comorbidities (CCI); and ICU admission during intensive induction chemotherapy. Both baseline and mediated models were adjusted for age at diagnosis, sex, and diagnosing hospital. The correlations of model covariates with diagnosing hospital were not strong enough to create any issues with multicollinearity for any of our models. We calculated the mediation proportion as the proportionate reduction in the disparity HR for each racial/ethnic group (using NHW as the referent) as [(HRB − 1) − (HRM − 1)]/(HRB − 1). A second approach was used known as the method of rescaled coefficients, which further accounts for the nonconstant variance between the unmediated and mediated models. This method rescales the model variance in the reduced model (without the mediator) to equal the variance in the full model (with the mediator) and calculates a mediation proportion and P value for the corresponding difference in the disparity coefficient before and after controlling for the mediator.19 All models were again adjusted for age, sex, and study site.
Results
Patient characteristics
In all, 822 patients with AML were included in this analysis, although sample sizes varied across analyses because of missing data for specific factors (Table 1). Minority populations, including NHB (n = 126), Hispanic (n = 117), and members of other racial and ethnic groups (n = 82) comprised 40% of the study population, whereas 60% of the population was NHW (n = 497). In this sample, median age and interquartile range (IQR) of the entire cohort was 62 years (IQR: 51, 71). Median age at diagnosis was 63 years (IQR: 53, 72) for NHW patients; 62 years (IQR 52, 71) for NHB patients; 53 years (IQR: 39, 64) for Hispanic patients; and 63 years (IQR: 55, 73) for patients of other race/ethnicity. There was a statistically significant difference in BMI between racial groups, with 22% of NHB and 19% of Hispanic patients noted to be morbidly obese compared with 11% of NHW patients and 14% of other patients. CCI scores also differed, with Hispanics less likely to have CCI > 2 (48% of Hispanics compared with 65% of NHW, 69% of NHB, and 70% of other patients).
Racial/ethnic differences in demographic characteristics
| Characteristics | N | NH White (N = 497), % | NH Black (N = 126), % | Hispanic (N = 117), % | Other (N = 82), % | P |
|---|---|---|---|---|---|---|
| Age at diagnosis, y | <.0001 | |||||
| 18-39 | 103 | 9 | 15 | 25 | 11 | |
| 40-59 | 257 | 30 | 30 | 41 | 29 | |
| 60-74 | 327 | 43 | 42 | 23 | 43 | |
| 75+ | 133 | 18 | 13 | 11 | 17 | |
| Sex | .0007 | |||||
| Male | 445 | 53 | 44 | 55 | 73 | |
| Female | 377 | 47 | 56 | 45 | 27 | |
| Tract disadvantage | <.0001 | |||||
| Lowest third | 269 | 46 | 7 | 11 | 32 | |
| Middle third | 265 | 38 | 12 | 32 | 37 | |
| Highest third | 265 | 16 | 82 | 56 | 32 | |
| Tract affluence | <.0001 | |||||
| Lowest third | 266 | 20 | 54 | 72 | 26 | |
| Middle third | 266 | 37 | 33 | 17 | 38 | |
| Highest third | 265 | 43 | 13 | 10 | 36 | |
| Tract % NH Black | <.0001 | |||||
| Lowest third (0-2%) | 266 | 45 | 0 | 21 | 30 | |
| Middle third (2-8%) | 266 | 35 | 11 | 41 | 44 | |
| Highest third (8-100%) | 266 | 19 | 89 | 38 | 26 | |
| Tract % NH Black | <.0001 | |||||
| 0-10% | 567 | 85 | 12 | 67 | 81 | |
| 10-80% | 157 | 14 | 36 | 28 | 16 | |
| >80% | 74 | 1 | 52 | 4 | 4 | |
| Tract % NH White | <.0001 | |||||
| Lowest third (0-50%) | 266 | 13 | 83 | 72 | 27 | |
| Middle third (51%-82%) | 266 | 39 | 12 | 20 | 52 | |
| Highest third (83-99%) | 266 | 49 | 5 | 8 | 21 | |
| Body mass index | .02 | |||||
| Under/normal | 275 | 34 | 34 | 28 | 40 | |
| Over | 266 | 34 | 31 | 30 | 35 | |
| Obese | 154 | 21 | 13 | 23 | 10 | |
| Morbidly obese | 114 | 11 | 22 | 19 | 14 | |
| Charlson Comorbidity Index | .007 | |||||
| 0 | 60 | 8 | 12 | 19 | 6 | |
| 1 | 158 | 28 | 19 | 33 | 24 | |
| 2+ | 380 | 65 | 69 | 48 | 70 | |
| Missing | 223 | (28) | (15) | (28) | (39) | |
| Payer source | <.0001 | |||||
| Private | 354 | 50 | 25 | 37 | 41 | |
| Medicare | 311 | 42 | 41 | 20 | 34 | |
| Medicaid | 99 | 5 | 31 | 21 | 11 | |
| Uninsured | 55 | 3 | 3 | 22 | 13 | |
| Enrolled in clinical trial | ||||||
| No | 678 | 83 | 84 | 88 | 83 | |
| Yes | 131 | 17 | 16 | 12 | 17 | |
| Secondary AML | .004 | |||||
| t-AML | 253 | 30 | 37 | 22 | 39 | |
| MRC | 74 | 9 | 14 | 5 | 7 | |
| European Leukemia Network prognostic score | .02 | |||||
| Favorable | 114 | 14 | 15 | 20 | 13 | |
| Intermediate-I | 289 | 41 | 26 | 32 | 36 | |
| Intermediate-II | 142 | 16 | 22 | 25 | 21 | |
| Adverse | 233 | 30 | 37 | 24 | 31 | |
| Missing | 44 | (4) | (9) | (3) | (13) | |
| p53 mutation status | .01 | |||||
| No functional mutation | 483 | 93 | 81 | 93 | 88 | |
| Functional mutation | 46 | 7 | 19 | 7 | 12 | |
| Missing | 293 | (23) | (51) | (54) | (60) | |
| Induction intensity | .05 | |||||
| High | 572 | 68 | 68 | 80 | 68 | |
| Low | 192 | 26 | 22 | 15 | 20 | |
| Supportive care | 58 | 6 | 10 | 4 | 12 | |
| Transplant | <.0001 | |||||
| No | 460 | 53 | 78 | 58 | 56 | |
| Yes | 336 | 47 | 22 | 42 | 44 | |
| ICU admission during induction | .01 | |||||
| No | 401 | 78 | 73 | 70 | 57 | |
| Yes | 141 | 22 | 27 | 30 | 43 | |
| Missing | 30 | (6) | (2) | (7) | (4) |
P > .20 is suppressed. For risk factors with more than 5% missing data, the total number missing is presented, and the race/ethnicity-specific percentages missing are presented in parentheses.
Disease characteristics
Cytogenetic and limited genomic data were available on 778 patients, allowing calculation of accurate ELN 2010 risk scores. The NHB group was more likely to have ELN adverse-risk disease (37% of NHB vs 30% of NHW, 24% of Hispanic, and 31% of other patients). Among the 529 total subjects who underwent TP53 mutation testing, there was significant variation in the prevalence of functional mutations by race/ethnicity, and functional mutations were more prevalent among NHB compared with NHW patients (19% vs 7%; P = .01). This was reflected in higher levels of complex karyotype AML in NHB compared with NHW patients. The prevalence of favorable risk disease was highest among Hispanic patients (20% in Hispanics vs 14% in NHW, 15% in NHB, and 13% in the other group), most commonly core binding factor gene rearrangements. Rates of secondary AML were highest in NHB patients (51%) and lowest in Hispanic patients (27%).
There was a statistically significant difference in SES between racial groups, reflected by census tract measures. NHW were more likely to reside in more affluent and less disadvantaged census tracts, whereas Hispanic and NHB patients were more likely to live in less affluent and more disadvantaged census tracts (Table 1). Additionally, NHW patients were more likely to have private insurance (50%) compared with NHB (25%), Hispanic (37%), and other (41%) patients, whereas 22% of Hispanic patients were uninsured compared with only 3% of NHW, 3% of NHB, and 13% of other patients. NHW and NHB patients lived in segregated tracts, with only 1% of NHW living in tracts with >80% of residents of African American descent, and only 5% of NHB living in tracts with >80% of residents being NHW.
Treatment patterns
The majority of the patient cohort (70%) received intensive induction chemotherapy (supplemental Figure 1). Treatment patterns differed by race, with Hispanic patients more likely than NHW, NHB, and other patients to receive high-intensity induction therapy. NHW patients were less likely than NHB, Hispanic, and other patients to be admitted to the intensive care unit during induction chemotherapy, with 82.3% of patients transferred after treatment initiation, whereas the remaining 17.7% began treatment in the ICU. There was no statistically significant difference by race or ethnicity in clinical trial enrollment. However, NHB were significantly less likely than other groups to undergo ASCT (22% vs 47% of NHW, 42% of Hispanics, and 44% of other patients).
Treatment outcomes
Median duration of follow-up was 1.29 years from date of diagnosis, and date of censorship was 14 July 2020. NHB and other race/ethnicities had shorter available follow-up time compared with NHW and Hispanic patients. Median follow-up times were 1.4, 1.0, 1.4, and 1.1 years for NHW, NHB, Hispanic, and other race/ethnicities respectively. Overall response rates to induction chemotherapy differed qualitatively between groups using ELN 2017 response criteria, and the overall P value for racial/ethnic differences was 0.01 (Table 2). Complete remission rates were highest in Hispanic patients at 74%, whereas primary refractory disease was highest in NHB patients at 20% compared with 16% of NHW and 12% of Hispanic patients. Relapse-free survival at 1 and 2 years was not significantly different between groups. Two-year overall survival was highest in Hispanic patients at 64% and lowest in NHB at 53% but did not reach statistical difference.
Racial and ethnic differences in treatment-related outcomes and survival
| Outcomes | No. | % | NH White (N = 497) | NH Black (N = 126) | Hispanic (N = 117) | Other (N = 82) | P | ||||
|---|---|---|---|---|---|---|---|---|---|---|---|
| No. | % | No. | % | No. | % | No. | % | ||||
| Weeks at risk (follow-up) | |||||||||||
| Mean no. of weeks | 96 | 103 | 73 | 104 | 78 | ||||||
| Median no. of weeks | 68 | 74 | 52 | 71 | 58 | ||||||
| Treatment (N = 822) | |||||||||||
| Induction | 572 | 70 | 336 | 68 | 86 | 68 | 94 | 80 | 56 | 68 | |
| Nonintensive | 192 | 23 | 130 | 26 | 28 | 22 | 18 | 15 | 16 | 20 | |
| Supportive care | 58 | 7 | 31 | 6 | 12 | 10 | 5 | 4 | 10 | 12 | |
| For patients receiving induction therapy (N = 572) | |||||||||||
| Treatment response after induction | .01 | ||||||||||
| Complete response | 395 | 69 | 226 | 67 | 58 | 67 | 70 | 74 | 41 | 73 | |
| Cri | 49 | 9 | 33 | 10 | 8 | 9 | 6 | 6 | 2 | 4 | |
| MLFS | 7 | 1 | 2 | 1 | 0 | 0 | 5 | 5 | 0 | 0 | |
| PR | 32 | 6 | 22 | 7 | 3 | 3 | 2 | 2 | 5 | 9 | |
| Treatment failure | 89 | 16 | 53 | 16 | 17 | 20 | 11 | 12 | 8 | 14 | |
| Relapse (among the 483 responders) | |||||||||||
| No | 266 | 55 | 157 | 55 | 34 | 49 | 45 | 54 | 30 | 63 | |
| Yes | 184 | 38 | 115 | 41 | 26 | 38 | 29 | 35 | 14 | 29 | |
| Missing | 33 | 7 | 11 | 4 | 9 | 13 | 9 | 11 | 4 | 8 | |
| For patients receiving nonintensive therapy (N = 192) | |||||||||||
| Relapse (among 72 responders) | .13 | ||||||||||
| No | 22 | 31 | 20 | 38 | 1 | 11 | 1 | 17 | 0 | 0 | |
| Yes | 42 | 58 | 27 | 51 | 6 | 67 | 5 | 83 | 4 | 100 | |
| Missing | 8 | 11 | 6 | 11 | 2 | 22 | 0 | 0 | 0 | 0 | |
| All AML regardless of treatment (N = 822) | |||||||||||
| Death within 90 days | |||||||||||
| No/missing | 735 | 89 | 442 | 89 | 110 | 87 | 110 | 94 | 73 | 89 | |
| Yes | 87 | 11 | 55 | 11 | 16 | 13 | 7 | 6 | 9 | 11 | |
| One-year relapse-free survival | .17 | ||||||||||
| No/missing | 412 | 50 | 240 | 48 | 72 | 57 | 54 | 46 | 46 | 56 | |
| Yes | 410 | 50 | 257 | 52 | 54 | 43 | 63 | 54 | 36 | 44 | |
| Two-year relapse-free survival | .17 | ||||||||||
| No/missing | 589 | 72 | 352 | 71 | 96 | 76 | 77 | 66 | 64 | 78 | |
| Yes | 233 | 28 | 145 | 29 | 30 | 24 | 40 | 34 | 18 | 22 | |
| One-year overall survival | .13 | ||||||||||
| No/missing | 228 | 28 | 138 | 28 | 43 | 34 | 24 | 21 | 23 | 28 | |
| Yes | 594 | 72 | 359 | 72 | 83 | 66 | 93 | 79 | 59 | 72 | |
| Two-year overall survival | .17 | ||||||||||
| No/missing | 341 | 41 | 212 | 43 | 59 | 47 | 42 | 36 | 28 | 34 | |
| Yes | 481 | 59 | 285 | 57 | 67 | 53 | 75 | 64 | 54 | 66 | |
P < .20 is suppressed.
Associations of demographic, clinical, tumor, and treatment characteristics with survival
In models adjusted for age, sex, and study site, compared with NHW patients, the hazard of leukemia death was significantly greater for NHB patients (HR = 1.59; 95% confidence interval [CI]: 1.15, 2.22) and marginally greater for Hispanic patients (HR = 1.25; 95% CI: 0.88, 1.79) and patients of other race/ethnicities (HR = 1.34; 95% CI: 0.89, 2.0; Figure 2). Hazard of leukemia death was higher for patients residing in more disadvantaged and less affluent tracts; hazard of death was also higher for patients residing in tracts with a greater proportion of NHB residents and lower for patients residing in tracts with a greater proportion of NHW residents. Patients diagnosed with secondary AML had a nearly 1.5-fold increased hazard of leukemia death, and patients with an adverse ELN risk score experienced a more than two-fold greater hazard compared with patients with a favorable risk score (Table 3). A higher number of comorbidities and older age were strongly associated with lower probability of receiving high-intensity induction therapy. Compared with patients receiving high-intensity induction chemotherapy, hazard of leukemia death was roughly twice as great for patients with low intensity therapy and nearly five times greater for those who received supportive care. ASCT was associated with a nearly 80% decrease, whereas an ICU admission was associated with a >50% increased hazard of leukemia death (Table 3).
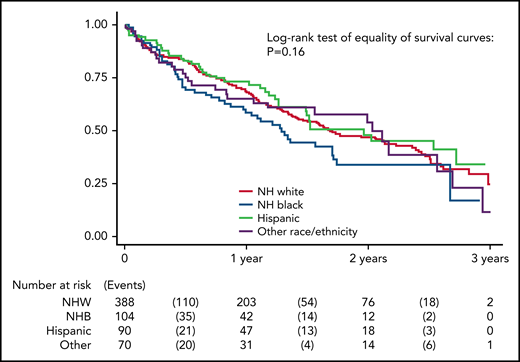
Kaplan-Meier curve of survival by race/ethnicity. Log-rank analysis of survival in models adjusted for age, sex, and study site.
Kaplan-Meier curve of survival by race/ethnicity. Log-rank analysis of survival in models adjusted for age, sex, and study site.
Multivariable-adjusted associations of patient risk factors with hazard of leukemia death
| Risk factors for leukemia death | N | Adjusted for study site | Confounder adjusted | ||||
|---|---|---|---|---|---|---|---|
| HR | (95% CI) | P | HR | (95% CI) | P | ||
| Race/ethnicity | .08 | .04 | |||||
| NH White | 497 | 1.00 | 1.00 | ||||
| NH Black | 124 | 1.51 | (1.09, 2.10) | 1.59 | (1.15, 2.22) | ||
| Hispanic | 117 | 1.05 | (0.73, 1.49) | 1.25 | (0.88, 1.79) | ||
| Other | 81 | 1.32 | (0.89, 1.97) | 1.34 | (0.89, 2.00) | ||
| Age at diagnosis, y | <.0001 | <.0001 | |||||
| 18-39 | 103 | 1.00 | 1.00 | ||||
| 40-59 | 257 | 1.42 | (0.88, 2.27) | 1.47 | (0.92, 2.36) | ||
| 60-74 | 326 | 2.92 | (1.87, 4.56) | 3.01 | (1.93, 4.72) | ||
| 75+ | 133 | 5.01 | (3.10, 8.10) | 5.02 | (3.09, 8.14) | ||
| Sex | |||||||
| Male | 445 | 1.00 | 1.00 | ||||
| Female | 377 | 0.86 | (0.69, 1.08) | 0.88 | (0.70, 1.10) | ||
| Tract disadvantage | .20 | ||||||
| Lowest third | 266 | 1.00 | 1.00 | ||||
| Middle third | 267 | 0.96 | (0.72, 1.27) | 1.03 | (0.78, 1.38) | ||
| Highest third | 265 | 1.24 | (0.93, 1.64) | 1.20 | (0.86, 1.66) | ||
| Tract affluence | |||||||
| Lowest third | 266 | 1.00 | 1.00 | ||||
| Middle third | 266 | 0.83 | (0.63, 1.10) | 0.85 | (0.63, 1.14) | ||
| Highest third | 265 | 0.81 | (0.61, 1.08) | 0.76 | (0.55, 1.04) | ||
| Tract % NH Black | .06 | ||||||
| 0-10% | 566 | 1.00 | |||||
| 10-80% | 166 | 1.09 | (0.81, 1.46) | 1.01 | (0.73, 1.38) | ||
| >80% | 73 | 1.58 | (1.08, 2.30) | 1.38 | (0.81, 2.35) | ||
| Tract % NH White | .009 | .05 | |||||
| Lowest third (0-50%) | 266 | 1.00 | 1.00 | ||||
| Middle third (51%-82%) | 266 | 0.77 | (0.58, 1.02) | 0.75 | (0.54, 1.05) | ||
| Highest third (83-99%) | 266 | 0.63 | (0.47, 0.84) | 0.64 | (0.45, 0.91) | ||
| Body mass index* | |||||||
| Under/normal | 275 | 1.00 | 1.00 | ||||
| Over | 266 | 1.09 | (0.83, 1.43) | 1.10 | (0.84, 1.45) | ||
| Obese | 154 | 0.83 | (0.59, 1.17) | 0.87 | (0.61, 1.24) | ||
| Morbidly obese | 114 | 0.94 | (0.65, 1.35) | 1.11 | (0.75, 1.62) | ||
| Charlson Comorbidity Index* | .0002 | .12 | |||||
| 0 | 60 | 1.00 | 1.00 | ||||
| 1 | 158 | 1.14 | (0.68, 1.91) | 0.61 | (0.35, 1.07) | ||
| 2+ | 380 | 1.98 | (1.23, 3.17) | 0.48 | (0.26, 0.92) | ||
| Payer source* | <.0001 | ||||||
| Private | 354 | 1.00 | 1.00 | ||||
| Medicare | 311 | 1.88 | (1.47, 2.41) | 1.02 | (0.77, 1.35) | ||
| Medicaid | 99 | 1.25 | (0.83, 1.89) | 1.37 | (0.88, 2.13) | ||
| Uninsured | 55 | 1.71 | (0.96, 3.06) | 1.73 | (0.98, 3.05) | ||
| Enrolled in clinical trial* | .13 | ||||||
| No | 678 | 1.00 | 1.00 | ||||
| Yes | 131 | 0.91 | (0.68, 1.22) | 0.79 | (0.58, 1.07) | ||
| Secondary AML† | .0001 | .06 | |||||
| No | 495 | 1.00 | 1.00 | ||||
| t-AML | 253 | 1.57 | (1.22, 2.02) | 1.16 | (0.88, 1.52) | ||
| MRC | 74 | 2.11 | (1.44, 3.08) | 1.64 | (1.10, 2.45) | ||
| Prognostic score† | <.0001 | <.0001 | |||||
| Favorable | 114 | 1.00 | 1.00 | ||||
| Intermediate-I | 289 | 1.77 | (1.15, 2.70) | 1.52 | (0.98, 2.35) | ||
| Intermediate-II | 142 | 2.39 | (1.50, 3.81) | 1.82 | (1.12, 2.95) | ||
| Adverse | 233 | 3.40 | (2.23, 5.17) | 2.61 | (1.69, 4.02) | ||
| Induction intensity‡ | <.0001 | <.0001 | |||||
| High | 572 | 1.00 | 1.00 | ||||
| Low | 192 | 2.88 | (2.25, 3.68) | 2.01 | (1.47, 2.75) | ||
| Supportive care | 58 | 5.02 | (3.41, 7.40) | 5.20 | (3.01, 9.00) | ||
| Transplant‡ | <.0001 | <.0001 | |||||
| No | 460 | 1.00 | 1.00 | ||||
| Yes | 336 | 0.21 | (0.16, 0.28) | 0.22 | (0.16, 0.31) | ||
| ICU admission during induction‡ | .001 | .02 | |||||
| No | 401 | 1.00 | 1.00 | ||||
| Yes | 141 | 1.82 | (1.29, 2.56) | 1.58 | (1.08, 2.31) | ||
P > .20 is suppressed. Baseline models are adjusted only for diagnosing hospital. All multivariable adjusted models are adjusted for age, race/ethnicity, sex, and diagnosing hospital.
Adjusted additionally for tract SES.
Adjusted additionally for tract SES, insurance, and trial enrollment.
Adjusted additionally for tract SES, insurance, trial enrollment, secondary AML, and prognostic score.
Mediation analysis of racial/ethnic disparities in survival
Variables intended to serve as proxies for tract structural racism (tract disadvantage, tract affluence, tract proportion NHB, tract proportion NHW) appeared to mediate nearly all of the AML survival disparity (Figure 3). In the baseline model adjusted for age, sex, and diagnosing hospital, the hazard of AML death (disparity HR) was more than 50% greater for NHB than NHW patients (HR = 1.61; 95% CI: 1.15, 2.26). In models that adjusted additionally for the first component of tract SES, the disparity HR for NHB patients was lowered to 1.04 (95% CI: 0.65, 1.66; P = .006). Likewise, adjustment for tract structural racism reduced the disparity HR for Hispanic patients from 1.20 (95% CI: 0.83, 1.72) to 0.96 (95% CI: 0.65, 1.43), accounting for all the disparity in leukemia death between Hispanic and NHW patients (Table 4). Variables representing tumor biology (ELN prognostic score and secondary leukemia) did not appear to mediate racial/ethnic disparities in leukemia death, either individually or when modeled together. Meanwhile health care access variables accounted for one-fifth of the Hispanic-NHW disparity but not in other groups. Among those with available data, controlling for comorbidities reduced the Hispanic-NHW disparity, but there was little disparity in this sample to begin with (HR = 1.11). Treatment type including induction intensity and ASCT mediated roughly one half of the NHB-NHW and Hispanic-NHW disparity in leukemia death (Table 4). Treatment complications reflected by ICU admission during the hospitalization for intensive chemotherapy was a proximal mediator accounting for nearly one-fourth of the NHB-NHW and Hispanic-NHW disparity in leukemia death.
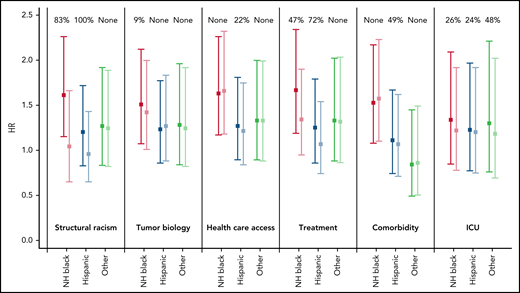
Disparity in hazard of leukemia death for NHB, Hispanic, and other race/ethnicity vs NHW patients, before and after controlling for specific domains that might mediate these disparities. Domains include structural racism (census tract measures), tumor biology (secondary leukemia and ELN prognostic score), health care access (insurance and clinical trial enrollment), treatment (induction therapy and transplant status), comorbidities, and ICU admission during treatment. HRs estimated from discrete-time survival models adjusting for sex, age, and study site. HRs and 95% CIs are presented separately by domain and race/ethnicity, before and after adjusting for each domain. Estimates are color coded before and after adjustment for each domain for NH Black (red and pink), Hispanic (dark blue and light blue), and other race/ethnicities (dark green and light green).
Disparity in hazard of leukemia death for NHB, Hispanic, and other race/ethnicity vs NHW patients, before and after controlling for specific domains that might mediate these disparities. Domains include structural racism (census tract measures), tumor biology (secondary leukemia and ELN prognostic score), health care access (insurance and clinical trial enrollment), treatment (induction therapy and transplant status), comorbidities, and ICU admission during treatment. HRs estimated from discrete-time survival models adjusting for sex, age, and study site. HRs and 95% CIs are presented separately by domain and race/ethnicity, before and after adjusting for each domain. Estimates are color coded before and after adjustment for each domain for NH Black (red and pink), Hispanic (dark blue and light blue), and other race/ethnicities (dark green and light green).
Mediation analysis of racial/ethnic disparities in leukemia death
| N | Unmediated model | Mediated model | Rescaled coefficients | |||||
|---|---|---|---|---|---|---|---|---|
| HR | (95% CI) | HR | (95% CI) | %Change* | %Change† | P‡ | ||
| Baseline | Census tract structural racism | Mediation proportion estimates | ||||||
| Race/ethnicity | ||||||||
| NH White | 482 | 1.0 | 1.0 | |||||
| NH Black | 120 | 1.61 | (1.15, 2.26) | 1.04 | (0.65, 1.66) | 94% | 83% | .006 |
| Hispanic | 117 | 1.20 | (0.83, 1.72) | 0.96 | (0.65, 1.43) | 120% | 100% | .006 |
| Other | 79 | 1.27 | (0.83, 1.92) | 1.24 | (0.82, 1.89) | 9% | None | |
| Race/ethnicity | Tumor biology | |||||||
| NH White | 477 | 1.0 | 1.0 | |||||
| NH Black | 115 | 1.51 | (1.07, 2.12) | 1.42 | (1.01, 2.00) | 17% | 9% | .15 |
| Hispanic | 114 | 1.23 | (0.86, 1.77) | 1.27 | (0.88, 1.83) | −15% | None | |
| Other | 72 | 1.28 | (0.84, 1.96) | 1.25 | (0.82, 1.92) | 10% | None | |
| Race/ethnicity | Health care access | |||||||
| NH White | 487 | 1.0 | 1.0 | |||||
| NH Black | 125 | 1.63 | (1.17, 2.26) | 1.66 | (1.18, 2.32) | −5% | None | |
| Hispanic | 114 | 1.27 | (0.89, 1.81) | 1.21 | (0.84, 1.75) | 21% | 22% | .09 |
| Other | 82 | 1.33 | (0.89, 2.00) | 1.33 | (0.88, 1.99) | 2% | None | |
| Race/ethnicity | Treatment | |||||||
| NH White | 479 | 1.0 | 1.0 | |||||
| NH Black | 118 | 1.67 | (1.19, 2.34) | 1.34 | (0.95, 1.90) | 49% | 47% | <.0001 |
| Hispanic | 113 | 1.25 | (0.86, 1.79) | 1.07 | (0.74, 1.54) | 73% | 72% | .002 |
| Other | 78 | 1.33 | (0.88, 2.02) | 1.32 | (0.86, 2.03) | 4% | None | |
| Race/ethnicity | Comorbidity | |||||||
| NH White | 356 | 1.0 | 1.0 | |||||
| NH Black | 107 | 1.53 | (1.08, 2.17) | 1.57 | (1.10, 2.23) | None | None | |
| Hispanic | 85 | 1.11 | (0.74, 1.67) | 1.07 | (0.71, 1.62) | 35% | 49% | .11 |
| Other | 51 | 0.84 | (0.49, 1.45) | 0.86 | (0.50, 1.49) | 13% | None | |
| Race/ethnicity | ICU admission at induction (N = 573) | |||||||
| NH White | 315 | 1.0 | 1.0 | |||||
| NH Black | 85 | 1.34 | (0.85, 2.09) | 1.22 | (0.78, 1.92) | 34% | 26% | .01 |
| Hispanic | 88 | 1.23 | (0.77, 1.97) | 1.20 | (0.75, 1.92) | 13% | 24% | .04 |
| Other | 54 | 1.30 | (0.76, 2.21) | 1.18 | (0.69, 2.02) | 39% | 48% | .001 |
Mediation proportion estimates <10% are suppressed (reported as “None”), and P > .20 is suppressed. All models are adjusted for age, sex, and diagnosing hospital.
%Change in the excess hazard ratio for the disparity in leukemia death before and after controlling for potential mediation.
Proportionate reduction in the rescaled coefficients before vs after controlling for potential mediation.
P value for the difference in rescaled coefficients before vs after controlling for potential mediation.
Discussion
Although age and mutations are the lynchpins of prognosis in AML, recent work showed favorable-risk NPM1 mutations did not translate to superior outcomes in young NHB patients,20 suggesting additional contributing factors. Poverty has been linked to inferior survival21 in AML even after allogeneic transplant.22 We analyzed disparities in AML using census tract measures of racial and economic segregation as a proxy for the multidimensional construct of structural racism. Similar work on spatial social polarization has shown the index of concentration at the extremes23 influences racial disparities in black carbon exposures, assaults, and birth outcomes. This is one of the first studies to formally test for mediators of observed racial disparities in AML survival and represents an incremental step toward ameliorating—not just describing—differences.
Although we confirmed a statistically significant survival disparity between NHB and NHW leukemia patients, NHW-Hispanic disparity was not statistically significant, possibly because of lower numbers. Mediation analysis showed that structural racism (a composite of census tract disadvantage, affluence, and segregation) explains a substantial proportion of this difference. Evaluation of census tract variables shows high levels of concentrated disadvantage and low affluence in minority populations. Notably, structural racism appeared to mediate all of the AML survival disparity for NHB and Hispanic patients compared with NHW patients. Structural racism is a latent variable reflective of differences in environmental exposures, opportunities, and resources that have a proximal effect on many aspects of AML disease characteristics and treatment which collectively influence outcomes (Figure 1). Covariates included SES, health care access variables, tumor characteristics, comorbidities, and treatment characteristics; these were chosen based on their known influence on AML outcomes.
Tract analysis by race shows high levels of segregation in this urban population. Living in predominantly black neighborhoods increases the likelihood of late-stage diagnosis and increased mortality from solid tumors.24 Race influences neighborhood characteristics, including fund allocation for infrastructure such as roads, provision of health care services, and the creation of employment opportunities that provide health insurance.25 In our cohort, NHW patients were likeliest to have private insurance, whereas a quarter of Hispanic patients were uninsured. Hispanic patients were most likely to receive intensive chemotherapy. The equivalent rates of intensive induction chemotherapy in NHB and NHW patients contradicts earlier population-based studies6 and suggests additional post-treatment factors are influencing the higher mortality rates seen in NHB patients including infrastructure and social support for rigorous outpatient follow-up, as well as the ability to receive ASCT in patients that are at high risk of relapse.
The rate of ICU admissions during induction chemotherapy in NHB and Hispanic patients in this study is higher than NHW and complements recent data from the largely NHW Premier Healthcare database.26 Non-White ethnicity has been associated with increased risk of mortality in patients with AML admitted to the ICU.27 This may reflect undiagnosed chronic medical conditions that may be ameliorated with more thorough pretreatment evaluation.
NHB patients were half as likely to receive an ASCT in first remission, and transplant was associated with a two-thirds reduced hazard of leukemia death. Although this is partly related to donor availability, CIBMTR (Center for International Blood and Marrow Transplant Research) analysis and statewide registry studies implicate structural racism prohibiting transplant access.28,29 Mechanisms underpinning structural racism in solid organ transplant include access to specialty care, decision support tools that are linguistically and culturally appropriate, and timely transplant referral based on cultural assumptions and stereotypes.30 Interestingly, transplant rates in Hispanic patients in this cohort were comparable to NHW patients, partly because of increased utilization of alternate donors. Although minorities are generally underrepresented in cancer clinical trials, there was no difference in clinical trial enrollment between groups possibly reflective of the academic institutions represented in this study.
NHB patients had higher-risk molecular features including more secondary and TP53 mutated AML, consistent with previously reported higher incidence of complex karyotypes in this population,31,32 and reflected in higher rates of treatment failure after intensive chemotherapy. The increased prevalence of secondary AML and TP53 mutations in NHB is hypothesis generating with respect to biologic mechanisms underlying structural racism. Although clonal hematopoiesis in NHB was similar to NHW patients,33 a recent study uncovered a germline genetic variant at the TET2 locus associated with clonal hematopoiesis specific to individuals of African ancestry,34 which merits further investigation. Selective clonal outgrowth may be influenced by microbial and inflammatory signals35,36 and chemotherapy exposure in secondary leukemias.37 Social isolation and stress impact glucocorticoid signaling influencing biologic characteristics in breast cancer.38 Stress-related gene expression pathways, including a monocytic transcriptional signature and interferon signaling, have also been linked to AML survival.39 Our observations reinforce the idea that the development and progression of leukemia may be the culmination of stochastic molecular events and an individual's “exposome.”40,41
Hispanic patients were younger, with lower comorbidity indices and favorable ELN risk groups, and displayed higher response rates to intensive chemotherapy, However these factors did not translate into improved survival compared with NHW patients. A study of patients with AML in Mexico showed that despite favorable mutation profiles, outcomes were poor, with an overall survival of only 9 months.42 Morbid obesity rates were two-fold higher in both Hispanic and NHB patients compared with NHW patients but did not predict leukemia survival in the current study. Although obesity has a negative prognostic impact in acute lymphoblastic leukemia,43 the role of obesity in AML outcomes remains debatable and has not been borne out in CALGB (Cancer and Leukemia Group B)44 and SWOG (Southwest Oncology Group)45 analyses.
A major strength of this study is the patient sample intentionally designed to represent diverse urban neighborhoods (supplemental Figure 2). Building a comprehensive database encompassing disease biology, patient comorbidities, neighborhood characteristics, treatment patterns, and complications allowed us to construct an epidemiologic landscape for AML that was lacking in previous population-based or cooperative group analyses. Also, with 40% of our cohort representing minority populations, we were able to gain new insights into the differences in molecular drivers of leukemia and treatment outcomes based on race/ethnicity and structural racism.
Our study is limited by its retrospective nature. Median follow-up varied considerably across diagnosing hospitals; however, time at risk was controlled for as a model covariate along with diagnosing hospital. Together, control for these two variables should eliminate any bias associated with differential follow-up. The generalizability is impacted by the urban population with 44% of patients under 60 years of age compared with 26% of patients with AML in statewide data. Sample size also limits power to detect differences between non-Hispanic and Hispanic groups. In addition, our dataset lacked information on individual social position including education, household income, and primary language, which would have provided important complementary information to neighborhood measures. Comprehensive molecular profiling was absent in nearly half of diagnostic AML samples, leading us to use the earlier ELN 2010 classification, which may have influenced the strength of the tumor biology variable in the mediation analysis. Lastly, there could be residual confounding of our controlled direct associations because of not controlling for additional mediating domains.
Importantly, our work brings to the forefront a clear role for structural racism as a mediator of racial disparities in AML outcome. This study highlights the need to develop measures of structural racism and examine their contribution to current prognostic algorithms. Allostatic load, a composite measure of stress-induced biologic risk, is socially patterned and has been recognized to contribute to tumor characteristics46 and outcomes.47 Future studies could evaluate allostatic load measures in AML prognostication. Analogous to molecular tailoring of therapy, measures of structural racism need to be developed as a complementary aspect of personalized leukemia therapy.
Further work is necessary to understand the early period after diagnosis among NHB and Hispanic patients to develop interventions to reduce observed disparities in AML mortality. Engagement with community partners can identify structural racism barriers to leukemia treatment for broader interventions and policy changes exemplified by work from the Metropolitan Chicago Breast Cancer Task Force.48 With widespread adoption of novel low intensity therapies, the shift from inpatient to outpatient management of leukemia is placing increasing strain on tenuous social support systems and threatens widening disparities during AML therapy. While in its infancy, our work clearly establishes that recognizing and addressing structural racism is likely to contribute significantly to narrowing disparities in leukemia survival.
Acknowledgments
This work was funded by the University of Illinois Cancer Center Director’s Pilot grant awarded to I.K. and G.H.R. Study data were collected and managed using REDCap electronic data capture tools hosted at the University of Illinois Chicago CCTS and supported by the National Center for Advancing Translational Sciences, National Institutes of Health, through grant UL1TR002003.
Authorship
Contribution: I.K., I.E.A., and G.H.R. designed the research, analyzed the data, and wrote the paper; I.E.A., A.A.P., W.B.P., P.R., A.A., M.B., A.D., S.B., K.P., M.A.-M., K.G., R.G., K.C., M.Z., and S.B. collected and organized the data; and S.B.T., J.G.Q., J.P.G., M.L.L., S.B., W.S., and J.K.A. were involved in designing the research and provided valuable edits to the manuscript.
Conflict-of-interest disclosure: The authors declare no competing financial interests.
Correspondence: Irum Khan, University of Illinois Chicago, 840 S Wood St, 820-E CSB, Chicago, IL 606012; e-mail: irumkhan@uic.edu.
Requests for data sharing may be submitted to Irum Khan (irumkhan@uic.edu).
The online version of this article contains a data supplement.
There is a Blood Commentary on this article in this issue.
The publication costs of this article were defrayed in part by page charge payment. Therefore, and solely to indicate this fact, this article is hereby marked “advertisement” in accordance with 18 USC section 1734.

This feature is available to Subscribers Only
Sign In or Create an Account Close Modal